Introduction
The rumen ecosystem is populated by a highly diverse collection of anaerobic micro-organisms, including protozoa, fungi, bacteria and archaea, which allow animals to utilise plant fibre as an energy source. According to Cheng and McAllister (Reference Cheng and McAllister1997), the microbial populations of the rumen were effectively subdivided into three groups: (1) those free in the rumen fluid, (2) those attached to feed particles and (3) those associated with the rumen wall. Microbial populations associated with feed particles are numerically predominant and accounted for up to 70% to 80% of the total microbial populations (Craig et al., Reference Craig, Broderick and Ricker1987) and were estimated to be responsible for 80% of total rumen endoglucanase activity (Minato et al., Reference Minato, Endo, Ootomo and Uemura1966), leaving no doubt that particle-associated microbial populations were responsible for the majority of fibre degradation in the rumen.
In the rumen, attachment and colonisation are the initial steps in the digestive process, but the rate of colonisation and the bacterial community of different plant materials could be different due to plant physical and chemical factors as well as rumen microbial factors. Ruminal micro-organisms could rapidly associate with and colonise recently ingested feed particles (Cheng et al., Reference Cheng, Stewart, Dinsdale and Costerton1984) and form microcolonies on feed particles (Cheng et al., Reference Cheng, Fay, Coleman, Milligan and Costerton1981) as revealed by electron microscopy studies. Mosoni et al. (Reference Mosoni, Fonty and Gouet1997) reported that attachment of Ruminococcus flavefaciens and Fibrobacter succinogenes peaked after 45 min of contact with limited cellulose in vitro. Recently, using competitive PCR assays, an in sacco study showed that three representative cellulolytic bacteria, F. succinogenes, R. flavefaciens and Ruminococcus albus, could move to new plant fragments, and the initial attachment was mostly accomplished within 10 min, which was then followed by bacterial growth and fibrolytic action (Koike et al., Reference Koike, Pan, Kobayashi and Tanaka2003a). Akin (Reference Akin1980) evaluated different morphological types of rumen bacteria associated with different substrates by electron microscopy and showed that the percent ratio of encapsulated cocci to irregularly shaped bacteria between Bermuda grass and fescue was different. Koike et al. (Reference Koike, Yoshitani, Kobayashi and Yanaka2003b) analysed the rumen bacterial community associated with orchardgrass and alfalfa particles by 16S rDNA sequencing and found that sequences sharing 90% to 96% similarity with Treponema bryantii were detected only in the library from alfalfa. However, Ho et al. (Reference Ho, Abdullah and Jalaludin1996) found that the morphology of bacterial colonies on five crop residues (palm press fibre, untreated or treated with ammonium hydroxide, oil palm trunk shaving, sago waste and rice straw) was similar and the bacterial community consisted mostly of mixed rod cocci, diplococci and spirochaetes.
Although numerous studies have been conducted with fibre-associated bacterial community using traditional or molecular techniques, little information is available on the dynamics of bacteria associated with feed particles during incubation in the rumen. DNA fingerprinting techniques such as denaturing gradient gel electrophoresis (DGGE) and temperature gradient gel electrophoresis (TGGE) have been proven to be quick, sensitive and effective tools in describing the microbial diversity and dynamics of a variety of complex ecosystems (Sigler and Turco, Reference Sigler and Turco2002; Gomes et al., Reference Gomes, Fagbola, Costa, Rumjanek, Buchner, Mendona-Hagler and Smalla2003), including the gastrointestinal tract (Kocherginskaya et al., Reference Kocherginskaya, Aminov and White2001; Konstantinov et al., Reference Konstantinov, Zhu, Williams, Tamminga, de Vos and Akkermans2003; Zhu et al., Reference Zhu, Williams, Konstantinov, Tamminga, De Vos and Akkermans2003). Combined with cloning and sequencing, the fingerprinting techniques allow us to analyse phylogenetic sequences of bands generated by community members (Gomes et al., Reference Gomes, Fagbola, Costa, Rumjanek, Buchner, Mendona-Hagler and Smalla2003). In the present study, Italian ryegrass leaf, Italian ryegrass stem and rice straw, representing different carbohydrate compositions, were used as substrates and PCR/DGGE with subsequent sequence analysis were used to monitor the dynamics of and identify bacteria associated with substrates during 24 h of nylon bag incubation in the rumen of goats.
Material and methods
Animals and sampling
All surgical and animal care procedures throughout the study followed protocols approved by Experimental Animal Care and Use guidelines (Chinese Science and Technology Committee, 1998). Three ruminally fistulated Nanjing local goats (male, 2 years old, average live weight 25.6 kg) were used in this study. Chinese wildrye (Aneurolepidium chinense (Trin.) Kitag., 6.7% crude protein (CP) and 64.4% neutral-detergent fibre (NDF)) hay were offered to the animals twice daily at 0800 and 1800 h, with a total of 1 kg hay per day per animal. The goats were penned individually and had free access to water. Nylon bags (7 × 12 cm, 50 μm in pore size, two bags per substrate at each incubation time) containing 1 g of Italian ryegrass leaf (13.3% CP and 68.2% NDF), Italian ryegrass stem (10.5% CP and 70.9% NDF) and rice straw (4.3% CP and 77.1% NDF), respectively, all in the length range of 0.5 to 1.0 cm, were placed in the rumen of goats immediately prior to morning feeding. After 10 min, 30 min, 1, 6, 12 and 24 h of incubation, bags were retrieved from the rumen. To remove bacteria not tightly associated with substrates, bags were rinsed thoroughly in water (39°C) and then squeezed by hand to remove excess water. To test whether the dynamics of fibre-associated bacterial community in nylon bags was related to the fluctuation of rumen content bacterial community, rumen content samples were also collected at intervals for comparisons. Rumen content and the substrate residues with bacterial biomass were placed in 10-ml polypropylene tubes and then stored at −20°C until used for DNA extraction.
DNA extraction
DNA was extracted according to a bead-beating method using a mini-bead beater (Biospec Products, Inc., Bartlesville, OK, USA) and followed by phenol-chloroform extraction (Zoetendal et al., Reference Zoetendal, Akkermans and De Vos1998). The solution was then precipitated with ethanol and pellets were suspended in 50 μl of pH 8.0 Tris-EDTA (ethylenediaminetetraacetic acid) buffer (10 mmol/l Tris-HCl and 1 mmol/l EDTA).
PCR amplification
Primers U968-GC (5′-CGC CCG GGG CGC GCC CCG GGC GGG GCG GGG GCA CGG GGG GAA CGC GAA GAA CCT TAC-3′) and L1401 (5′-CGG TGT GTA CAA GAC CC-3′) were used to amplify the V6 to V8 regions of the bacterial 16S rDNA (Nübel et al., Reference Nübel, Engelen, Felske, Snaidr, Wieshuber, Amann, Ludwig and Backhaus1996). PCR was performed with the Taq DNA polymerase kit from Promega (Madison, WI, USA). The samples were amplified using the following programme: 94°C for 5 min, and 35 cycles of 94°C for 30 s, 56°C for 20 s, 68°C for 40 s and 68°C for 7 min last extension. Aliquots of 5 μl were analysed by electrophoresis on 1.2% agarose gel (w/v) containing ethidium bromide to check the sizes and amounts of the amplicons.
DGGE
Amplicons of V6-V8 regions of 16S rDNA were used for sequence-specific separation by DGGE according to the specifications of Muyzer et al. (Reference Muyzer, de Waal and Uitterlinden1993), using a Dcode TM system (Bio-Rad Laboratories, Hercules, CA, USA). DGGE was performed in 8% polyacrylamide gels containing 37.5 : 1 acrylamide-biacrylamide and a denaturing gradient of 38% to 48% of urea. The electrophoresis was initiated by pre-running for 10 min at 200 V and subsequently ran at a fixed voltage of 85 V for 12 h at 60°C. After completion of electrophoresis, the gel was stained with AgNO3 (Sanguinetti et al., Reference Sanguinetti, Dias Neto and Simpson1994) and scanned using a GS 800 Calibrated Densitometer (Bio-Rad Laboratories).
Analysis of the DGGE gels
DGGE profiles were analysed by software of Molecular Analyst 1.61 (Bio-Rad Laboratories) to obtain densitomeric curves and subsequently similarity indices. Levels of similarity between fingerprints were calculated according to the Dice coefficient. The unweighted pair group method with arithmetic averages (UPGMA) was used to create a dendrogram (Michener and Sokal, Reference Michener and Sokal1957; Zhu et al., Reference Zhu, Williams, Konstantinov, Tamminga, De Vos and Akkermans2003).
Sequence analysis
PCR was performed to amplify bacterial 16S rDNA (Zoetendal et al., Reference Zoetendal, Akkermans and De Vos1998) with a Taq DNA polymerase kit from Promega using primers 8f (5′-CAC GGA TCC AGA GTT TGA T(C/T)(A/C) TGG CTC AG-3′) and 1510r (5′-GTG AAG CTT ACG G(C/F)T ACC TTG TTA CGA CTT-3′) (Lane, Reference Lane1991). PCR products were purified with the Wizard SV Gel and PCR Clean-Up system (Promega) according to the manufacturer’s instruction. Purified PCR product was cloned into a pGEM-T (Promega) and followed by transformation into competent Eshchericia coli JM109. Transformants were obtained and cultured, and inserts were checked as described by Zhu et al. (Reference Zhu, Williams, Konstantinov, Tamminga, De Vos and Akkermans2003). Plasmids with appropriately sized insert (approximately 1.5 kb) were used to amplify the V6 to V8 regions of the bacterial 16S rDNA as described above. According to Zoetendal et al. (Reference Zoetendal, Akkermans and De Vos1998), the amplicons were compared with those DNA-derived mixture PCR products from the same samples in DGGE profile. When amplicons matched with distinct bands on the DGGE profile, e.g. with the same band motilities, their corresponding 16S rDNA were selected for sequencing. These selected strains containing corresponding plasmids were subjected to sequencing by Invitrogen Biotechnology Co., Ltd (Shanghai, PR China). The sequences were checked for chimerical constructs by the RDP CHECK-CHIMERA program (Maidak et al., Reference Maidak, Cole, Parker, Garrity, Larsen, Li, Lilburn, McCaughey, Olsen, Overbeek, Pramanik, Schmidt, Tiedje and Woese1999). None of the sequences were found to be PCR-generated chimeras. Homology searches of the GenBank DNA database were performed with BLAST Search.
Nucleotides sequence accession numbers
Nucleotides sequences have been deposited in the GenBank database under the accession numbers DQ085078-DQ085090.
Results
Dynamics of substrate-associated rumen bacteria
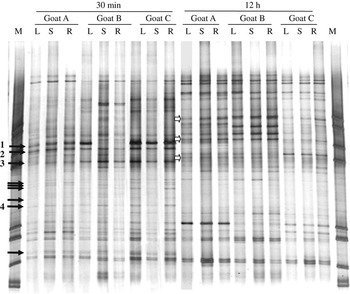
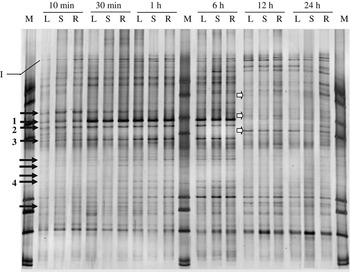
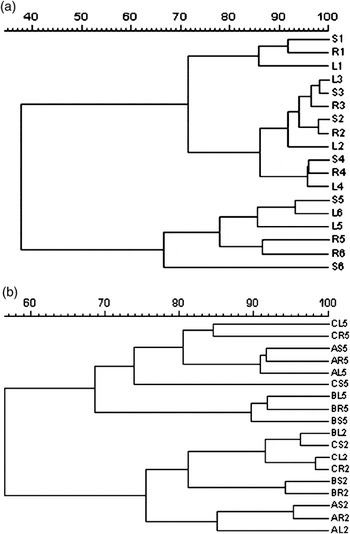
The dynamics of rumen bacteria associated with substrates in three goats showed similar DGGE profiles as shown in Figure 1. Figure 2, a representative of all DGGE profiles, shows the dynamics of rumen bacteria associated with three substrates in goat C. In general, samples collected from 10 min to 6 h had similar DGGE pattern, with up to 24 predominant bands to each sample, including 14 common bands to all samples, suggesting a rapid and stable colonisation by a highly diverse bacterial community. Samples collected at 12 and 24 h showed similar DGGE patterns but had great difference with DGGE patterns from 10 min to 6 h. Nine bands common for all samples from 10 min to 6 h disappeared at 12 and 24 h (Figure 2, solid arrow indicated). Three new bands appeared at 12 h and remained present at 24 h (Figure 2, white arrow indicated). Similarity analysis showed two clearly different clusters in DGGE similarity dendrogram (Figure 3a). Cluster 1 contained samples from 10 min to 6 h, while cluster 2 contained samples from 12 to 24 h. The similarity between the two clusters was only 38%, which suggested that the substrate-associated bacterial community was stable from 10 min to 6 h but experienced a marked shift after 12 h of incubation, i.e. 2 h after the second feeding.
DGGE profiles of bacterial community associated with Italian ryegrass leaf (L), Italian ryegrass stem (S), rice straw (R) samples from rumen of three goats (A, B and C) after 30 min and 12 h of incubation. Solid arrow indicated bands existed after 30 min of incubation and disappeared after 12 h of incubation. White arrow indicated bands appeared after 12 h of incubation. The corresponding clones of bands indicated by solid arrow and their closest sequence relatives from the GenBank are: 1, A5 uncultured rumen bacterium; 2, A6 Roseburia intestinalis; 3, A7 uncultured bacterium and 4, A10 Eubacterium ramulus. M-marker.

DGGE profiles of bacteria community associated with Italian ryegrass leaf (L), Italian ryegrass stem (S), rice straw (R) samples from rumen of goat C during different incubation time (10 min, 30 min, 1, 6, 12 and 24 h). Solid arrow indicated bands existed from 10 min to 6 h of incubation and then disappeared. White arrow indicated bands appeared from 12 h of incubation. Band I matching B. fibrisolvens existed at all substrates during the 24 h of incubation. The corresponding clones of bands indicated by solid arrow and their closest sequence relatives from the GenBank are: 1, A5 uncultured rumen bacterium; 2, A6 Roseburia intestinalis; 3, A7 uncultured bacterium and 4, A10 Eubacterium ramulus. M-marker.

Similarity analysis of DGGE profiles of bacterial community associated with different substrate samples from rumen of different goat. (a) goat C after 10 min, 30 min, 1, 6, 12 and 24 h of incubation; (b) goat A, B and C after 30 min and 12 h of incubation. L – ryegrass leaf, S – ryegrass stem, R – rice straw. Figures 1 through 6 indicate different incubation time: 1, 10 min; 2, 30 min; 3, 1 h; 4, 6 h; 5, 12 h; and 6, 24 h. For example, S1 means DGGE profiles of bacterial community associated with ryegrass stem after 10 min incubation; CL5 means DGGE profiles of bacterial community associated with ryegrass leaf after 12 h incubation of goat C.

The above shift was also observed in Figure 1, which shows a clear comparison between the initial (30 min) and the late (12 h) stage of incubation in three goats. Although some difference existed between individual animals, generally the substrate-associated bacterial communities among three goats were similar in both initial and late stages of incubation. All samples collected at 30 min had similar DGGE patterns, with up to 13 common predominant bands on each sample. Samples collected at 12 h also had similar DGGE patterns, with up to 16 common predominant bands on each sample. Many bands (Figure 1, solid arrows indicated) common for all samples at 30 min had disappeared at 12 h and most of those bands were at the lower part of the DGGE gel; a few new bands (Figure 1, white arrows indicated) appeared at the upper of the gel for all samples. Similarity analysis of the DGGE profiles also showed two clearly different clusters, one with samples of 30 min and the other with samples of 12 h (Figure 3b).
Dynamics of rumen content bacterial and substrate-associated bacterial community
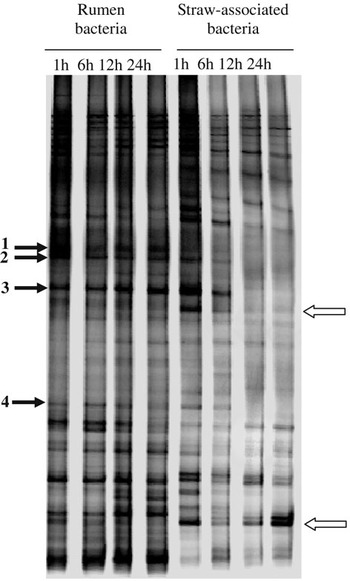
To test whether the above shift of substrate-associated bacterial communities was related to the fluctuation of rumen content bacterial community, rumen content bacteria were compared with rice straw-associated bacteria in bacterial community dynamics at different time intervals. In general, as presented in Figure 4, rumen content samples collected from 1 to 24 h showed similar DGGE pattern, suggesting that rumen bacterial community remained fairly stable over a period of 24 h. Furthermore, many bands in rumen content samples are also common to the residue samples in the nylon bag. This is particularly true with the residue samples from initial incubation (1 and 6 h) as the majority of the bands in rumen liquor could be found in these residue samples. It could also be seen that two bands were only present in residue samples. As mentioned before, substrate residue samples collected from 1 to 6 h had different DGGE pattern, from those collected at 12 and 24 h, e.g., some bands common for samples from 1 to 6 h disappeared at 12 and 24 h. This suggested that substrate-associated bacterial community was stable from 1 to 6 h, but a lot of bacteria left substrates after 12 h of incubation, i.e. 2 h after the second feeding.
DGGE profiles of rumen content bacterial and rice straw-associated bacterial community of goat C after 1, 6, 12 and 24 h of feeding. The corresponding clones of bands indicated by solid arrow and their closest sequence relatives from the GenBank are: 1, A5 uncultured rumen bacterium; 2, A6 Roseburia intestinalis; 3, A7 uncultured bacterium and 4, A10 Eubacterium ramulus.

Identification of cloned 16S rDNA sequences in DGGE profiles
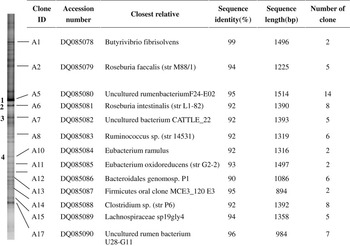
As shown in Figures 1 and 2, bacterial communities associated with three different substrates were similar during 30 min to 6 h of incubation, and the rice straw sample at 30 min incubation gave relatively more bands as shown in Figure 1. Thus, the rice straw sample at 30 min incubation from goat C was chosen as a representative, bacterial 16S rDNA was amplified, cloned and sequenced in order to give a better diversity analysis of the predominant bacteria associated with substrates in the rumen. Among the 92 positive clones, 72 matched one of the 13 dominant bands in the DGGE profile, while 20 did not match any visible bands. Among the 13 sequences of the matching dominant bands (Figure 5), six showed high similarity with a known sequence of fibrolytic bacteria in GenBank; two (corresponding to clone A2 and A6) showed 94% and 92% similarity with known butyrate-producing bacteria sequence of Roseburia faecalis and Roseburia intestinalis, respectively; and the other three (corresponding to clone A5, A7 and A17) did not match any known sequence in GenBank. Among the six sequences that showed high similarity with known sequences of fibrolytic bacteria, however, only one (corresponding to clone A1) showed 99% similarity with Butyrivibrio fibrisolvens, the other five showed 90% to 96% similarity with fibrolytic bacteria, including well-known cellulolytic bacteria, such as Ruminococcus and Clostridium, and some phenolic compounds degradation bacteria, such as Eubacterium ramulus and Eubacterium oxidoreducens (Krumholz and Bryant, Reference Krumholz and Bryant1986; Braune et al., Reference Braune, Gütschow, Engst and Blaut2001).
Clones, with accession number, percentage of similarity to known sequences in GenBank and sequence length, were retrieved from the rice straw sample after 30 min incubation in rumen of goat C.

The bands, matched with clones A1, A2, A8, A11, A12, A13, A14, A15 and A17, were common in all DGGE profiles. However, four bands indicated with solid arrow 1, 2, 3 and 4 in Figures 1, 2 and 4, could only be seen at samples during 10 min to 6 h incubation. Their matching clones A5, A6, A7 and A10 have sequences related to uncultured rumen bacterium (95%), R. intestinalis (92%), uncultured bacterium (97%) and E. ramulus (92%), respectively (Figure 5).
Discussion
This is the first report on the dynamics and composition of rumen bacterial populations associated with different substrates analysed by cultivation-independent, DNA-based approaches. Ruminal micro-organisms could rapidly adhere and colonise recently ingested feed particles (Cheng et al., Reference Cheng, Stewart, Dinsdale and Costerton1984) and the initial attachment of F. succinogenes and two Ruminococcus species to stems of orchardgrass hay was mostly accomplished within 10 min (Koike et al., Reference Koike, Pan, Kobayashi and Tanaka2003a). Our results showed that rumen bacteria could form a complex and stable community on three different substrates within 10 min of incubation, suggesting the existence of a large number of ‘ready to attach’ cells in the rumen (Koike et al., Reference Koike, Pan, Kobayashi and Tanaka2003a). However, after 12 h of incubation (2 h after the second feeding), the stable bacterial community changed greatly, some bacteria disappeared and other bacteria appeared at the same time. However, the exact mechanism behind this change is not clear. To check whether the rumen content bacterial community experienced a similar shift as the substrate-associated bacterial community, a representative, rice straw sample that covered relatively more diverse bacteria was chosen for the comparison with the rumen content sample (Figure 4). Although it would be ideal to include all the three substrates in this comparison with rumen content sample, the results indeed showed that the bacterial communities in the rumen content remained relatively stable over 24 h while rice straw-associated samples experienced the shift as observed in Figures 1 and 2. Therefore, the fluctuation of rumen bacterial community was not the major reason causing the great change of substrate-associated bacterial community after 12 h of incubation. However, with the coming of new plant fibres after the second feeding, it is reasonable that some fibre-associated bacteria, such as those indicated with solid arrows 1, 2, 3 and 4 in Figures 1, 2 and 4, may have left ‘old’ substrates and moved to new plant fibres. Therefore, it can be reasoned that these bacteria may play an important role in the initial degradation stage. Interestingly, most bacteria that disappeared after 12 h of incubation were in the lower part of the DGGE gel and therefore considered to have high G + C content. To our knowledge, the present study for the first time identified these bacteria and most of them were indeed closely related to fibrolytic bacteria according to their 16S rDNA sequences (Figure 5), and the G + C content of these bacteria were relatively high, between 52% and 54% calculated based on the sequences generated. However, according to Stackebrandt and Goebel’s (Reference Stackebrandt and Goebel1994) study that sequence similarity of 97% was the threshold for being considered as the same species, these bacteria matching bands indicated with solid arrows 1, 2, 3 and 4 in Figures 1, 2 and 4 were all yet unknown species. Therefore, the identity and role of these bacteria need to be further studied.
Interestingly, Figure 4 showed that most of the bands in substrate residue samples could be found in rumen liquor, but two bands (indicated by white arrow) could be seen only in substrate residue samples. In theory, substrate-associated bacteria in the rumen either come from substrate itself or from rumen liquor. However, the bacteria brought into rumen with substrates in the nylon bags are most likely aerobic and unlikely to associate with substrates tightly; most of them would likely have been washed off by rumen liquid. Therefore, it is conceivable that those two bacteria come from rumen liquid. It is possible that those two bacteria are in relatively low density and not the dominant bacteria in the rumen liquid, and therefore could not form detectable DGGE bands since only those dominant bacteria could form visible bands (Zoetendal et al., Reference Zoetendal, Akkermans and De Vos2001). With substrates available, ryegrass and rice straw in this case, these two bacteria were likely to become the dominant bacteria and consequently form visible DGGE bands.
Substrate type may affect members of fibre-associated rumen bacterial community. Koike et al. (Reference Koike, Yoshitani, Kobayashi and Yanaka2003b) reported that Treponema bryantii were frequently found in the clone library generated from alfalfa samples in the rumen, but not at all in the library from orchardgrass by analysis of 16S rDNA sequences. Our results demonstrated that three substrates showed similar DGGE patterns, suggesting that the majority of the fibre-associated rumen bacteria were common to all the three substrates. In the present study, experimental goats were fed Chinese wildrye, a major forage grass variety in Northeast of China, with nutrition value slightly lower than Italian ryegrass. Previous studies showed that diet may significantly affect the composition of the rumen bacterial community (Dehority and Orpin, Reference Dehority and Orpin1997; Tajima et al., Reference Tajima, Arai, Ogata, Nagamine, Matsui, Nakamura, Aminov and Benno2000). Undoubtedly, a unique bacterial community in the rumen was likely to form with Chinese wildrye in our study. Therefore, when the three different substrates in the nylon bags were exposed to the same bacterial community, the bacterial diversity between substrates was not as great as we expected.
To identify specific bands on the DGGE profile, bands could be manually excised and then sequenced. However, the length of sequences generated from the DGGE gels are usually short (200 to 500 bp). Thus, sequence information from manually excised DGGE bands, as compared to 1500 bp of the whole 16S DNA sequence, does not always allow reliable phylogenetic analyses. Furthermore, comigration of several different sequences that have the same melting behaviour and therefore the same position in the gel, leads to overlapping DGGE bands, which cannot be sequenced directly (Rölleke et al., Reference Rölleke, Gurtner, Drewello, Drewello, Lubitz and Weissmann1999). Alternatively, some studies chose to make a clone library containing fragments of 1500 bp of the 16S ribosomal gene and match clones with specific bands on DGGE gels, with the clones matching with specific bands on DGGE gels further sequenced (Zoetendal et al., Reference Zoetendal, Akkermans and De Vos1998; Konstantinov et al., Reference Konstantinov, Zhu, Williams, Tamminga, de Vos and Akkermans2003; Zhu et al., Reference Zhu, Williams, Konstantinov, Tamminga, De Vos and Akkermans2003). This approach was able to provide more sequence information and thus could give a good indication of phylogenetic position. However, this approach also had its shortcomings as a single band on a DGGE gel was sometimes identified to be different bacterial species (Jackson et al., Reference Jackson, Roden and Perry1998; Sekiguchi et al., Reference Sekiguchi, Tomioka, Nakahara and Uchiyama2001). This is also largely because DNA fragments from some different bacteria have the same melting behaviour and thus the same position on DGGE gels. Therefore, the identities of the organisms in the clone library are possibly related to the organisms identified on the DGGE gels. In the present study, the clone library was constructed and 72 of the 92 positive clones matched one of the 13 dominant bands in the DGGE profile.
Among the 13 sequences of the matching dominant bands, six showed 90% to 99% similarity with known fibrolytic bacterial sequences in GenBank, including cellulolytic bacteria, such as Ruminococcus and Clostridium (Sinha and Ranganathan, Reference Sinha and Ranganathan1983; Stewart et al., Reference Stewart, Flint and Bryant1997), and E. ramulus and E. oxidoreducens (Krumholz and Bryant, Reference Krumholz and Bryant1986; Braune et al., Reference Braune, Gütschow, Engst and Blaut2001). One band (corresponding to clone A1) with its corresponding sequence showed 99% similarity with the sequence of B. fibrisolvens (Figure 5), which was not regarded as major rumen fibrolytic bacteria although some strains of this species have fibrolytic activity (Stewart et al., Reference Stewart, Flint and Bryant1997). However, the band matching B. fibrisolvens existed at all substrates during the 24 h of incubation (Figure 2, band I), suggesting the possible role of this species in fibre degradation. Generally, a highly diverse and complex fibrolytic bacterial community was usually associated with fibre particles. Obviously, both synergistic and competitive interaction would take place among these fibrolytic bacteria during the attachment and degradation to plant particles (Odenyo et al., Reference Odenyo, Mackie, Stahl and White1994; Shi et al., Reference Shi, Odt and Weimer1997). However, their role and interactions in relation to fibre digestion were not clear and need further study.
Bacterial species F. succinogenes, R. flavefaciens and R. albus are generally considered as the representative cellulolytic species in the rumen (Stewart et al., Reference Stewart, Flint and Bryant1997). Competitive PCR assays revealed that the cell number of F. succinogenes was larger than that of the two Ruminococcus species, in samples from rumen digesta of sheep feeding alfalfa hay and from orchardgrass hay residues incubated in the rumen of sheep feeding orchardgrass hay (Koike and Kobayashi, Reference Koike and Kobayashi2001; Koike et al., Reference Koike, Pan, Kobayashi and Tanaka2003a). In a clone library study, Koike et al. (Reference Koike, Yoshitani, Kobayashi and Yanaka2003b) reported that two sequences belonging to F. succinogenes have been obtained from clone libraries of orchardgrass and alfalfa hay samples incubated in the rumen of sheep. However, F. succinogenes-related sequences were not found from clone libraries of rumen content samples of Holstein cows fed alfalfa-timothy hay and concentrate (Tajima et al., Reference Tajima, Aminov, Nagamine, Ogate, Nakamura, Matsui and Benno1999 and Reference Tajima, Arai, Ogata, Nagamine, Matsui, Nakamura, Aminov and Benno2000). In the present study, F. succinogenes-related sequences were also not found from the clone library of rice straw samples. Thus, the presence or the abundance of F. succinogenes-like species may be related to animal type and its diet.
It is widely believed that the majority of the bacteria in the gastrointestinal tract have not been cultured and a great number of unculturable species existed. In the present study, among the 13 sequenced dominant bands, only one sequence has similarity to known bacterial species at higher than 97%, the threshold for being considered as the same species (Stackebrandt and Goebel, Reference Stackebrandt and Goebel1994). Therefore, the fibre-associated bacterial community included a considerable proportion of unknown bacteria, as observed in the rumen digesta (Tajima et al., Reference Tajima, Aminov, Nagamine, Ogate, Nakamura, Matsui and Benno1999).
In our 16S rRNA gene library, only 72 of 92 clones matched the visible bands in the DGGE profile (Figure 5). Therefore, nearly one-fifth of all clones did not match any visible bands in the DGGE profile, which was lower than the previous reports that about half of all clones in the 16S rRNA library did not match any visible bands in the DGGE profile (Konstantinov et al., Reference Konstantinov, Zhu, Williams, Tamminga, de Vos and Akkermans2003). This suggested that a large number of less-dominant bacteria did not form detectable DGGE bands, although some of them could be selected using a cloning approach. However, there are only 72 clones sequenced in our 16S rRNA gene library. Therefore, clone library needs to have more clones sequenced to be really representative of the population in further study.
In conclusion, a highly diverse rumen bacterial community colonised different substrates rapidly and remained stable during the initial 6 h of incubation but experienced a marked change after 12 h of incubation. Italian ryegrass leaf, Italian ryegrass stem and rice straw were colonised with a similar diversity of bacteria. Within the substrate-associated bacterial community, most of them were closely related to fibrolytic bacteria. However, the role and interactions of these substrate-associated bacteria in relation to fibre digestion remained unclear.
Acknowledgements
This work was supported by National Natural Science Foundation of China (grant no. 30371041 and 30530560). We are grateful to Professor Roderick I Mackie for the critical reading of the manuscript during its preparation.