


1. Introduction
Geography has long been considered an explanatory factor conditioning linguistic variation in the German language.Footnote 1 Consequently, traditional synchronic and diachronic accounts of German are often cast in diatopic terms (Mitzka & Schmitt Reference Mitzka and Schmitt1951, Schirmunski Reference Schirmunski1962, Bach Reference Bach1969, Besch et al. Reference Besch, Knoop, Putschke and Wiegand1982, Wiesinger Reference Wiesinger and Charles1989, Eichhoff Reference Eichhoff2011, Russ Reference Russ2013, Elmentaler & Rosenberg 2015, König et al. Reference König, Elspaß and Möller2015). However, while geography is undoubtedly an important conditioning factor, the influence of social factors has often been downplayed and neglected in work on German. In contrast to the multiple strands of variationist work on English (Labov Reference Labov1966, Poplack & Tagliamonte 1989, Ito & Tagliamonte 2003, Tagliamonte & D’Arcy 2004, 2007, Tagliamonte Reference Tagliamonte2008, Tagliamonte et al. Reference Tagliamonte, D’Arcy and Jankowski2010, Tagliamonte & Brooke 2014, Jankowski & Tagliamonte 2019), few studies on German have employed variationist methods to examine the internal and external conditioning factors of variation.Footnote 2 In one of the few German variationist sociolinguistic studies to date, Stratton (Reference Stratton2020a) examined the use of German intensifiers and found that the decision to intensify an adjective was influenced by the social factors gender and age. Building upon this research, the present study explores further the role of linguistic and social constraints in German variation and change by probing an understudied variable domain, namely, adjective variation.
To describe something as positive, speakers of German have a variety of adjectives at their disposal. They can describe something as geil ‘great’, krass ‘great’, top ‘top’, fett ‘great’, toll ‘great’, super ‘super’, derbe ‘great’, spitze ‘super’, prima ‘great’, klasse ‘class’, fantastisch ‘fantastic’, mega ‘great’, abgefahren ‘wicked’, ausgezeichnet ‘excellent’, bombig ‘super’, cool ‘cool’, nice ‘nice’, gediegen ‘topnotch’, sauber ‘cool’, dufte ‘great’, kultig ‘cool’, genial ‘great’, knorke ‘smashing’, schnafte ‘great’, astrein ‘awesome’, among many others.Footnote 3 According to Vogt et al. (Reference Vogt, Dorvel and Galloway2016:90–119), feinst/gril/premium/schneidig ‘great’, fresh/ chefig/sheesh ‘cool’, cheedo ‘super cool’, and lit ‘lit’ are recent incoming variants to the field of positive evaluation.Footnote 4 At the level of discourse, these variants can be comparable in meaning, that is, they can all be used to express positive evaluation. In variationist sociolinguistics, such a class of variants can constitute a linguistic variable, or as Labov (Reference Labov1972:188) puts it, “two or more ways of saying the same thing.” The notion that linguistic variation is not random, haphazard, or free, but instead is structured systematically across linguistic, social, and stylistic dimensions is referred to as “orderly heterogeneity” (Weinreich et al. Reference Weinreich, Labov and Herzog1968:100) and is the major premise of the variationist framework.
Since recent variationist work on English adjective variation found age to be a conditioning factor (Tagliamonte & Brooke 2014, Stratton Reference Stratton2020b, Tagliamonte & Pabst 2020), the present study turns to German adjective variation, specifically to the eclectic class of adjectives of positive evaluation, to examine whether similar structured variability can be observed within this semantic field. Doing so provides insight into the factors that shape the choice to use one German adjective over its synonymously equivalent counterparts. Some examples of the adjectives of positive evaluation that are of interest in this study are provided in 1.
(1)


Using the 1.6 million-word Forschungs- und Lehrkorpus Gesprochenes Deutsch (FOLK; Research and Teaching Corpus of Spoken German), the present study addresses two research questions. First, what is the distribution of adjectives of positive evaluation in FOLK? Answering this question involves collecting all synonymously equivalent variants that are part of this semantic field and examining the contexts in which they appear. Second, is the use of certain adjectives sensitive to social factors such as gender and age? Answering this question involves employing multivariate regression analyses to examine whether or not there are any statistically significant correlates of variation. This study therefore contributes to the body of literature on the social factors that influence or constrain variable choices in the German language, and, moreover, it contributes more globally to crosslinguistic research on adjective variation.
The structure of the paper is as follows. An overview of the characteristics of German adjectives is provided in section 2.1, followed in section 2.2 by a review of the relevant internal and external factors that may affect adjective choice. The notion of a semantic field as it relates to positive evaluation is outlined in section 2.3. The methodology is subsequently delineated in section 3, which consists of information about the corpus and the coding process. The results are reported in section 4, divided into the distributional analysis in section 4.1 and the multivariate analysis in section 4.2. The results are then discussed in section 5, followed by concluding remarks and future directions in section 6.
2. Literature Review
2.1. Adjectives
Durrell (Reference Durrell2003:124) defines adjectives as “words which describe, modify, or qualify nouns and pronouns.” On a syntactic level, adjectives can be described according to their position within an adjective phrase (that is, attributive, predicative, stand-alone/bare), as shown in 2. Attributive adjectives appear before the head noun and are adjuncts, predicative adjectives appear after verbs but not before nouns, and stand-alone adjectives appear by themselves as their own independent discourse unit. Because German is an inflected language, attributive adjectives are inflected for case, number, and gender (Durrell Reference Durrell2003:125, Trost Reference Trost2006:390). However, note that some German adjectives, such as those that end in open syllables, typically do not permit declension (for example, ein rosa/lila Kleid ‘a red/purple dress’), but in certain varieties consonant epenthesis can repair this constraint (as in ein rosanes/lilanes Kleid ‘a red/purple dress’). Some adjectives of positive evaluation, particularly newer ones, do not permit declension because they are either loanwords (such as top—eine top Idee ‘a great idea’ lit. ‘a top idea’, prima—ein prima Interview ‘a great interview’ lit. ‘a prime/first interview’, and super—eine super Idee ‘a great idea’ lit. ‘a super idea’) or they are derived from other parts of speech, such as nouns (as in Klasse ‘class’ > klasse—ein klasse Film ‘a great movie’) and have thus not yet fully adapted to the German adjective system.Footnote 5
(2)

According to Biber et al. (Reference Biber, Johansson, Leech, Conrad and Finegan1999:506), on a semantic level, adjectives fall into two main categories: “descriptors” (such as gut ‘good’, schlecht ‘bad’) and “classifiers” (such as finanziell ‘financial’), where the latter are typically considered nongradable (for example, *sehr finanziell ‘very financial’ and *finanzieller ‘financialer’). While a number of semantic taxonomies have been proposed to describe adjectives both in terms of their denotation (Leisi Reference Leisi1975:39–44, Dixon Reference Dixon1977, Hundsnurscher & Splett 1982, Löffelad Reference Löffelad1989, Weinrich Reference Weinrich1993:522) and their scalar properties (Kennedy & McNally 2005, Paradis Reference Paradis2008), these contrastive semantic classifications are not of particular relevance in the present study given the exclusive focus on adjectives that are synonymous at the level of discourse. Nevertheless, the syntactic properties serve as a point of departure as a potential internal factor that may condition adjective variability.
2.2. Internal and External Correlates
A cornerstone of the variationist approach is the consideration of internal and external factors. Even outside of the field of variationist sociolinguistics, it is easy to recognize that lexical variation can correlate with the external factor geography. A speaker who utters Schlachter ‘butcher’ likely comes from northern Germany, a speaker uttering Fleischer ‘butcher’ likely comes from East Germany, a speaker uttering Metzger ‘butcher’ likely comes from West or Southern Germany, and a speaker uttering Fleischhacker ‘butcher’ likely comes from Southeast Germany (König et al. Reference König, Elspaß and Möller2015:196). With respect to the adjectives of positive evaluation, the use of the adjective leiwand ‘great’ is thought to index an Austrian variety of German (Duden, leiwand), pfundig ‘great’ is thought to index a Bavarian variety of German, and the use of bäumig, fätzig, and herzig ‘great’ is thought to index Swiss varieties of German (Meyer Reference Meyer1989, Christen 2003). Style is also a factor that can affect adjective choice. Adjectives such as herrlich ‘marvelous’, hervorragend ‘outstanding’, and exzellent ‘excellent’ may appear in more formal contexts, whereas geil ‘great’ and krass ‘cool’ may appear in more informal contexts (Dalmas et al. Reference Dalmas, Dobrovol’skij, Goldhahn and Quasthof2015:13).
However, in addition to the explanatory factors geography and style, lexical variation can also correlate with other external factors such as age. Tagliamonte & Pabst (2020) found that in Toronto English, adjectives such as terrific are favored by older speakers, whereas adjectives such as cool are favored by younger speakers. In contrast, they found that in York English, lovely was the variant favored by older speakers. In an earlier study on English adjective variation, Tagliamonte & Brooke (2014) examined adjectives that form part of the semantic field strangeness (for example, weird, strange, bizarre, peculiar, uncanny, etc.) and found that some choices correlated descriptively with age, but not necessarily with gender. For instance, speakers under the age of 60 preferred the adjective weird, whereas speakers over the age of 60 preferred adjectives such as strange, but being male or female did not necessarily affect the choice. Similar results were found in Stratton Reference Stratton2020b where strange was favored by older speakers and weird was used by younger speakers.
In a perceptual study on German adjective variation, Schenker (Reference Schenker1977) found that speakers’ perception of adjectives changed according to the age of the speaker. On the one hand, younger speakers considered astrein ‘great’ (from ast ‘branch’ + rein ‘pure’) to be one of the more fashionable adjectives at the time to express positive evaluation, whereas older speakers considered adjectives such as dufte ‘great’ and klasse ‘class’ to be more fashionable (p. 286). The gender of the speaker was also thought to have an influence on the adjectives used by speakers in the 1970s, with geil ‘great’ considered to be the most popular variant among men, and irrsinnig/poppig ‘great’ considered to be the more favored variants among women (p. 289). Labov’s Principles of Linguistic Change states that women generally lead in linguistic change (Labov Reference Labov2001:274–275), a hypothesis that can be tested on the present dataset of German adjectives of positive evaluation. According to this hypothesis, it is to be expected that women favor incoming or novel variants more frequently than men.
Two decades ago, using anecdotal evidence, Androutsopoulos (Reference Androutsopoulos2001:1) reported having noticed the transition from fabelhaft ‘fabulous’ to fett ‘cool’, with fabelhaft used by older cohorts and fett used by younger cohorts. The only study to date to quantitatively examine the use of German adjectives of positive evaluation using vernacular speech production was Androutsopoulos Reference Androutsopoulos1998. As part of his dissertation on “Jugendsprache” [youth language], Androutsopoulos reported 259 tokens of “wertpositiven Adjektive” [adjectives of positive evaluation]. Of the sample that was reported, geil was the most frequently used adjective among adolescent speakers, followed by genial ‘great’, kultig ‘cool’, korrekt ‘great’, and cool ‘cool’. Although, to date, no research has examined the use of German adjectives within a variationist sociolinguistic framework, the data in the studies mentioned above serve as a useful point of comparison. Apparent time analyses can also be used to make inferences about recent developments within the semantic field of positive evaluation by using generational differences as a proxy for language change.
Although the use of incoming variants such as geil, cool, and krass have come under criticism for “verarmen” [impoverishing] the German language (Kilian Reference Kilian2001:308), objections to using these adjectives are likely a natural response to language change in progress. For instance, the current use of geil ‘great’ lit. ‘horny’ to denote positive evaluation is still met with some contention despite having been used this way for decades (see Schenker Reference Schenker1977). Because the word once meant sexuell erregt ‘sexually excited’, many object to its current use as an adjective stripped of the sexual denotation that can describe inanimate objects, as in ein geiles Moped ‘a great moped’ lit. ‘a horny moped’ or eine geile Wohnung ‘a great apartment’ lit. ‘a horny apartment’ (Keller & Kirschbaum 2003:123–124).Footnote 6 However, it is evident that in its use as an adjective of positive evaluation, the meaning of horny has been bleached semantically. At the level of discourse, that is, how it is used by the speakers in the vernacular within a particular context, geiler Abend lit. ‘a horny evening’ can be synonymous with toller Abend ‘great evening’. One of the goals of the present study is to determine quantitatively which variants are used across the board by the majority of German speakers, and which variants are constrained by conditioning factors of variation. While gender and age differences have been considered in a number of studies on German variation (see, among others, Gal Reference Gal1978, Schlobinski Reference Schlobinski1987, Lippi-Green Reference Lippi-Green1989, Keim Reference Keim2007, Wiese Reference Wiese2012, Stratton Reference Stratton2018), studies using variationist quantitative methods to examine German variation and change are scant (see, however, Lüdeling et al. Reference Lüdeling, Hirschmann and Zeldes2011, Beaman Reference Beaman, Karen, Buchstaller, Fox and James2020, Stratton Reference Stratton2020a), and, to date, no studies have employed variationist methods to examine German adjective variation.
2.3. The Linguistic Variable
By operationalizing the notion of a semantic field as the linguistic variable, Tagliamonte & Brooke (2014) and subsequently Stratton (Reference Stratton2020b) and Tagliamonte & Pabst (2020) circumscribed the variable context to adjectives that were comparable in meaning (for example, adjectives of strangeness: weird, bizarre, strange and adjectives of positive evaluation: cool, awesome, terrific, dandy). While using a semantic field as the linguistic variable was novel for the study of adjectives, “early work in variationist approaches explored the possibility of using semantic fields as a foundation for circumscribing the variable context for semantic and lexical variables” (Tagliamonte Reference Tagliamonte2016a:169). For instance, Sankoff et al. (Reference Sankoff, Thibault and Bérubé1978) analyzed the semantic field of verbs that mean ‘to dwell’ in Canadian French and found that their use was constrained by a number of social factors such as education and socioeconomic status. This led to their notion of “weak complementarity” (Sankoff & Thibault 1981), which Tagliamonte & Brooke (2014:12) explain as “the idea that linguistic variables can be identified by their distribution across the speech community rather than by the fact that they mean exactly the same thing.”
While some have long argued that every word has its own unique meaning (Heilingbrunner Reference Heilingbrunner1858:25, Reichel & Gottsched Reference Reichel and Gottsched1900:38), in following the principle of weak complementarity the adjectives included in the present study serve the same function, that is, they are used to express positive evaluation.Footnote 7 Although the term semantic field can represent more than just synonymy, such as the relationship of hyponymy, in the present study the semantic field of positive evaluation is defined by general synonymy (for example, etwas war cool/geil/krass/ super ‘something was great’).Footnote 8
A crucial concept in variationist sociolinguistics is the Principle of Accountability (Labov 1966:49, Reference Labov1969:737–738, 1972:72). This principle mandates that all competing variants that are part of the variable context are included in the analysis, as opposed to simply the ones that are of interest. In other words, to understand the factors that influence, for instance, the decision to use geil ‘great’, the analysis cannot just be restricted exclusively to the instances where only geil was used. Instead, all variants—here: adjectives of positive evaluation—need to be included in the analysis because in doing so one observes the instances where geil could have been used but was not. Knowing the ratio of occurrence of a particular adjective to the total number of other equivalent variants allows the researcher to investigate correlations. Mathematically, the Principle of Accountability takes into account the fact that some speakers may have had more opportunities to use a given variant than others. By way of illustration, suppose one speaker (Speaker A) uses geil four times, but another speaker (Speaker B) uses geil twenty times. If only instances of occurrence are considered, the logical conclusion would be that Speaker B uses geil more frequently than Speaker A. However, Speaker B may have had more opportunities to use geil (20/1000=2%) than Speaker A (4/5=80%). Therefore, only when the total number of opportunities are factored in (here: the denominator) can any substantial claims be made about frequency (Buchstaller Reference Buchstaller2009:1017, Tagliamonte Reference Tagliamonte2012:11–12). In variationist sociolinguistics, when what occurred is contrasted with the total number of times it could have occurred, it is reported in the “distributional analysis” (Tagliamonte Reference Tagliamonte2012:12; see section 4.1 below).Footnote 9
The motivation for focusing on German adjectives of positive evaluation as the linguistic variable is twofold. First, this class of adjectives is known for its competitive fluctuation, with variants coming in and out of fashion throughout time (Adamzik Reference Adamzik1984:248, Androutsopoulos Reference Androutsopoulos1998:434). This is evident from the sheer number of incoming variants that are reported to have entered German “Jugendsprache” [youth language] in recent years (see Vogt et al. Reference Vogt, Dorvel and Galloway2016:90–119). While other semantic fields such as anger exhibit variation too (for example, sauer/böse/zornig ‘angry’), there are seemingly fewer variants within the envelope of variation. When the variants reported in the present study are compared with variants in other studies (Schenker Reference Schenker1977:302, Androutsopoulos Reference Androutsopoulos1998:438), one finds almost one hundred synonymous German adjectives that denote positive evaluation, which makes this semantic field an interesting locus of variation. The question of which variants are currently in use is an empirical one, which is addressed in this study. The second reason for focusing on adjectives of positive evaluation is that, as mentioned earlier, there is recent comparable crosslinguistic work (Tagliamonte & Pabst 2020). Given that the authors found both internal and external correlates of variation, it is pertinent to examine whether or not adjectives of positive evaluation exhibit similar constraints in German.
3. Methodology: The Corpus and Coding
FOLK is a 1.6-million-word subcorpus of the Datenbank für Gesprochenes Deutsch (DGD; Database for Spoken German), which is publicly available online (Schmidt Reference Schmidt, By John and Andersen2016). As Fandrych et al. (Reference Fandrych, Meißner, Slavcheva, Schmidt and Wörner2012) point out, FOLK is the most frequently used subcorpus of DGD and prior to its compilation, few corpora of spoken German had been made available to the scientific community (Schmidt Reference Schmidt, By John and Andersen2016:397). At the time of abstraction, FOLK contained 219 spontaneous spoken interactions, which had been transcribed orthographically, but the original audio files were still accessible through the corpus platform. The interactions included, but were not limited to, everyday communication such as conversations over coffee, among friends, family, and couples, while doing housework or playing games, as well as exchanges at meetings and with various service providers. Because FOLK contains vernacular speech and is reasonably stratified for gender and age, the corpus data are apt for a variationist analysis.
Following previous work on English adjective variation, a list of adjectives of positive evaluation was compiled based on previous literature and dictionaries/thesauruses (such as Duden). Once this list had been compiled, search queries were run to find these variants in the corpus, which were subsequently downloaded and inspected manually to remove any functionally or synonymously nonequivalent tokens. Particular care was taken with the adjective krass ‘cool’ given that its meaning can be ambiguous as it can also mean ‘extreme’.Footnote 10 Following previous work (Tagliamonte & Brooke 2014, Stratton Reference Stratton2020b, Tagliamonte & Pabst 2020), negative, comparative, and superlative tokens were excluded since these can alter the functional scale of meaning.Footnote 11 Because German adjectives and German adverbs often have no overt morphological difference, adverbs had to be removed manually. Nonintensified instances of the adjective gut ‘good’ were also not included since there is likely a scalar difference between gut ‘good’ and toll ‘great’, the former being weaker than the latter. However, as in Tagliamonte & Pabst 2020, tokens of intensifier + gut were included, which is consistent with Androutsopoulos Reference Androutsopoulos1998, where sehr gut ‘very good’ was listed as synonymous with other adjectives of positive evaluation. Footnote 12 Note that some adjectives can also be used as intensifiers, as in jemand ist top fit ‘someone is super fit’, es war krass geil ‘it was super great’, das ist mega gesund ‘that is mega healthy’, dein Kleid sieht derbe gut aus ‘your dress looks really good’, and er ist super fit ‘he is super fit’. A qualitative reading of the data ensured that these were not included as adjectives.
To ensure that variants were not missed, an additional search was run to compile a list of all adjectives in the corpus. Any adjectives of positive evaluation that appeared on the list that were not mentioned in previous literature were added. After circumscribing the variable context, each adjective utterance was matched with the appropriate sociolinguistic metadata, which included gender, age, and region. Each adjective was also coded for lexical item (that is, the adjectives were lemmatized, for instance, cool, super, toll), for its syntactic position (for example, predicative/attributive position), the presence or absence of a preceding intensifier (such as voll, richtig), and the interaction setting. Coding the data in this way prepared the dataset for the multivariate analysis.
For the multivariate analysis, a series of binary logistic regressions were run using Rbrul (Johnson Reference Johnson2009), with speaker included as a random factor to account for any idiosyncratic interspeaker variability. Following Tagliamonte & Pabst 2020, the dependent variable was the adjective in question (such as toll ‘great’, coded [1]), which was compared against all other variants (coded [0]). The independent variables/factors included in the regression analyses were gender, age, and syntactic position. The factor gender had two levels: [male] and [female], the factor age had six levels: [0–14], [15–24], [25–34], [35–44], [45–59], [60+], and syntactic position had three levels: [attributive], [bare/stand-alone], [predicative].
Given that register and geographical region may also influence adjective choice, including these variables as additional factors in the multivariate analysis would seem fitting. However, both factors were unbalanced in the corpus. While FOLK includes metadata for register under the parameter Interaktionsdomäme ‘interaction domain’, which has four levels—namely, [privat (private)], [institutionell (institutional)], [öffentlich (public)], and [sonstiges (miscellaneous)], 46% of the data in the corpus were private interactions, 31% were institutional interactions, 11% were public interactions, and 12% were miscellaneous inter-actions.Footnote 13 The same is true for geography, which includes data for the three supraregions (North, Central, and South Germany), divided into East and West: [nordwest (northwest)], [nordost (northeast)], [mittelwest (central west)], [mittelost (central east], [südwest (southwest)], [südost (southeast)]; but the data for Central West Germany were weighted at 39%, Northwest Germany 23%, Southwest Germany 17%, and the remaining regions were weighted at less than 10%. Northeast Germany, for instance, made up only 3% of the data. For this reason, including register and geography in the multivariate analysis would have been problematic. These factors were, however, included in the distributional analysis, as sample imbalances were dealt with quantitatively through the Principle of Accountability.
4. Results
4.1. Distributional Analysis
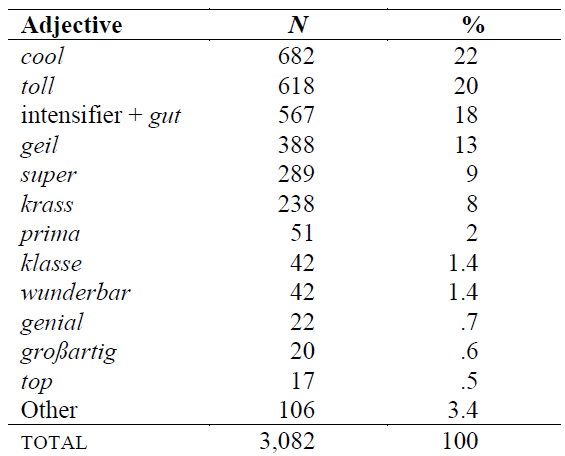
After circumscribing the variable context, there were 3,082 tokens of adjectives of positive evaluation. Of these, 28 different variants were identified. Their distribution is reported in table 1.
The distribution of adjectives of positive evaluation.

Of the 28 variants, the most frequent was cool ‘cool’, which made up 22% of the semantic field, followed closely by toll ‘great’, which made up 20% of the field, and intensifier + gut ‘good’, which made up 18%. The adjective geil ‘great’ occupied fourth position with 13%, followed by super ‘super’ with 9% and krass ‘cool’ with 8%. The most frequent variant in the “other” category was hammer ‘great’ with 14 tokens, followed by fantastisch ‘fantastic’ with 13 tokens, and nice ‘nice’ with 11 tokens.
As for the syntactic distribution, 60% of the adjectives (or 1,837 tokens) appeared predicatively, 29% (or 897 tokens) appeared as stand-alone adjectives, and 11% (or 348 tokens) appeared attributively. This distribution suggests, at least with respect to German adjectives of positive evaluation, that adjectives in general are used most frequently in predicative position and least frequently in attributive position. However, adjectives did have notable descriptive preferences for certain syntactic positions. For instance, frequently used adjectives such as cool appeared mostly in predicative position (54%) and stand-alone position (40%), whereas less frequently used adjectives such as ausgezeichnet ‘excellent’ and fabelhaft ‘fabulous’ appeared most frequently in attributive position (100%). Some examples are provided in 3. Tagliamonte & Pabst (2020:22) proposed a “general systemic evolution for newly developing forms: stand-alone  predicative
 attributive,” a cline that appears to fit the distribution of the German data. Newer variants such as nice and hammer were never found in attributive position.
(3)

While certain adjectives had a tendency to be intensified, others were rarely intensified. For instance, krass ‘cool’ was intensified 31% of the time, which is in range of the average intensification rate observed for German adjectives (Stratton Reference Stratton2020a:197), whereas adjectives such as prima ‘great’ were rarely intensified (6%). The adjective ausgezeichnet ‘excellent’ was never intensified, which might suggest that ausgezeichnet is a closed scale adjective that makes intensification infelicitous, at least intensification by sehr ‘very’.Footnote 14 Many adjectives differed in their intensification rate, with some variants going below the threshold of 31% to varying degrees: super (12%), klasse (21%), cool (27%), geil (28%), toll (30%). While the adjective geil was intensified by a variety of intensifiers (such as voll/richtig/echt ‘really’), it was most frequently intensified by so. Some examples of the intensified adjectives are provided in 4.Footnote 15
(4)

It should be noted that the high frequency of so geil may be a product of the high frequency of the intensifier so as opposed to the collocation so geil. Stratton (Reference Stratton2020a) found so to be among the three most frequently used intensifiers in German, whereas voll was used at a much lower frequency. After so, voll was used most frequently to intensify geil (29 tokens). The intensifier sehr ‘very’ intensified geil (6 tokens) at a considerably lower frequency, suggesting that newer and less accepted adjectives occur more frequently with newer or less accepted intensifiers. In contrast, adjectives that prescriptively are thought of as neutral or standard occur more frequently with more accepted and codified intensifiers (for example, sehr gut ‘very good’ occurred 298 times). While krass was also intensified by a variety of intensifiers (voll/echt/ super ‘really’), it was often intensified by two adjacent intensifiers. Some examples are provided in 5.
(5)

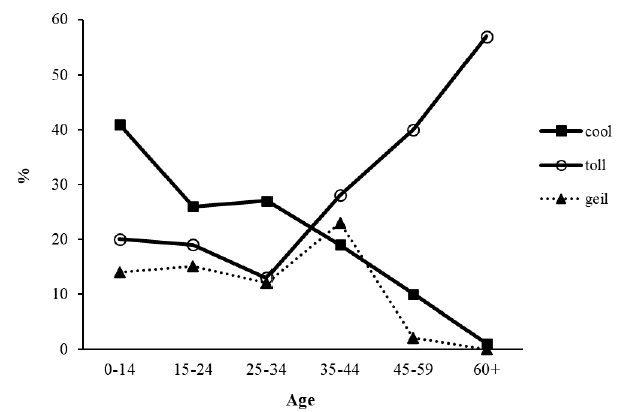
Having examined the distribution of the internal factors of variation, the next step is to examine the distribution of the extralinguistic factors of variation. The first factor of interest is age. By using the apparent time construct (Labov Reference Labov1963, 1966; Bailey et al. Reference Bailey, Wikle, Tillery and Sand1991), generational differences can be used as a proxy for gaining insight into the effect of age on adjective choice. Figure 1 shows the distribution of cool, toll, and geil in apparent time.
The distribution of cool, toll, and geil by age.Footnote 16

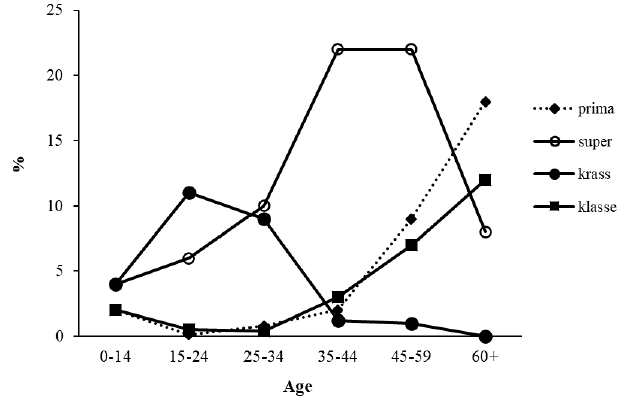
In examining their distribution across different generational cohorts, three findings emerge. First, the younger the speaker, the lower the frequency of the adjective toll ‘great’. Although toll was among the three most frequently used variants (table 1), the decline in frequency among younger generations suggests that it is an adjective that may not remain among the top three variants for long. Second, the distribution indicates that cool is used most frequently by younger cohorts than by older cohorts. In fact, cool was the front runner among speakers aged 24 or younger. Out of 682 tokens of cool, there was only one instance of cool used by a speaker aged 60 or above, which runs parallel to the findings in Toronto English, where cool was reported to be mostly associated with younger speakers (Tagliamonte & Pabst 2020:16–18). Third, as for geil, it was used most frequently by the 35–44 cohort, decreasing in frequency among speakers aged 45 and above. The fact that geil was most frequently used by the 35–44 cohort is interesting in light of the fact that its use is often considered to be characteristic of youth language (Androutsopoulos Reference Androutsopoulos1998). However, its higher frequency among 35–44-year-olds is to be expected, given that geil as an adjective of positive evaluation was likely introduced by younger generations in the 1970s (Schenker Reference Schenker1977). The hypothesis that the 35–44 cohort led this change is supported by the fact that no speakers aged 60 or above were found using geil. The adjective geil was not part of their repertoire. The distribution of prima, super, krass, and klasse appears in figure 2.
The distribution of prima, super, krass, and klasse by age.

The adjectives klasse ‘class’ and prima ‘cool’ show a similar trajectory, that is, they were seldom used by speakers under the age of 45. Their use is therefore seemingly indicative of the speech of older speakers. Their low frequency among younger cohorts also suggests that their use may soon be marginalized to infrequently used variants. As for super, its distribution is similar to that of geil in figure 1, as it too was used most frequently by speakers in the 35–44 range, decreasing in frequency with speakers over the age of 45. The distribution of krass shows a falling trajectory as age increases, indicating the encroachment of a newer variant among younger cohorts.
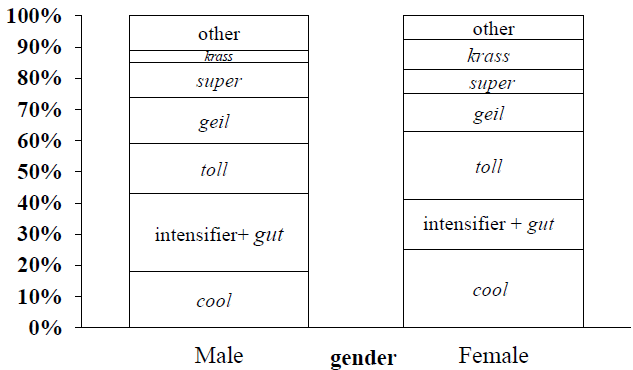
In addition to the adjectives reported in figures 1 and 2, many less frequently used adjectives also appeared to be constrained by age, at least descriptively. For instance, the adjective astrein ‘awesome’ was only used by speakers over the age of 40, whereas genial ‘great’ was only used by speakers under the age of 30. The second external factor of interest is gender. The distribution of variants by gender is reported in figure 3.
The distribution of adjectives of positive evaluation by gender.

Immediately it becomes clear that intensifier + gut was the most favored variant among men, making up 25% of their repertoire, but a much smaller proportion of women’s repertoire with only 16%. In contrast, cool made up 25% of women’s system of positive evaluation adjectives. On this basis, there is descriptive evidence to suggest that women are leaders of the linguistic change of using cool as an adjective of positive evaluation, whereas men continue to use the prototypical intensifier + gut as their number one variant.
The fact that cool made up a larger portion of women’s system of variants than of the men’s system of variants is in line with one of Labov’s Principles of Linguistic Change, according to which women are thought to be the pioneers, or frontrunners of change (Labov Reference Labov2001:274–275). Interestingly, however, geil ‘great’ made up a larger share of men’s system of positive evaluation adjectives. One possible explanation for this is that the sexual connotations associated with using geil leads to its potentially disfavored use among women. This observation is also in line with what has been observed about “covert prestige”, that is, men are thought to use more nonstandard and less prestigious forms than women (Labov Reference Labov1972:243; Trudgill 1972:182–183, Reference Trudgill1983:161; Labov Reference Labov2001:266). In line with this view, women used krass ‘cool’ more frequently than men, perhaps due to the fact that krass is devoid of sexual or taboo connotations.
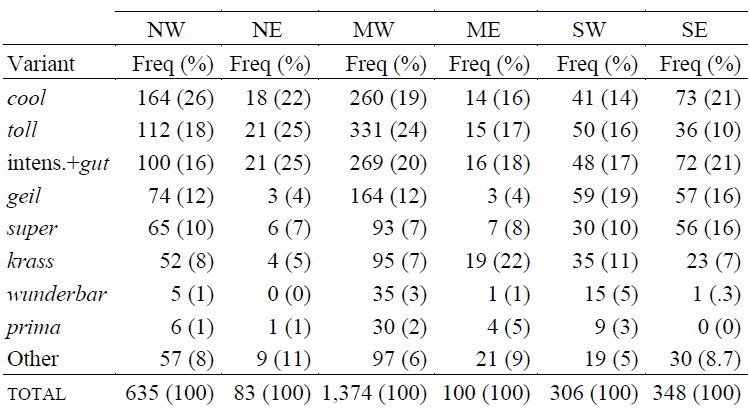
Of the 3,082 tokens of positive evaluation, 2,846 contained the appropriate metadata for geography (table 2). Because geography was not balanced, comparing absolute frequencies of adjectives used in different regions would be misrepresentative. Therefore, table 2 reports the weighted share of variants proportionate to the number of variants used per region. The distribution of variants in Northwest Germany mirrors the overall ranking of variants in table 1.
The distribution of variants by region.

While the order is predominantly the same in Northeast and Central East Germany, the data suggest that toll and intensifier + gut are favored slightly more than cool in these regions. However, the data for these regions are not a fair representation of the population given the low number of tokens in the envelope of variation (that is, less than 90). The difference in ranking is therefore likely attributed to the sampling imbalance as opposed to a clear geographical difference. For instance, there were more older speakers in the sample for Northeast Germany than in the sample for Northwest Germany, which, in light of the distributional evidence on age, would offer an explanation as to why toll is ranked higher in Northeast Germany. Similarly, a purely corpus-driven approach would initially leave one to conclude that wunderbar ‘wonderful’ is not used in Northeast Germany given its lack of attestation. In reality, its absence in the data for this region is also likely a consequence of sampling. Ultimately, only Northwest and the Central West Germany have sufficient sample sizes to adequately represent geography but there were no major differences in the ranking of variants; cool, toll, intensifier + gut were still the top three favored variants.
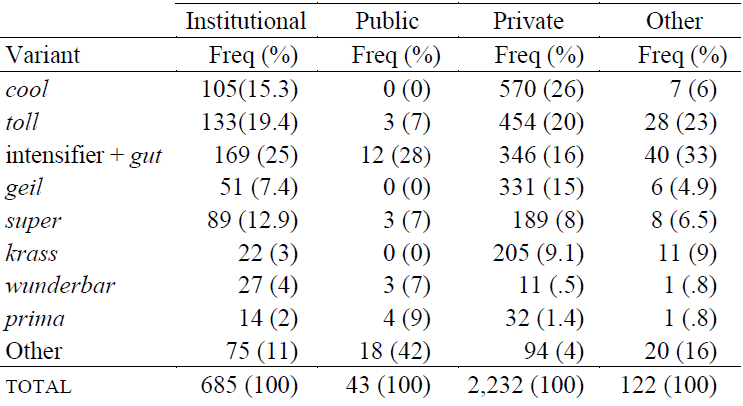
Turning to another external factor, the distribution of adjective variants by register is reported in table 3.
The distribution of variants by register.

As with geography, a comparison of absolute frequencies of a given variant across registers would be problematic in light of balance issues. Therefore, following the Principle of Accountability, the number of times a variant was used in a given register was also compared to the total number of times the variants were used in that register. Doing so revealed a number of findings. First, cool took up a larger share of positive evaluation adjectives in private interactions than in the other three settings, confirming, as one might hypothesize, that the use of cool is more frequent in informal contexts. This hypothesis appears to hold true given that there were no tokens of cool reported in the most formal of the four registers, namely, public/televised interactions. Second, like cool, geil appeared to be reserved for more informal interactions, and its use was not found in public interactions. Third, in contrast to cool and geil, the variants prima and wunderbar made up a larger proportion of the positive evaluation adjectives in public interactions. While their use was found in all four interaction types, their proportional use was higher in public interactions.
After examining the distribution of internal and external factors, it is also useful to examine their interaction. To do so, the syntactic distribution of adjectives was crosstabulated by age, which indicated that while toll was used most frequently in predicative and attributive position by older cohorts, it was preferred in stand-alone position by younger cohorts. Its higher frequent attributive use by older speakers supports the cline outlined by Tagliamonte & Pabst (2020), where incoming forms are shown to favor predicative and stand-alone position, whereas outgoing forms are shown to favor attributive position. This observation holds true for the incoming variant nice: 90% of the time it appeared in stand-alone position (as in sehr nice ‘very nice’) and 10% of the time in predicative position. Interestingly, the opposite was true for intensifier + gut: The younger the speaker, the higher its predicative use. While it was least favored in attributive position by all age groups, it was used attributively more frequently by older speakers than by younger speakers. Although top occurred infrequently in the corpus, when it was used by younger speakers it was used both as a stand-alone adjective or predicatively (as in der ist top ‘he is great’ lit. ‘top’), whereas by older speakers it was always used attributively (as in top Zeugnis ‘great report’).
4.2. Multivariate Analysis
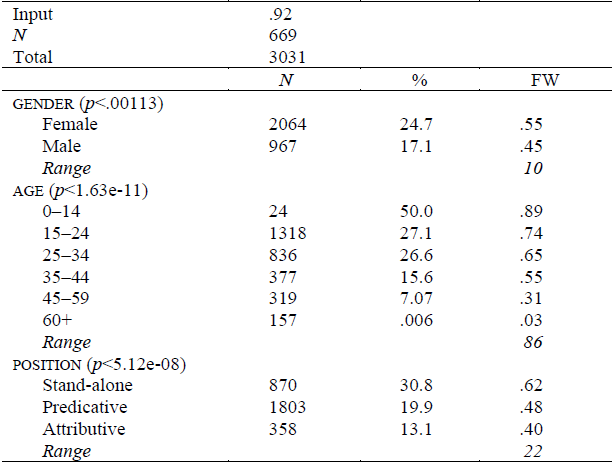
To examine whether or not the factors gender, age, and syntactic position were statistically significant, a series of mixed effects binary logistic regressions were run. However, given the assumptions of regression modeling, regressions could only be run on the most frequent variants. Moreover, because it is recommended that linguistic data in regression models contain a minimum of 10 observations per speaker (Tagliamonte Reference Tagliamonte, Sessarego and Tejedo-Herrero2016b:14), speakers who contributed less than 10 adjectives of positive evaluation were removed. What remained were 3,031 tokens. As mentioned in section 3.2, following Tagliamonte & Pabst 2020, the dichotomous dependent variable was the adjective in question versus all other variants.
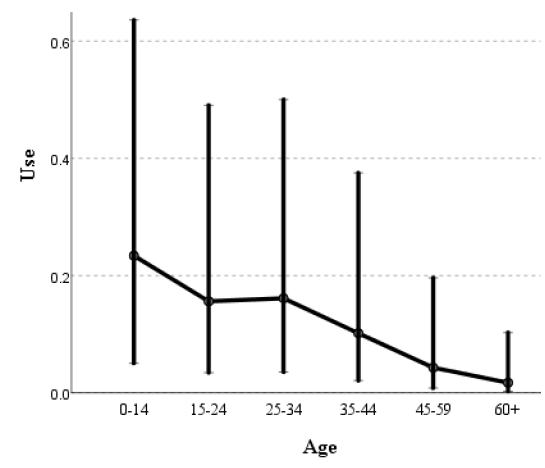
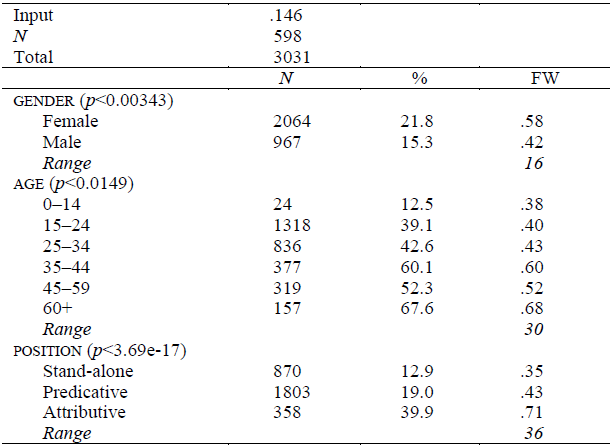
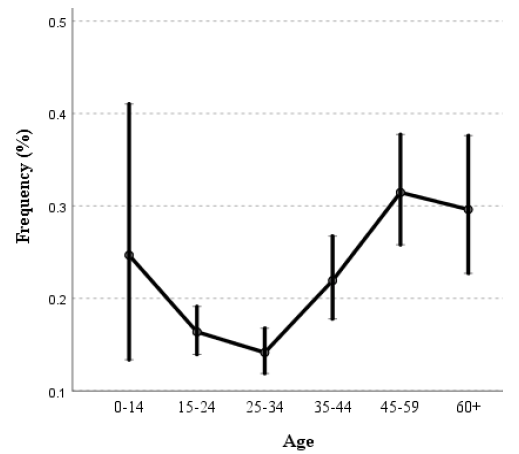
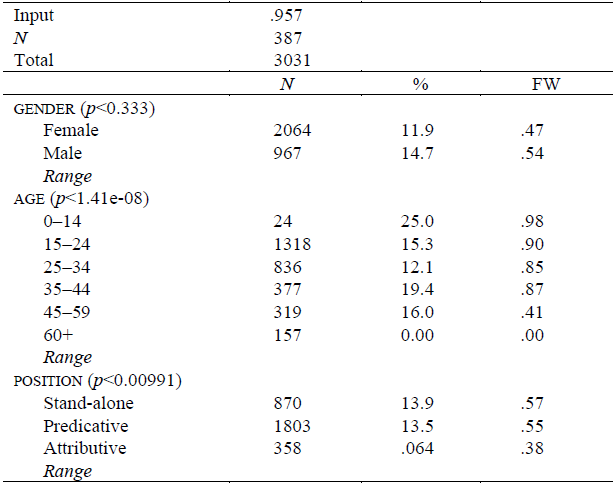
Table 4 reports the results of the regression analysis of cool. All three factors were identified as highly significant, that is, influencing the choice to use cool or not. As the distributional evidence suggested, the model indicated that the older the speaker, the less likely cool was to be used (see figure 4). As for gender, the model confirmed that women use cool more frequently than men at a significance level of .001. As for position, the predilection to use cool in stand-alone position was found to be statistically significant when compared to its use in predicative and attributive position. As the Factor Weight (FW) indicates, stand-alone use of cool was most frequent, followed by predicative use, and by attributive use. The range for the factor age (86) highlights the speed at which the frequency of cool is increasing, as it becomes more and more popular among younger generations.
Estimated marginal means for the use of cool by age.

Logistic regression analysis of cool.

Random Effect (Speaker n=385, SD=1.29)
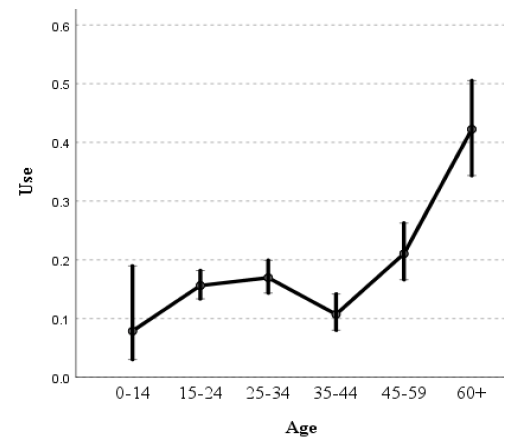
The output of the regression analysis for the use of toll is reported in table 5. As with the previous model, all three factors were identified as statistically significant. Younger speakers used toll significantly less than older speakers, which is shown graphically in figure 5. As for gender, women used toll more frequently than men. The position of the adjective was also identified as a constraint. The adjective toll appeared most frequently in attributive position and least frequently in stand-alone position. Finally, the model also found an interaction effect between young speakers and the use of toll as a stand-alone adjective. Speakers aged 14 or below used toll in stand-alone position more frequently than any other age group.
Logistic regression analysis of toll.

Random Effect (Speaker n=385, SD=1.25)
Estimated marginal means for the use of toll by age.

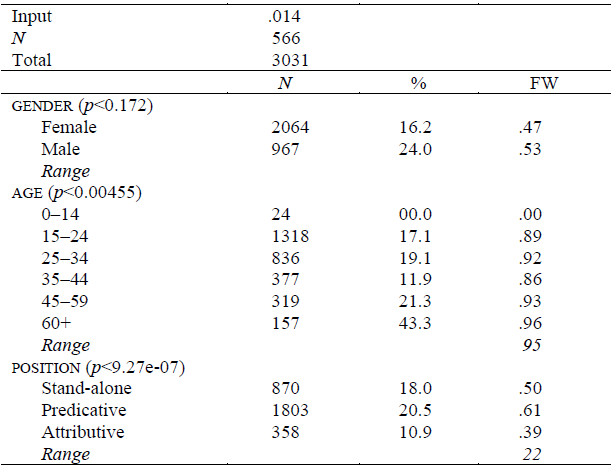
Table 6 reports the output of the regression analysis of intensifier + gut. While gender was not a significant factor, the model found the age of the speaker to be statistically significant, with intensifier + gut favored most frequently among older speakers. All speakers used intensifier + gut less frequently than speakers in the 60+ cohort. A graphical representation is provided in figure 6. The model also identified syntactic position as a significant factor, with attributive use least frequent, as indicated by the Factor Weight (FW).
Estimated marginal means for the use of intensifier + gut by age.

Logistic regression analysis of intensifier + gut.

Random Effect (Speaker n=385, SD=1.24)
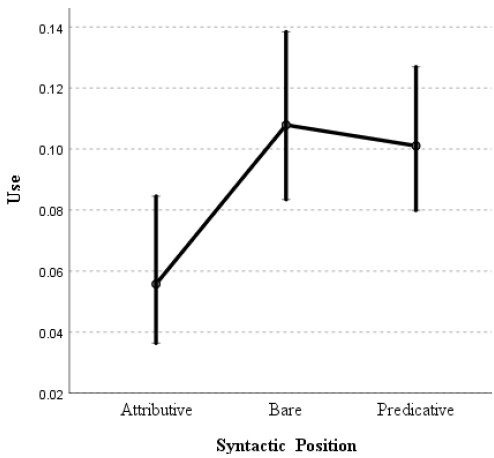
A final regression was run on the use of geil (see table 7). Age and position were found to be significant factors. As the distributional analysis suggested, speakers in the 35–44 cohort used geil more frequently than any other age group. Moreover, given that geil was not used by speakers aged 60 and above, age was a significant factor for speakers of all ages. Although, descriptively speaking, geil was used more frequently by men than women, the difference was not identified as statistically significant. However, position was a significant factor, with attributive use least frequent and stand-alone use most frequent (see figure 7).
Logistic regression analysis of geil.

Random Effect (Speaker n=385, SD=17.7)
Estimated marginal means for the use of geil by position.

5. Discussion
The present study set out to examine the factors that influence German adjective choices. The distributional analysis indicated that while 28 adjectives of positive evaluation were identified in the corpus, the semantic field was occupied by predominantly three frequently used variants: cool, toll, and intensifier + gut. These three variants are interesting in and of themselves, but their crosslinguistic correspondence is intriguing given that they mirror the findings observed in Toronto English. In their study on English adjectives of positive evaluation, Tagliamonte & Pabst (2020:15) make the following observation:
[…] a single semantic field is populated by at most three primary (i.e., very frequent) forms. In the case of adjectives of highly positive evaluation in particular, one form is a periphrastic construction comprised of an intensifying adverb plus one of the most common adjectives in the language for positive affect, good.
Not only was the equivalent of the intensifier + gut construction one of the top three variants in Toronto English, but cool was also the most frequently used variant in the German data. Despite the semantic field being dominated by only three variants, the system of positive evaluation adjectives consisted of 28 variants, which is an example of “layering”, that is, the coexistence of the old and the new (Hopper Reference Hopper, By Elizabeth and Heine1991:22–31).Footnote 17 While it is not clear exactly when cool was borrowed into German, it was likely borrowed from American English, perhaps through Anglophone music, entertainment, or through popular culture.
In comparing the present findings with findings in previous research, it becomes clear that a change in the system of positive evaluation adjectives has taken place. In the 1970s, Schenker (Reference Schenker1977) reported that astrein, klasse, and dufte were the most popular variants. However, according to the present dataset, four to five decades later these variants have virtually vanished from the system. The adjective astrein was only ever used by older speakers, klasse was used almost exclusively by older speakers, and dufte was not used at all. The fact that the dwindling use of astrein and klasse was only found in the speech of older speakers indicates that the variants used in the 1970s did not cross over to the next generation; that is, their use remains generational. In the 1990s, Androutsopoulos (Reference Androutsopoulos1998) reported that geil was the most frequently used variant among younger speakers, followed by genial ‘great’, kultig ‘cool’, korrekt ‘great’, and cool ‘cool’. According to the present dataset, with the exception of geil and cool, the other variants are no longer favored. The adjectives kultig and korrekt did not appear in the corpus, and while genial was used, it occupied less than 1 percent of the system of positive evaluation adjectives. Other adjectives that were once used, such as knorke and töfte ‘great’, were also not attested, which in addition to the other findings, shows that the system of positive evaluation adjectives is a dynamic and perpetually changing one, with time in the limelight and increased popularity sometimes being ephemeral.
The multivariate analysis found that linguistic and social constraints condition German adjective variation. For instance, the use of the adjective cool was heavily influenced by the age and gender of the speaker. A monotonic increase was observed across generations, with cool favored by younger rather than older cohorts, which is indicative of a change in progress. The fact that cool was used most frequently by younger speakers is also in line with the observation that younger as opposed to older speakers are at the forefront of linguistic change (Androutsopoulos Reference Androutsopoulos1998, Labov Reference Labov2001, Tagliamonte Reference Tagliamonte2016a). In addition to being used most frequently by young speakers, cool was also used most frequently by women, suggesting that it is young women leading this change. This finding is therefore in line with the observation that linguistic change is often led by women (Labov Reference Labov2001:274–275). In contrast, as the distributional analysis suggested, men favored the prototypical intensifier + gut over any other variant.
Moreover, the fact that intensifier + gut was used most frequently by older generations is also consistent with the observation that younger speakers lead in linguistic change. After all, the intensifier + gut construction has been around for quite some time (Stratton Reference Stratton2021).Footnote 18
Bearing age differences in mind, it is also possible to make a prediction about the future fate of toll. Although it was the second most frequently used variant, it was used predominantly by older speakers. According to the assumptions of the apparent time construct, disfavored use among younger speakers would suggest that the variant may soon lower in frequency.
In addition to finding age and gender to be significant conditioning factors, German adjectives were also constrained by the syntactic position. The adjective toll appeared in different syntactic positions depending on the age of the speaker. Toll was favored in attributive position by older speakers but was favored as a stand-alone adjective by younger speakers. In contrast, geil, which was not used by speakers aged 60 or above, was favored in stand-alone and predicative position as opposed to attributive position. According to the developmental pathway suggested by Tagliamonte & Pabst (2020), the disfavoring of attributive use suggests that geil is still in the incipient developmental stages as an adjective of positive evaluation. Put differently, geil may stick around as a popular variant for quite some time. Another interesting finding with respect to geil was that it was favored most frequently by speakers aged 35–44. While using geil to denote positive evaluation may have originally been considered “Jugendsprache” [youth language] (Androutsopoulos Reference Androutsopoulos1998), the young speakers who likely introduced this innovation have aged. In other words, the use of this adjective is not subject to “age-grading” (Labov Reference Labov1994:84), a process whereby features peak during adolescence “when peer group pressure not to conform to society’s norms is greatest” and then decrease in their “middle-years” (Holmes Reference Holmes1992:184). Not being affected by age-grading likely explains why geil is still frequently used, whereas dufte and knorke are not. However, real-time data would be required to confirm this.
While register was not included in the multivariate analysis, distributional evidence suggests that some adjectives, such as cool and geil, are favored in more informal interactions, whereas other adjectives, such as wunderbar, are favored in more formal interactions. Moreover, although regressions were not run on krass ‘cool’ due to the fact that it made up only 8% of the data, the distributional evidence indicates that women favor krass more than men (see figure 2).Footnote 19 The distributional evidence in figure 2 also suggests that krass is used more frequently by younger speakers than by older speakers, suggesting that, like geil, krass is likely to remain within this system for quite some time.
In contrast, the apparent time trajectory of prima suggests that prima is decreasing in frequency. Unless it is picked up by younger speakers, it is likely to become an infrequent variant in the near future. As for the incoming variants reported by Vogt et al. (Reference Vogt, Dorvel and Galloway2016), these were yet to be attested in the data. In general, as Tagliamonte & Pabst (2020:23) point out, “when new adjectives enter a semantic field, it may take some time before they successfully encroach on a large share of the system, if they ever do so.” The variant nice, which is currently used by adolescent speakers and young adults, only made up a miniscule share of the German system. Therefore, the success of newer variants of positive evaluation warrants future research using real-time data.
6. Conclusion
Since the advent of Labovian sociolinguistics (Labov Reference Labov1963, 1966), quantitative studies have identified underlying systematicity in various linguistic domains. However, despite the plethora of research on English, there is a dearth of variationist sociolinguistic scholarship on German. The present study used variationist quantitative methods to examine a previously understudied domain of linguistic variability, namely, German adjective variation. While there is an established correlation between geographical space and lexical variation, this study shows how lexical variation can also correlate with social space, with adjective use indexing social meaning. A close examination of adjectives of positive evaluation revealed a dynamic, socially and linguistically constrained system. Depending on the gender and age of the speaker, different adjectives were favored: Younger speakers preferred adjectives such as cool and geil, whereas older speakers preferred adjectives such as toll and intensifier + gut. Comparisons across apparent time, as well as with previous research, show that this field is a perpetually changing one, with variants coming in and out of fashion longitudinally, indicating that this semantic field is a vibrant locus of variation. There was also some empirical support for the principle that women generally lead in linguistic change (Labov Reference Labov2001:274–275), with the change toward using cool spearheaded by women.
While homing in on positive evaluation adjectives only touches the tip of the iceberg with respect to German adjective variation, the use of a semantic field as a means to study lexical variation opens a gateway for future researchers to study onomasiological sets. More broadly speaking, in line with ongoing variationist work, the present study shows how German variation can often be explained through factors other than geography and style. While geography has undoubtedly played an important role in German dialectology, by using a variationist framework the present study hopes to have provided some support for the notion that other external factors such as gender and age can also condition German variation. That is not to say that the role of geography and register should be downplayed, but rather additional factors of variation need to be included in the analysis to gain a composite picture of the variation at hand.
Moving forward, a number of intriguing research questions remain. More locally on the topic of adjective variation, whether other semantic domains are also influenced by social or linguistic factors remains to be studied. Some of the domains that can be studied include, but are not limited to, adjectives of negative evaluation, adjectives of attraction, and adjectives of strangeness. Whether similar tendencies can be observed in other varieties of German, such as Swiss German or Austrian German, is a question open for future research. Furthermore, while some predictions about the fate of positive evaluation adjectives were made, only a future analysis will ultimately be able to robustly determine which adjectives remained in the system or not. More broadly speaking, how internal and external factors condition other variable domains of grammar and lexis in the German language are future topics to be explored. The present study hopes to inspire future variationist work to tackle these questions within the field of German variation and change.