Introduction
To ensure the sustainability of the livestock industry, the importance of precision dairy farming, which continuously monitors and manages individual animal productivity and health problems, has increased to replace the traditional large-scale herd management (Bewley, Reference Bewley2010). However, individual observation of a herd by humans or video recording is labour-intensive, and it is difficult to make consistent judgments about animal conditions, which is practically impossible on large farms. For this reason, wireless biosensor systems have been introduced into the livestock industry and have been actively studied over the past decades (Rutten et al., Reference Rutten, Velthuis, Steeneveld and Hogeveen2013). The wireless biosensor system can be mounted on a part of the cattle body to measure and collect biometrics. Biosensor systems are categorized into eight types depending on the location where they are mounted: ear, halter, neck collar, rumen bolus, leg tag, tail, tail root and vaginal insertion type (Caja et al., Reference Caja, Castro-Costa and Knight2016). Most wireless biosensors are used to diagnose the oestrus cycle (e.g., heat), calving and disease based on activity measured by an accelerometer (especially a three-axis accelerometer). Accelerometer-based sensors measure the acceleration value according to the animal movement and convert the measured values into physiological and behavioural variables, such as feeding time, rumination time and motion activity level, using a built-in internal algorithm (Lee and Seo, Reference Lee and Seo2021). Then, the physiological and behavioural variables are comprehensively combined using an algorithm to generate diagnostic information for individual animals.
Although most biosensors measure animal activity based on measurements using an accelerometer, the reported activity differs greatly among biosensors. Commercialized wireless biosensor systems have different algorithms for processing raw data to produce physiological and behavioural variables and subsequent diagnostic information (Lee and Seo, Reference Lee and Seo2021). For example, even when measuring the same motion activity (e.g., eating, resting, walking and being highly active), the measurement interval, duration and representation (e.g., interpretation and unit) vary by manufacturer (Lee and Seo, Reference Lee and Seo2021). This can cause problems in the development of a precision dairy farming system that integrates multiple biosensor systems (Cabrera and Fadul-Pacheco, Reference Cabrera and Fadul-Pacheco2021). For example, suppose a model is constructed to predict an animal's physiological status based on milk production and activity measures using a specific activity biosensor. In this case, the model cannot directly use the activity measures obtained using a biosensor made by a different manufacturer, owing to the data inconsistency between the two biosensors. Thus, a model developed for a farm may not be reliably used for other farms. Therefore, there is a need for a method that can comprehensively interpret outputs from different sensor measurements by solving the aforementioned inconsistency problem of wireless biosensor systems.
In this regard, statistical methodologies can help standardize and integrate the values obtained from multiple sensor systems. The statistical method is widely used to analyse various data derived from the livestock field, demonstrating its ability to develop a quantitative model for estimating a specific value from different measurements (Lee et al., Reference Lee, Lee, Cho, Wakholi, Seo, Cho, Kang and Lee2020). A probability function is a statistical approach that calculates the relative likelihood of a random variable (Jónsson et al., Reference Jónsson, Blanke, Poulsen, Caponetti and Højsgaard2011; Kalkowska et al., Reference Kalkowska, Boender, Smit, Baliatsas, Yzermans, Heederik and Hagenaars2018). It converts different types of data into probabilities (i.e., 0 to 1) according to the frequency of appearance and enables integrated data analysis through the probability that a particular value can be observed, suggesting that it can be used to standardize different data to probability values. Therefore, the objective of this study was to develop a method to standardize the activity levels generated by various sensors mounted on an animal using statistical approaches.
Materials and methods
Experimental animals
Data were collected from October 2020 to February 2021 from a research farm at Chungnam National University in Chungcheongnam-do, Republic of Korea. All animal use and experimental procedures were approved by the Committee on the Ethics of Animal Experiments of Chungnam National University (Approval Number:202009A-CNU-121) in 2020.
A total of 12 Holstein dairy cows (one drying and 11 lactating; average parity: 2.5 ± 1.24) were used in this study. All cows were milked twice daily at 0800 and 1600 using a tandem milking parlour system equipped with an electronic milk meter and an individual identification system. They were housed in a compost-bedded pack barn (sawdust) and fed timothy hay and a commercial concentrate mix.
Data acquisition and processing
All the cows were equipped with four wireless biosensors for data collection. A biosensor was mounted on the ear (CowManager, Agis Automatisering BV, Netherlands), two on the neck (cSense Flex tag, SCR Engineers Ltd., Israel; Activity Meter System, DeLaval International AB, Sweden), and one on the reticulo-rumen (smaXtec Classic Bolus, smaXtec Animal Care GmbH, Austria). All biosensors use an accelerometer to measure motion; however, each has different settings to obtain and interpret the activity data, including the measurement duration, frequency and unit by the manufacturers (Table 1). The data collected from the biosensors were 30 012, 28 668, 13 696 and 177 672 from CowManager, Activity Meter System (DeLaval), cSense Flex tag (SCR) and smaXtec Classic Bolus (smaXtec), respectively. Of these, only the data at the time point when all four sensors reported an activity datum (2-h interval) were extracted. Consequently, 12 862 data points from each sensor were used for the further analysis.
Information of the wireless activity biosensors used in this study

Statistical analysis of sensor data
Basic statistics such as average, standard deviation and range were initially investigated. For each sensor, average values corresponding to the time of day (a 24-h cycle) in a 2-h interval were calculated to assess the daily variation patterns of the measurements from the four sensors. The diurnal patterns were also tested using the timely averages of standardized values – the z-normalized value based on the average and standard deviation of the reported activity values – for each sensor. A similar diurnal pattern in the activity measured by the biosensors was visually confirmed, and the correlation between the sensor values was investigated.
Distribution analysis of sensor data by using a probability function
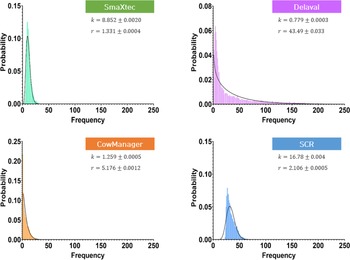
The frequency of the measured values from each sensor was counted to investigate the distribution of sensor values and to derive a standard method for evaluating cow activity with different biosensors. The biosensors showed a similar distribution pattern, with a skewed centre to the left and a long tail to the right, from an exponential-like distribution (CowManager) to a normal-like distribution (smaXtec). Therefore, the gamma distribution was selected that can accommodate these distribution shapes by adjusting the shape (k) and scale (r) parameters for fitting all the sensor distributions, modifying it to not define at zero sensor value (Equation 1; Stacy, Reference Stacy1962):

where f is the probability value from the gamma distribution, x the sensor value, k the shape parameter, r the scale parameter and Γ the gamma function.
Maximum likelihood estimation was used to estimate the gamma distribution parameters for each sensor's activity values by determining the values that showed the best fitting result. Cross-validation was employed to evaluate the robustness of the parameter estimates of the gamma distribution for each sensor's activity data.
As the gamma distribution is a probability density function, it is possible to convert an activity value into a standardized value between 0 and 1 by calculating the cumulative probability of the activity value for each biosensor. Additionally, for each sensor, the standardized activity values (i.e., the calculated cumulative probabilities) were classified into three activity levels (i.e., idle, normal and active). In this study, the terms ‘idle’ and ‘active’ represent low and high activity levels respectively, while ‘normal’ means a moderate activity level that is not categorized as low or high by the threshold.
A two-sided threshold was used to define the levels. For example, with a 0.05 threshold, the standardized activity values that were smaller than 0.05, greater than 0.95 (1–0.05) and between 0.05 and 0.95 were defined as idle, active and normal, respectively. Various thresholds were tested to assess consistency in defining the activity level of a cow at a specific time point among the four wireless biosensors.
Probability calculation for sensor values alerting heat
To test the potential utility of the developed probability-based sensor measurements, the sensor values with heat alerts were gathered for each biosensor. The sensor values were converted to the corresponding cumulative probability based on the probability density function of each biosensor. The number of heat alerts for each sensor was counted, and the average cumulative probability of heat alerts was calculated. In addition, the threshold value of probability for assigning a sensor value to the active level above the threshold was varied to examine the number of detected heat alerts through probability conversion. For example, 32 heat alerts were recorded by the smaXtec with an average probability of 0.89, and 26 out of 32 could be classified into the active level with a threshold value of 0.8.
Statistical software
All statistical analyses were performed using R (version 4.1.0) (R core Team, 2021) and GraphPad (version 9.2.0; GraphPad Software, CA, USA). Specifically, correlation analysis and descriptive statistics were performed by using GraphPad. ‘fitdist’ package in R was used to fit sensor datasets, and to estimate parameter values of the gamma distribution. A continuous probability distribution graph was then created based on the acquired parameters and equations. To cross-validate the developed algorithms with estimated parameters, we partitioned the entire dataset into ten folds using the ‘subset’ function in R; then, the algorithms developed with nine folds were repeatedly validated with a fold that was not used for estimating parameters.
Results
Statistical analysis of sensor data
Because of the difference in the internal algorithm coded for each sensor (which was unknown owing to company policy), the measured activity values showed differences in the mean, standard deviation, maximum and minimum values for each sensor, and the range of values also differed (Table 2). However, the diurnal pattern of the reported activity data showed high similarity among the sensors (Fig. 1). For example, the lowest activity value appeared at 6 am, whereas the highest activity occurred at 10 am and 6 pm, 2 h after milking, and this was consistently observed throughout the data collection days. This result suggests a correlation of measurement data among sensors, and a standard way to interpret different sensor values could be developed. This inference was confirmed by correlation analysis, showing Pearson correlation coefficients of 0.41–0.67 for the averages of the reported activity values and 0.44–0.71 for the averages of the standardized activity values among the sensor datasets (P < 0.05; Figure 2). In general, the SCR data showed higher correlations with the other sensors, with the highest value of 0.71 with smaXtec for the averages of the standardized activity values, whereas CowManager showed relatively lower correlations.
Descriptive statistics of the activity data (unitless/2 h) obtained from the tested wireless activity biosensors

1 SD, standard deviation.
2 smaXtec, smaXtec Classic Bolus (smaXtec animal care GmbH, Austria); DeLaval, Activity Meter System (DeLaval International AB, Sweden); CowManager, CowManager (Agis Automatisering BV, Netherlands); and SCR, cSense Flex tag (SCR Engineers Ltd., Israel).
Diurnal pattern (2-h interval) of the activity data by the wireless biosensors over five months (a) average of the reported activity values and (b) average of the z-normalized activity values for each sensor. Symbols are as follows: filled circle (smaXtec Classic Bolus, smaXtec animal care GmbH, Austria), filled square (CowManager, Agis Automatisering BV, Netherlands), filled triangle (Activity Meter System, DeLaval International AB, Sweden) and filled reverse triangle (cSense Flex tag, SCR Engineers Ltd., Israel).

Pearson correlation coefficients of the activity data between the wireless biosensors (a) average of the reported activity values and (b) average of the z-normalized activity values for each sensor. smaXtec: smaXtec Classic Bolus (smaXtec animal care GmbH, Austria), DeLaval: Activity Meter System (DeLaval International AB, Sweden), CowManager: CowManager (Agis Automatisering BV, Netherlands) and SCR: cSense Flex tag (SCR Engineers Ltd., Israel).

Development of standard analysis for activity sensors by using probability density function
The frequency of the measured values from each sensor was modelled by a gamma distribution, resulting in the best fit for each sensor with different parameter values (Fig. 3). The cross-validation verified the robustness of the estimated parameter values, which showed little variation in each parameter estimation trial (data not shown). Consequently, it was shown that the developed model could convert the activity measurement into the probability of frequency, and different sensor values could be assigned as comparable values (e.g., one of the three activity levels) through the probability.
Frequency distribution of the activity data of the wireless biosensors. The best-fit gamma distribution function for each data is presented with an equation and a line. smaXtec: smaXtec Classic Bolus (smaXtec animal care GmbH, Austria), DeLaval: Activity Meter System (DeLaval International AB, Sweden), CowManager: CowManager (Agis Automatisering BV, Netherlands) and SCR: cSense Flex tag (SCR Engineers Ltd., Israel). Estimated parameter values and their error (SE) for each parameter in the form of value ± SE were provided.

As the threshold for defining the activity level increased, the consistency among the four wireless biosensors in the amount of activity data belonging to each activity level increased (Table 3). With the threshold of 0.05 (idle < 0.05, 0.05 ⩽ normal < 0.95 and 0.95 ⩽ active), only smaXtec had values assigned to the idle level; however, all sensors showed the same number of data corresponding to 6.7% of the total data at the active level, suggesting the potential for probability-based conversion of sensor values for extremely high activity levels. As the threshold value increased, the number of sensor values assigned to each level became similar, reaching approximately 36%, 40% and 24% for idle, normal and active levels, respectively, at the threshold of 0.3 (idle < 0.3, 0.3 ⩽ normal < 0.7 and 0.7 ⩽ active). At the active level, the rate of change of the amount of data allocated according to the change in the threshold value ( + 0.05) was almost constant at less than 4%, but the proportion of the idle level changed rapidly owing to the shape of the distribution model, which skewed to the left. CowManager exhibited the largest variation in the thresholds. This suggests that the probability-based model is robustly interconvertible, at least for detecting the high activity of cows, whereas the optimal threshold at which the idle and normal levels that can be commonly detected by sensors need to be determined. To determine the optimal threshold, the ratio of commonly assigned data numbers for SCR to each sensor was tested by classifying the probability into three levels. A similar amount of data for each sensor was generally assigned to each level through probability conversion of sensor measurements, while the largest discrepancy was observed at the threshold value of 0.1–0.9 due to a drastic change in the amount of data in CowManager. For the active level, regardless of thresholds, more than 90% of sensor values were matched except smaXtec at the 0.3–0.7 threshold, suggesting that active level detection would be possible through probability conversion. For the idle level, threshold values lower than 0.15 and larger than 0.85 showed a consistently reliable matching accuracy of approximately 75% at least. Comprehensively, high activity could be detected with less than 0.1% error regardless of sensor type at the upper threshold value higher than 0.9, while idle activity could be inter-convertibly detected with moderate accuracy greater than 75% when applying the optimal lower threshold between 0.2 and 0.3. Therefore, sensor interconversion to detect physiological status might be possible by calculating the probability of sensor values with an optimal threshold.
Number of activity data generated by the wireless biosensors classified into idle, normal and active levels by threshold probability1,2

1S, smaXtec Classic Bolus (smaXtec animal care GmbH, Austria); D, Activity Meter System (DeLaval International AB, Sweden); C, CowManager (Agis Automatisering BV, Netherlands); and SC, cSense Flex tag (SCR Engineers Ltd., Israel).
2Percentage is calculated by the ratio of the classified sensor values at each level to the total number of sensor data (12 862 for each sensor).
Probability calculation for sensor values alerting heat
During the entire data collection period, 159 heating alerts were reported by all four sensors. DeLaval produced the largest number of heat alerts (79), while the number of heat alerts was similar among the other three sensors (Table 4). The time when the heat was detected, however, was inconsistent among the sensors, suggesting high variation among sensors in the values and methods of detecting heat in a cow. The average standardized sensor values (probability) when the heat alerts were alerted were 0.90, 0.87, 0.68 and 0.89 smaXtec, and respectively (Table 4). The upper threshold value (0.75) for defining the active level could capture more than 87% of the heat alerts from smaXtec, CowManager and SCR, whereas only 62% of the heat alerts generated by DeLaval belonged to the active level even with an upper threshold of 0.7. This suggests a high variation in the DeLaval sensor values for heat detection, but the other three sensors were relatively similar and robust.
Detection probability of the model for heat alerts generated by wireless biosensors

1 smaXtec, smaXtec Classic Bolus (smaXtec animal care GmbH, Austria); DeLaval, Activity Meter System (DeLaval International AB, Sweden); CowManager, CowManager (Agis Automatisering BV, Netherlands); and SCR, cSense Flex tag (SCR Engineers Ltd., Israel).
Discussion
Among the physiological and behavioural variables generated by wireless sensors, the activity level quantifies the degree of movement of an animal, and it is a variable commonly generated by most wireless sensors. The activity level reported by a sensor has been used by farm managers as a major indicator for judging physiological changes in cows caused by oestrus, calving and disease. The quantified activity levels have also been used as important input data for models detecting oestrus, calving (Løvendahl and Chagunda, Reference Løvendahl and Chagunda2010; Borchers et al., Reference Borchers, Chang, Proudfoot, Wadsworth, Stone and Bewley2017) and disease (Thorup et al., Reference Thorup, Munksgaard, Robert, Erhard, Thomsen and Friggens2015; Stangaferro et al., Reference Stangaferro, Wijma, Caixeta, Al-Abri and Giordano2016a, Reference Stangaferro, Wijma, Caixeta, Al-Abri and Giordano2016b). Various wireless activity sensors are available in the market, and an individual cow usually wears only one activity sensor. Because the values provided by each sensor are different, it is necessary to develop a model capable of the one-to-one conversion of wireless activity sensors. This study attempts to develop a method that can comprehensively interpret the output of different cattle activity sensors using a statistical approach.
Similar daily cycle patterns among the sensor measurements suggested the consistency and robustness of the sensors tested in this study in measuring a cow's activity, even though the internal algorithms were different. In addition, significant correlations among sensor outputs, which ranged from 0.4 to 0.7 with a P-value <0.05, indicated that the activity values of each sensor could be interconvertible. This observation suggests the possibility of developing a model that allows mutual changes between sensors. We actually attempted to develop a linear model that converts the activity values of the other sensors to those in SCR; however, variations among sensor values were too large for individual cows, limiting the application of a quantitative model to interconvert sensor measurements. In particular, the large sum of squares of the discrepancy between measurement and prediction for high sensor values compared to low sensor values suggests that the regression model becomes a low-value-oriented model because the sensor outputs are predominantly dense with small values. Thus, in the case of livestock and dairy applications, where accurate detection of idling (e.g., disease) and high activity (e.g., heat) is critical, the use of this type of model will be limited (Mottram, Reference Mottram2016). For this reason, we concluded that the regression-based quantitative approach that generally targets the population rather than individuals might not provide a reliable output that is practically required to manage individual cows (Lee et al., Reference Lee, Mccabe, Martin and Weaver2011). Consequently, a methodology to establish a gold standard for different sensors would be more practical.
To develop the qualitative model, a probability function was employed to calculate the probability of a specific value for each sensor. A gamma distribution was used because of its flexibility to fit the frequency distributions whose shapes differed by sensors. The gamma distribution function has been previously used to examine biosensor signals (Carreiro et al., Reference Carreiro, Wittbold, Indic, Fang, Zhang and Boyer2016) and to characterize large-volume records of dairy cows (Buenger et al., Reference Buenger, Ducrocq and Swalve2001). The estimated parameter values for each sensor were almost constant without large variations in cross-validation, which indicates the robustness of the developed probability model using the gamma function. As shown in the daily cycle, the duration of a cow's high activity is relatively short compared to normal and idle activity; thus, the frequency of occurrence of high sensor values may be low (Shahriar et al., Reference Shahriar, Smith, Rahman, Freeman, Hills, Rawnsley, Henry and Bishop-Hurley2016; Wang et al., Reference Wang, Zhang, Bell and Liu2022). In other words, since high activity is observed in a special case, the variation of sensor measurement might be less with active activity compared to normal or low activity, which includes various movements of the part where the sensor is attached (neck, ear, rumen, etc.). Therefore, for high activity, it may be feasible to derive a standard sensor metric represented by frequency probability with a high upper threshold. This was shown by the constant number of sensor values classified as active level, regardless of the threshold value or sensor type. In contrast, the number of sensor values classified as either idle or normal varied significantly by the threshold value. This suggests that it is more difficult to derive a common metric for different sensors for idle and normal activities, and the optimal threshold must be determined. This can be explained by the data distribution shape and characteristics of the gamma function. Owing to the small appearance of large sensor values fitted with a relatively long tail of the gamma function, the same classification for high activity among the sensor values was possible when a high threshold value was applied. However, because of the distribution of sensor values skewed to the left, the classification of low sensor values was greatly affected by the threshold value, but the number of sensor values classified as idle level became similar when a lower threshold above a certain level was applied. From this perspective, by converting the output to probability, it is expected that any type of sensor can be used to measure high cow activity, such as heat, which is most needed by livestock farmers (Shahriar et al., Reference Shahriar, Smith, Rahman, Freeman, Hills, Rawnsley, Henry and Bishop-Hurley2016; Wang et al., Reference Wang, Zhang, Bell and Liu2022).
The developed model was applied to convert the sensor values that alert heat into probabilities. As expected, the high-probability areas were assigned to the sensor values recording heat alerts, suggesting that alerts might be classified as active through probability function-based standardization. In particular, smaXtec, CowManager and SCR exhibited similar average probabilities for heat alerts, indicating that they are interconvertible. However, despite relatively low frequency of high sensor values and their less variation compared to low values, significant disparities in heat alerts existed among the sensors. For instance, due to differences in the internal detection algorithms of the sensors, there were no instances of three or more sensors recorded a heat alert simultaneously at the same time point. Moreover, even within a single sensor, there was substantial variations in the values associated with heat alerts. As a result, in order to derive the optimal detection performance for the four sensors, it was necessary to examine the detection ratio based on changes in the threshold value. Even though applying this method to new sensors may involve the limitation that requires a testing process to ensure its applicability, this process was essential to determine the optimal threshold value through which the best performance could be achieved. With varying upper threshold values, approximately 90% of heat alerts could be assigned to the active level, except for DeLaval, which showed that only 62% were detected with the largest variation. When a few abnormally low probabilities were removed, the average probability of the sensor values with the heat alerts increased to 77%. Nevertheless, the larger number of heat alerts, lower probability and higher variation compared with other sensors indicate a different detection algorithm for DeLaval. In addition, there is an apparent difference in the heat-detection alerts time between the sensors because of the time difference in generating a sensor value (Dolecheck et al., Reference Dolecheck, Silvia, Heersche, Chang, Ray, Stone, Wadsworth and Bewley2015; Borchers et al., Reference Borchers, Chang, Tsai, Wadsworth and Bewley2016). Another factor that causes detection discrepancy in time and probability may be the location of the mounted sensor, which subsequently influences the sensitivity of the sensor measurement (Lee and Seo, Reference Lee and Seo2021). Nevertheless, the approach using the probability function is effective because this method simply adjusts the discrepancy by calculating the probability that a specific sensor value appears.
In conclusion, we successfully developed a methodology that can standardize and comprehensively interpret different cow-activity sensor data by converting sensor measurements into the cumulative probability of their appearance. To the best of our knowledge, this study is the first to develop a methodology for the integration of activity data generated from various wireless sensors in cows. This methodology uses the appearance probability of sensor values for conversion and can standardize the activity values generated from different sensors more simply and effectively than other methods, such as regression or machine learning techniques. Moreover, this methodology is expected to be applicable not only to activity sensors but also to other sensors that measure the physiological characteristics (e.g., rumination time and eating time) of cattle. However, to derive the significance of the probability values, it is necessary to compare the probability values of a new sensor with the actual levels. In addition, since the reliability of parameter estimation for the gamma distribution used in the conversion to probability values can be compromised when data volume is insufficient, it is essential to gather a large amount of data to ensure robustness in the results. Therefore, further studies using new sensors and data are required to evaluate the applicability of the methodology.
Author's contributions
W. L. and S. S. conceived and designed the study. M. L. and H. C. conducted data gathering. W. L. and M. L. wrote the article. J. J. performed statistical analyses. D. L. conducted review and editing. S. S. conducted supervision the article.
Funding statement
This work was supported by Korea Institute of Planning and Evaluation for Technology in Food, Agriculture and Forestry (IPET) and Korea Smart Farm R&D Foundation (KosFarm) through Smart Farm Innovation Technology Development Program, funded by Ministry of Agriculture, Food and Rural Affairs (MAFRA) and Ministry of Science and ICT (MSIT), Rural Development Administration (RDA) (Project No. 421022-04).
Competing interests
None.
Ethical standards
All animal use and experimental procedures were approved by the Committee on the Ethics of Animal Experiments of Chungnam National University (Approval Number:202009A-CNU-121) in 2020.