Introduction
Lichens are usually associated with particular habitats such as tree canopies, trunks and rocks and with environments with high biomass such as the Southern Hemisphere broadleaf forests, the conifer forests of the western United States, alpine habitats and the boreal forests of northern America where the extensive ground cover by fruticose species is impressive (Kershaw Reference Kershaw1985). However, only in the past two decades have lichenologists started to show substantial interest in one of the major lichen-dominated communities in the world, the biological soil crust (biocrust) (Weber et al. Reference Weber, Büdel and Belnap2016). This community is widespread in arid and cold areas and is estimated to contain c. 550 species of lichens (Bowker et al. Reference Bowker, Belnap, Büdel, Sannier, Pietrasiak, Eldridge and Rivera-Aguilar2016). This paper is, perhaps, best considered as a selective mini-review giving a series of case studies in order to offer an introduction to this community with a summary of its main habitats, ecophysiology and versatility. Our aim is to place emphasis on the features that make biocrust lichens distinct from lichens in other habitats. In particular, we provide examples of aspects of their ecophysiology that extend commonly accepted assumptions about lichens. These include a high degree of plasticity shown by some lichens which appear mainly to be responses to the water regime. Examples include the development of structures to use soil water and modification of the response of net photosynthesis to thallus water content. Morphological responses also include changes in the hydrophilic nature of the thallus and photobiont switching. In addition, an unusual feature is the occurrence in alpine and temperate biocrusts of very long periods of activity, often stretching into months.
Data Sources
The information presented here comes mainly from published literature (sources are cited) and, in addition, some original data from the Soil Crust International Project, Biodiversa (SCIN), are presented. SCIN (full details in Büdel et al. Reference Büdel, Colesie, Green, Grube, Lázaro Suau, Loewen-Schneider, Maier, Peer, Pintado and Raggio2014) examined biocrust performance at four sites that spanned a wide range of habitats in Europe: Tabernas Desert (near Almeria, Spain, 36°58′N, 250 m a.s.l., P (mean annual precipitation)=220 mm, T (mean annual temperature)=19·0°C; semi-arid desert), Homburg Castle, (near Gössenheim, central Germany, 50°01′N, 295 m a.s.l., P=600 mm, T=9·2°C; temperate, grazed site), Öland, Sweden (57°32′N, 20 m a.s.l., P=500 mm, T=6·5°C; northern temperate grazed site) and Hochtor, Austria (47°05′N, 2600 m a.s.l., P=2000 mm, T=−3·0°C; alpine).
At each SCIN site, biocrusts were monitored for c. 2 years and a full meteorological record obtained. Monitoring of biocrust activity was carried out using chlorophyll fluorometers (MoniDA, Walz, Germany) that made measurements at selected time intervals (usually 30 min) and reported the data directly by satellite communication. Measurements by MoniDA systems are non-contact and use the saturation pulse methodology (Raggio et al. Reference Raggio, Green, Sancho, Pintado, Colesie, Weber and Büdel2017) to detect when photosystem II is active and a positive value for the yield of photosystem II (F v/F m) is reported. For monitoring purposes, when a positive yield is obtained the lichen is accepted as being metabolically active. Activity can be checked both during the day and at night although photosynthesis will occur only in daylight. The fluorometer concurrently records light level and sample temperature for each measurement so that the environmental conditions, when the lichens were active and inactive, can be determined. CO2-exchange performance of individual biocrust species was measured in the field and laboratory with a portable gas exchange fluorescence system (GFS-3000, Walz, Effeltrich) using standard methodologies (Raggio et al. Reference Raggio, Pintado, Vivas, Sancho, Büdel, Colesie, Weber, Schroeter, Lázaro and Green2014).
What are Biological Soil Crusts (Biocrusts)?
Biological soil crusts are a mixture of organisms, autotrophic and heterotrophic, that 1) live on top or within the soil surface creating a consistent layer and 2) bind soil particles due to their presence and activity (Belnap et al. Reference Belnap, Büdel and Lange2003). This is a function-based definition and biocrusts can form on any soil where higher plants are excluded, typically by low water availability but also by low temperatures (alpine and polar regions) and, in addition, where human activity reduces plant cover (Büdel et al. Reference Büdel, Colesie, Green, Grube, Lázaro Suau, Loewen-Schneider, Maier, Peer, Pintado and Raggio2014). Biocrusts can be composed of bacteria, fungi, cyanobacteria, algae, lichens (lichenized fungi) and bryophytes (mosses and liverworts), all of which (with the exception of bacteria and fungi) are photosynthetic. Although local conditions strongly affect the presence of the different organisms and their succession, in arid areas the typical successional stages are filamentous cyanobacteria, followed by smaller green algae and cyanobacteria, and finally, when the surface has stabilized, lichens and mosses (Belnap et al. Reference Belnap, Büdel and Lange2003).
Biocrusts are considered to be ecosystem pioneers and are the first to colonize the soil surface. It has long been known that, by forming a skin on the soil surface, biocrusts can markedly protect soils against erosion. The skin is created by binding soil particles by various means: extracellular polysaccharides from cyanobacteria and algae, fungal mycelia, rhizoids and stems of bryophytes, and rhizinae and rhizomorphs of lichens (Mazor et al. Reference Mazor, Kidron, Vonshak and Abeliovich1996; Belnap et al. Reference Belnap, Büdel and Lange2003). The presence of the organisms also contributes to resistance against erosion by wind and raindrops. Biocrusts influence water run-off and infiltration (Souza-Egipsy et al. Reference Souza-Egipsy, Ascaso and Sancho2002; Lázaro et al. Reference Lázaro, Cantón, Solé-Benet, Bevan, Alexander, Sancho and Puigdefábregas2007; Wang et al. Reference Wang, Li, Xiao, Berndtsson and Pan2007; Castillo-Monroy et al. Reference Castillo-Monroy, Maestre, Delgado-Baquerizo and Gallardo2010) and contribute fixed carbon (C) and nitrogen (N) (Belnap Reference Belnap2002; Elbert et al. Reference Elbert, Weber, Burrows, Steinkamp, Büdel, Andreae and Pöschl2012; Sancho et al. Reference Sancho, Belnap, Colesie, Raggio and Weber2016). Surface morphology changes can also influence seedling establishment (Li et al. Reference Li, Jia, Long and Zerbe2005).
Lichens, and all other organisms contributing to biocrusts, are physiologically poikilohydric, meaning that their water content tends to be in equilibrium with that of the environment (they are wet when the environment is wet and vice versa) and, typically, they can withstand periods of desiccation with recovery of activity when rewetted. This desiccation resistance is the underlying reason why biocrusts can colonize soil surfaces in arid regions.
The Biocrust Habitat
The soil surface has the potential to be a severe environment, possibly even the most severe environment, for lichens. Depending on location, one or more of the main environmental factors (light, temperature and water status) can reach extreme levels with the possibility of damage to unprotected lichens. The most similar habitat to the soil surface is probably an exposed rock surface but there is the major difference that soils are particulate with a much higher degree of porosity and lower stability.
Light
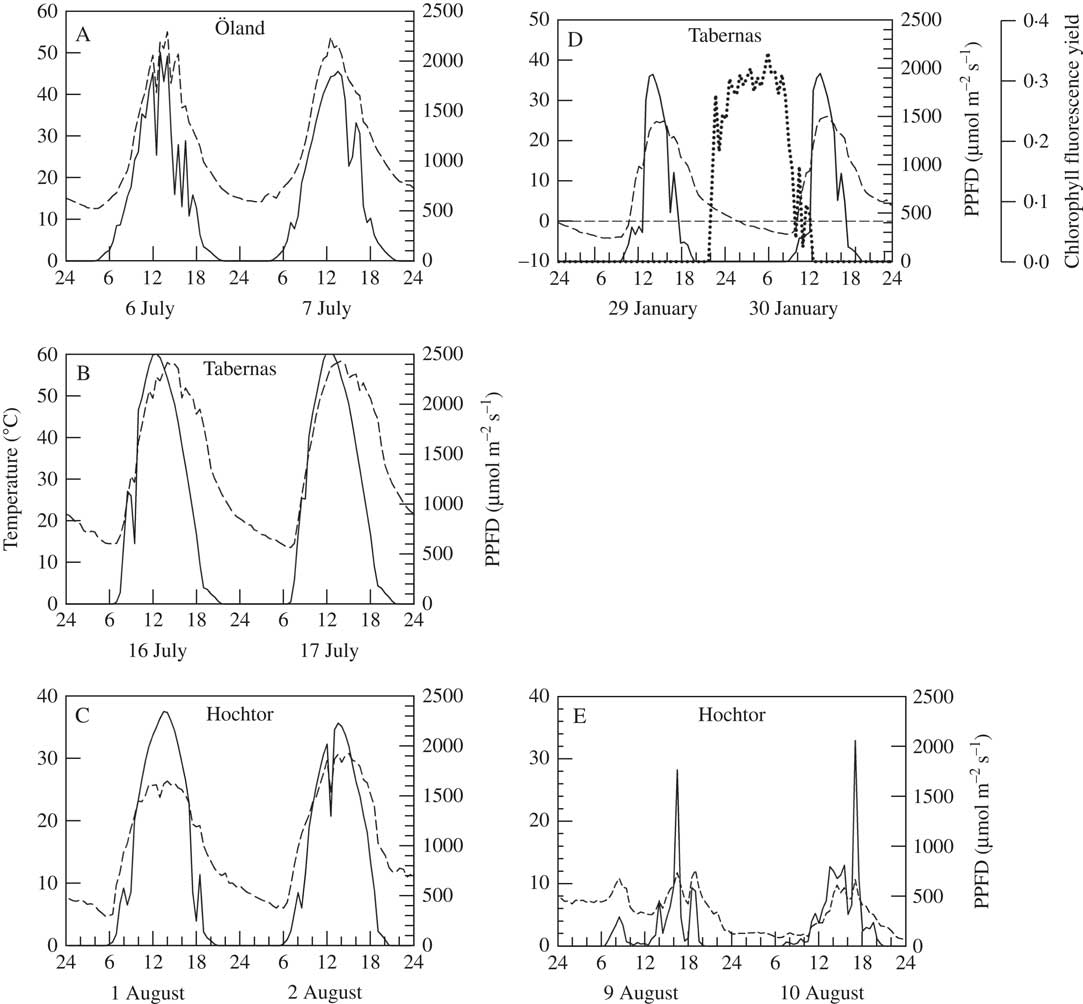
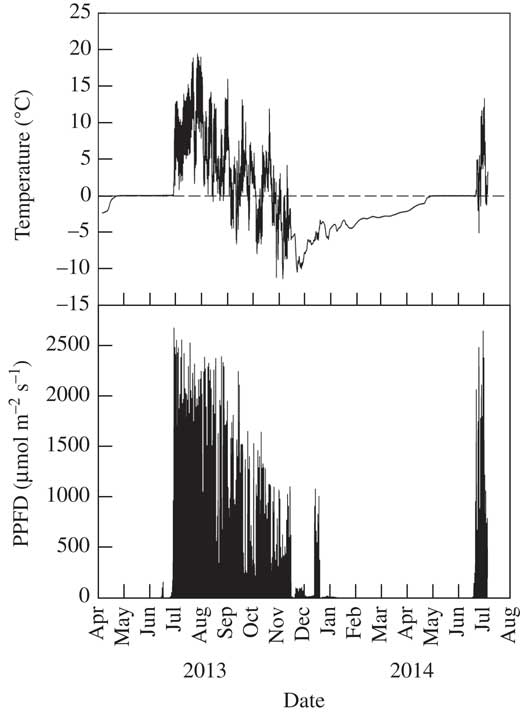
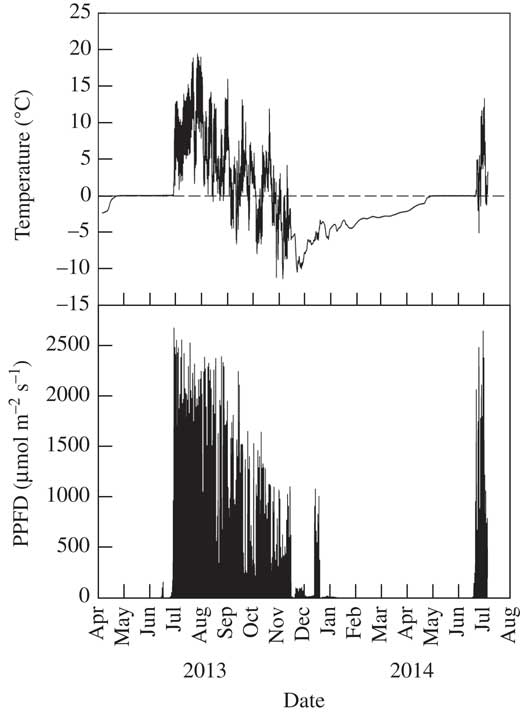
Biocrust communities form where higher plants are totally or partially excluded and the majority of the soil surface is fully exposed to incident radiation (shadier sites can occur under any higher plants that are present and are often occupied preferentially by mosses). Examples of light levels on two clear summer days at Öland, Tabernas and Hochtor, and two winter days at Tabernas, are given in Fig. 1A, B, C & D, respectively (data from SCIN project). On clear summer days, light (i.e. photosynthetic photon flux density, PPFD) levels reached 2100, 2500 and 2300 µmol photons m−2s−1 at Öland, Tabernas and Hochtor, respectively, and, even in winter, 1950 µmol photons m−2s−1 at Tabernas (Fig. 1D). Occasional spikes of 2000 µmol photons m−2s−1 were also reached on a wet, cloudy summer day at Hochtor (Fig. 1E). These are high values, as the normally accepted maximal incident photosynthetically active radiation is 2000 µmol photons m−2s−1, and most higher plant leaves photosaturate at c. 600–700 µmol photons m−2s−1 (Larcher Reference Larcher1995, Table 2.8). In complete contrast, snow cover in winter can lead to long periods of darkness. At Hochtor, the arrival of snow can be seen by the sharp decline in light to zero which lasts for six months (Fig. 2). Shorter periods of snow cover occur at Homburg and Öland that can last for weeks rather than months.
A–C, variation in temperature (dashed line) and light (photosynthetic photon flux density, solid line) over two days in summer (July) in Öland, Sweden (A), Tabernas, Spain (B) and Hochtor, Austria (C). D & E, temperature, light (as above) and chlorophyll fluorescence yield (F v/F m, dotted line) on two clear winter days at Tabernas (D), and wet summer days at Hochtor (E). Note the different scales of the temperature axes. Recordings made at 30 min intervals. Data from SCIN project (Büdel et al. Reference Büdel, Colesie, Green, Grube, Lázaro Suau, Loewen-Schneider, Maier, Peer, Pintado and Raggio2014).

Air temperature and incident light (PPFD) measured at 5 min intervals over a 15 month period at Hochtor (Austria) at 1 m above the biocrust. The sharp disappearance (December) and reappearance (July) of the light delineates snow cover of at least 1 m depth. Data from SCIN project (Büdel et al. Reference Büdel, Colesie, Green, Grube, Lázaro Suau, Loewen-Schneider, Maier, Peer, Pintado and Raggio2014).
Temperature
Daily changes in biocrust temperature are driven mainly by incident radiation moderated by the water content of the soil. The surface of dry soil has a low heat capacity and thermal conductivity and, therefore, heats up substantially more than wet soil which has a high heat capacity and thermal conductivity. Records from the SCIN project show that in Tabernas, a region known for clear skies, the high incident radiation can drive summer soil temperatures to c. 60°C (maximum recorded 64·8°C) with a daily range that can reach 45°C (Fig. 1B). Even at Öland, 20° latitude further north, biocrust temperature can reach 55°C with a daily range of 40°C (Fig. 1A). At 2500 m, the biocrust at Hochtor still reached 30°C with a daily range of 25°C (Fig. 1C). The potent effects of lower radiation (although with high spikes) and wet soil can be seen at Hochtor when biocrust temperature reached just 11°C with a small range of 10°C (Fig. 1E). Lichens are known to be able to withstand high temperatures, up to 90°C for 30 minutes, when dry and dormant (Lange Reference Lange1953). Again, the major contrast is when snow covers the sites. At Hochtor, the snow at first acts as an insulator and preserves the sub-zero temperatures but there is a slow warming over about four months followed by two months of stable temperature at 0°C, maintained by the freezing and thawing of water (Fig. 2). The same phenomena have been reported from Antarctica where cold temperatures under snow banks formed in winter prevent early activation of lichens and mosses (Pannewitz et al. 2003 Reference Pannewitz, Schlensog, Green, Sancho and Schroeterb ), and overnight freezing prevents temperatures of wet mosses falling below 0°C (Pannewitz et al. 2003 Reference Pannewitz, Green, Scheidegger, Schlensog and Schroetera ).
Water
All biocrust organisms including lichens are poikilohydric, meaning that they tend to be in equilibrium with the environmental water status. If it is dry then they will also dry out, and it is no surprise that all biocrust components are able to survive desiccation-enforced dormancy. The degree of drying of lichens in biocrusts can be extreme, as is seen at Tabernas, because as the soil surface temperature rises the saturation deficit (i.e the evaporating power) of the boundary layer air above also increases although the absolute amount of water vapour in the air might stay constant. At a biocrust temperature of 60°C the water potential of the lichens falls to c. −500 MPa, at which point water within the lichens is in the form of a glass (Walters et al. Reference Walters, Farrant, Pammenter and Berjak2002). To place this in perspective, the water potential of the drying agent CaCl2 is c. −160 MPa. Even at Öland, a much wetter location, water potentials can be <−400 MPa. Damage to cell constituents such as DNA and proteins can occur at water potentials >−100 MPa (Sun Reference Sun2002) so biocrust lichens must substantially invest in protective systems such as sugar alcohols (Green et al. Reference Green, Pintado and Sancho2011). In contrast, wet soils can hold considerable stores of water which are exploited by the roots of higher plants. Although little is known about the importance of soil water to lichens, there is no doubt that some lichens are linked to the soil by rhizinae which can transfer stored soil water to the thallus (Colesie et al. Reference Colesie, Green, Raggio and Büdel2016; see later sections). Soils can therefore provide an additional water source for the lichens and this is the major difference from similarly exposed habitats, such as rock surfaces, except where lichens are exploiting features such as cracks.
Metabolic Activation of Biocrusts
Water sources
Typically, the major sources of water for lichens are rain, dew, water vapour and fog, and examples of activation by dew and rain for the lichen Psora decipiens (Hedw.) Hoffm. at Tabernas are given in Fig. 3. Activation of the lichen by dew from the air, or possibly surface condensation of soil derived water vapour, is indicated by positive values for photosystem II yield which start just before midnight and end soon after midday (Fig. 3). Activation by rainfall coincides with the start of the rain event and continues for longer.
Metabolic activation (as chlorophyll fluorescence yield, F v/F m) of Psora decipiens in relation to temperature (dashed line), incident light (solid line, lowest panel) and rainfall (bars) during 5 days in March 2013 at Tabernas (Spain). Recordings made at 30 min intervals. Data from SCIN project (Büdel et al. Reference Büdel, Colesie, Green, Grube, Lázaro Suau, Loewen-Schneider, Maier, Peer, Pintado and Raggio2014).

The contribution of water from the soil is not yet fully understood. Psora decipiens and other biocrust lichens have extensively developed rhizinae and rhizomorphs which can transport water to the main thallus (Colesie et al. Reference Colesie, Green, Raggio and Büdel2016), and this topic is further developed in the section below (Versatility, Acclimation and Adaptation).
Active versus inactive conditions
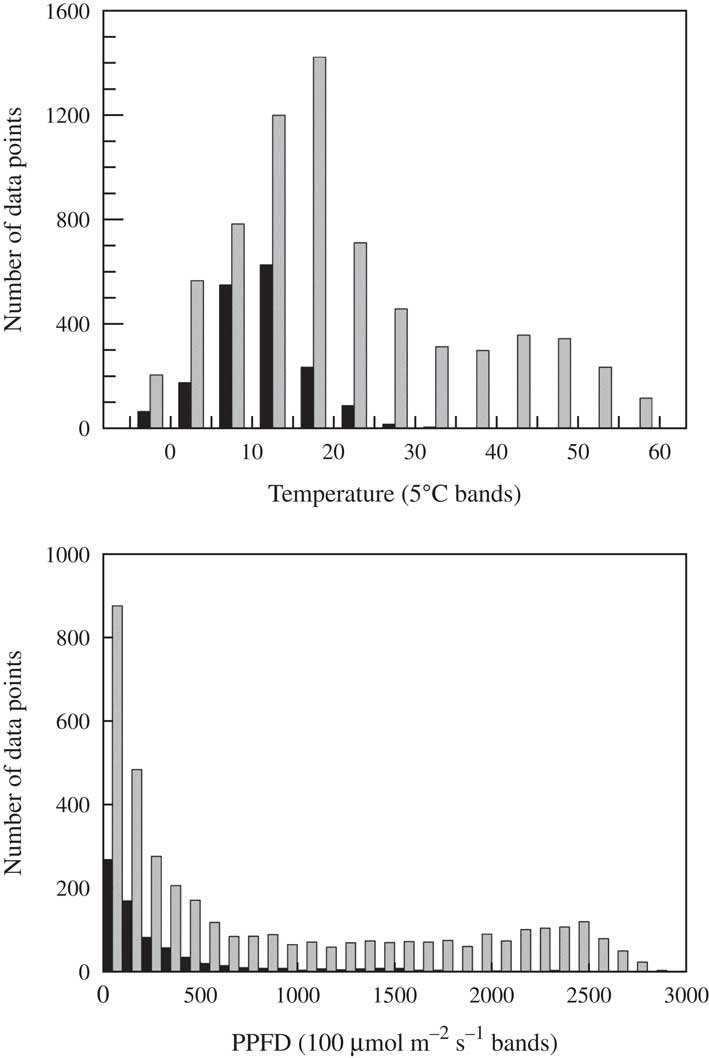
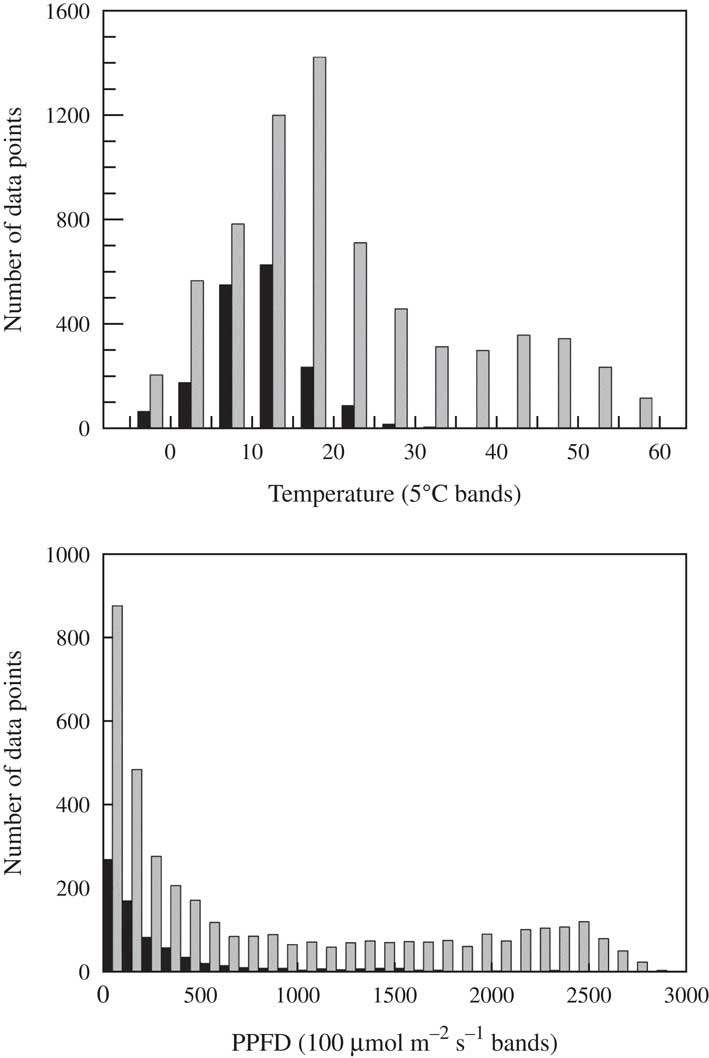
One of the features of lichens in soil crusts and other habitats is that the microclimatic conditions at the thallus level when they are active (positive yield value) can diverge markedly from the standard reported meteorological information (Schlensog et al. Reference Schlensog, Green and Schroeter2013). This behaviour has obvious significance when assessing adaptations and other responses to the habitat environment; the question is which particular features of the environment are important. The main driver of this divergence is the water availability because lichens dry out rapidly, and dry lichens are dormant and strongly resistant to environmental extremes. The mean duration of activity (% of total time active) differs between habitats and is estimated to range from 53·3% at a temperate site to c. 10% in deserts (Lange Reference Lange2001). Continual monitoring of the lichens with chlorophyll fluorometers makes it possible to determine when lichens are active and hydrated at any time during the day or night and, because environmental parameters are recorded at the same time as fluorescence, it is possible to see exactly what conditions occur when the lichens are active. A typical set of results for P. decipiens shows that, although extreme temperatures up to 60°C occur, activity is confined to lower temperatures; even in Tabernas with a mean annual temperature of 19°C, most activity occurs between 10–15°C and there is almost no activity above 25°C (Fig. 4). This is no great surprise as a required condition for the soil surface to become hot is that it is dry. A similar situation occurs for light: lichens are more commonly active below 100 µmol photons m−2s−1 and activity occurrence declines rapidly above 300 µmol photons m−2 s−1 (Fig. 4). However, on some occasions the lichens can be active at high light levels.
Effect of temperature and incident light on the metabolic activity of Psora decipiens at Tabernas (Spain) from 2013. Active=black bars; inactive=grey bars. Data extracted from recordings made at 30 min intervals from SCIN project (Büdel et al. Reference Büdel, Colesie, Green, Grube, Lázaro Suau, Loewen-Schneider, Maier, Peer, Pintado and Raggio2014).
Length of active and inactive periods
It has often been suggested that lichens can be negatively, and seriously, affected by periods of constant hydration as short as seven days (Farrar Reference Farrar1976) and that alternating periods of hydration and dryness are needed in order to maintain the symbiosis (Farrar & Smith Reference Farrar and Smith1976). Lichens in biocrusts appear to behave very differently and, over a monitoring period of two years, the longest continuously active (i.e. continuously hydrated) periods at the SCIN research sites were 33, 179 and 170 days at Tabernas, Homburg and Öland, respectively. Chlorophyll fluorescence values remained high and give little evidence of negative effects on the biocrusts. These extended periods occurred over winter. The longest inactive (dry) periods were 48, 20 and 7 days at the same sites. Hochtor represents an enigma due to difficulties in obtaining a record through the winter. In the summer, the longest dry period was 2 days and the longest active period was 87 days. However, it is reasonable to assume that the lichens remain hydrated when under snow (all mini-dataloggers failed over winter due to water damage), indicating a possible active period of almost a year. Survival under snow is known to be species specific (Sancho et al. Reference Sancho, Pintado, Navarro, Ramos, DePablo, Blanquer, Jose Raggio, Valladares and Green2017). It appears timely to reconsider the effects of continuous hydration on lichens which may be more strongly habitat determined than previously thought.
Versatility, Acclimation and Adaptation
Lichens and bryophytes, the main components of many biocrusts, are sometimes regarded as being relatively simple organisms and this view can be assigned to their physiological performance (Gehrke Reference Gehrke1999). Not unexpectedly, this is likely to be far from the truth and, more probably, is a reflection of our lack of knowledge. Lichens in biocrusts show a large range of adaptations and rapid responses to their environment. In some cases, this leads to similarities and in others there are indications of considerable niche separation. The following examples look at a broad range of adaptive responses, both between and within lichens in biocrusts.
Response of photosynthesis to light and temperature
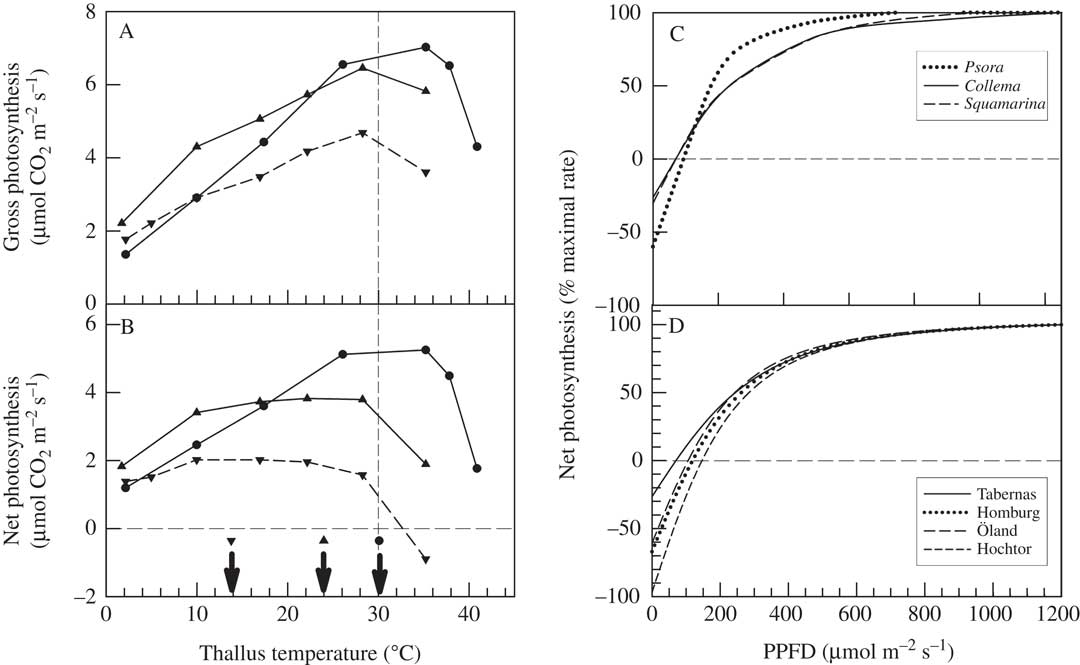
Biocrust lichens can show large differences in response of net photosynthetic rate to temperature, even within a single habitat. The best examples are from Moab, Utah for the green-algal Diploschistes diacapsis (Ach.) Lumbsch and Psora cerebriformis W. A. Weber, and the cyanobacterial Collema tenax (Sw.) Ach. (Lange et al. 1997, Reference Lange, Belnap and Reichenberger1998). Diploschistes diacapsis and P. cerebriformis show rather broad temperature optima for net photosynthesis, with a midpoint of c. 20°C, whilst C. tenax has a sharper optimum of c. 30°C (Fig. 5). It is likely that the different optima are driven by water relations, with the green-algal lichens benefitting from humidity and dew activation which gives low thallus water content so that they dry out quickly and at lower light and temperature. In contrast, C. tenax is hydrated by rain showers which produce a higher water content, extending activity duration and leading to the lichen being active at higher temperatures and light intensities. It should be noted that the response of gross photosynthesis (sum of net photosynthesis and dark respiration) to temperature is very similar for all three lichens, being linear up to c. 30°C. This response of gross photosynthesis seems to be typical for both lichens and mosses, and occurs even in Antarctic species (Pannewitz et al. Reference Pannewitz, Green, Maysek, Schlensog, Seppelt, Sancho and Schroeter2005), indicating that the underlying photosynthetic processes do not change (adapt) across widely different habitats. Net photosynthesis optima are, therefore, set by changes in dark respiration (Green Reference Green2017). Lichens have the capacity to fully acclimate their dark respiration to temperature (Lange & Green Reference Lange and Green2005).
A & B, effect of temperature on gross photosynthesis (A) and net photosynthesis (B) in three lichens at Moab, Utah, USA (from Lange et al. Reference Lange, Belnap, Reichenberger and Meyer1997, Reference Lange, Belnap and Reichenberger1998): Psora cerebriformis (▼ and dashed line), Diploschistes diacapsis (▲ and solid line) and Collema tenax (● and solid line). The arrows in B mark the approximate optimal temperatures. C, effect of incident light (PPFD) on net photosynthesis in three lichen species at Utah: P. cerebriformis (dotted line), C. tenax (solid line) and Squamarina lentigera (dashed line). D, effect of incident light (PPFD) on net photosynthesis in Psora decipiens at four SCIN sites: Tabernas (Spain) (solid line), Homburg (Germany) (dotted line), Öland (Sweden) (long dashed line) and Hochtor (Austria) (short dashed line).
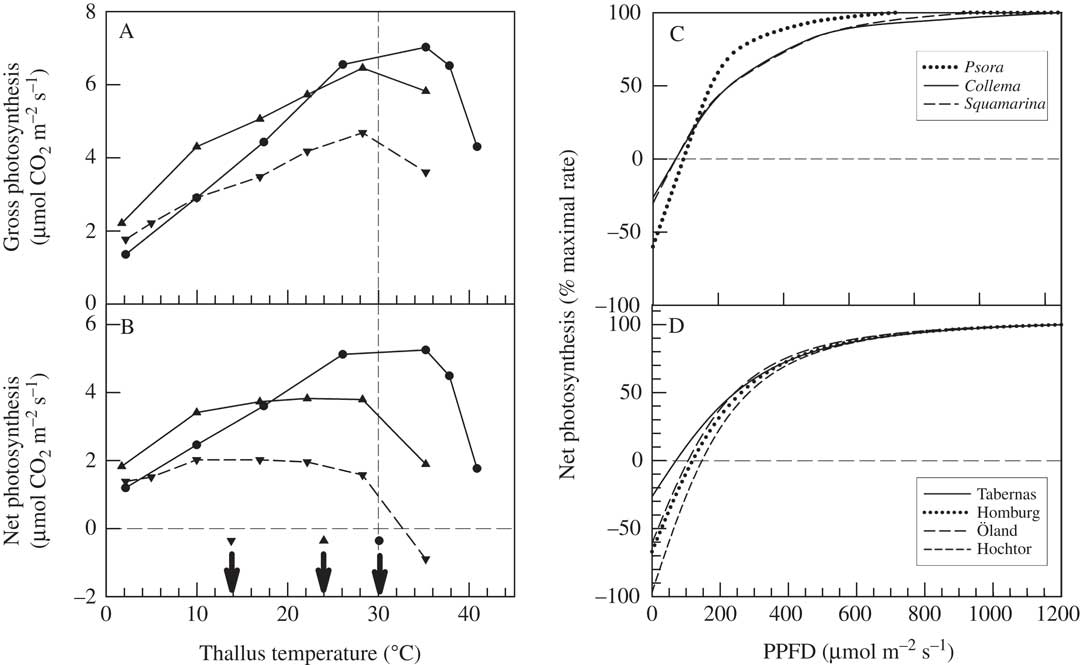
In contrast, for light, all lichens in biocrusts appear to behave in a manner similar to sun-adapted higher plants with high light saturation values for net photosynthesis of 800–1000 µmol photons m−2 s−1 (Fig. 5C). When net photosynthesis is normalized, with maximal value set to 100%, then three lichens from Moab, Utah (P. cerebriformis, C. tenax and Squamarina lentigera (Weber) Poelt; Lange et al. Reference Lange, Belnap, Reichenberger and Meyer1997), and P. decipiens at the four SCIN sites, show very similar responses to light (Fig. 5C & D). The adaptation to high light is also emphasized by compensation values from 80–160 µmol photons m−2 s−1 (Fig. 5D). So, even though the lichens are active mainly at low light levels, they apparently require constitutive protection from the occasional high radiation that might occur, for example, after rainfall, especially storms in summer.
Response to hydration: changes in net photosynthesis
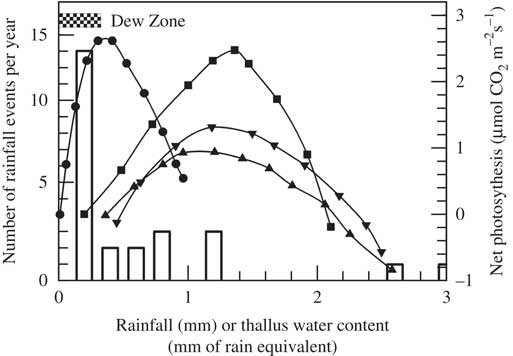
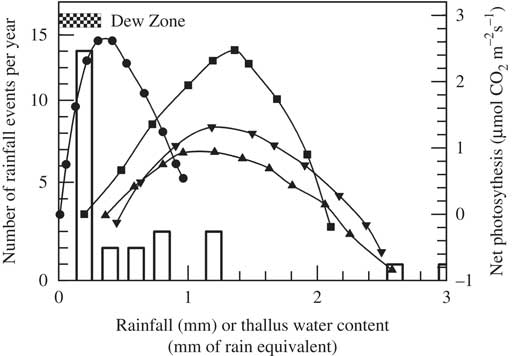
The response of net photosynthesis to thallus water content appears to be a very flexible character amongst lichens in biocrusts, showing differences both within a single site and between sites. The four major lichens at the Tabernas site have similar net photosynthetic responses to thallus water content, with clear optima and severely decreased net photosynthesis at water contents above these optimal levels (Fig. 6). However, whereas P. decipiens, S. lentigera and Toninia albilabra (Dufour) H. Olivier have similar optimal water contents at c. 1·2–1·3 mm rain equivalent, the optimum for D. diacapsis is much lower at 0·3 mm rain equivalent (Fig. 6). The low water content optimum for D. diacapsis probably results from its relatively loose attachment to the soil, which would most likely increase dew deposition and condensation of soil derived water vapour. Net photosynthesis of D. diacapsis is significantly depressed at water contents below the optima of the other lichens. It appears that D. diacapsis makes best use of the most common rainfall events of 0·2 mm and also, one suspects, of dew events which are very common at Tabernas: 98 days with dew per year compared to 46 days per year with a single rainfall event. The other three lichen species will make more use of the heavier rainfall events with little risk of depressed net photosynthesis at high thallus water contents. It is also possible that they can make use of water stored within the soil (see below).
Effect of thallus water content on net photosynthesis in four lichens that are components of the biocrust at Tabernas (Spain): Diploschistes diacapsis (●), Psora decipiens (▼) Squamarina lentigera (■) and Toninia albilabra (▲). Open bars=number of rain events. The normal range of input by dew is shown as a chequered horizontal bar. Data from SCIN project (Büdel et al. Reference Büdel, Colesie, Green, Grube, Lázaro Suau, Loewen-Schneider, Maier, Peer, Pintado and Raggio2014).
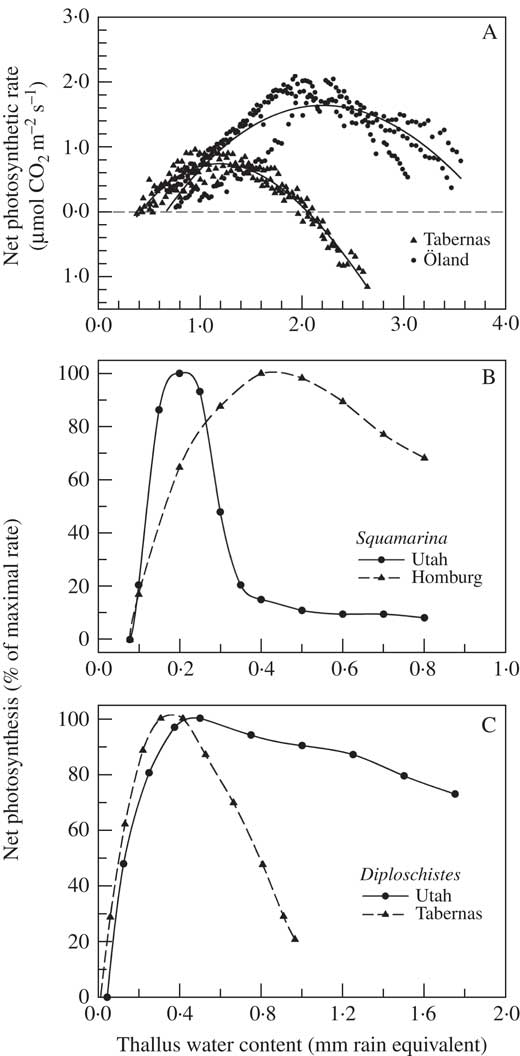
As well as individual species being different, the same lichen species can show different net photosynthetic responses to water content at different locations. The general response can be the same even when the water content range changes, for example in Toninia albilabra at Tabernas and Toninia sedifolia (Scop.) Timdal at Öland, two morphologically highly similar lichens (Fig. 7A). Somewhat more surprisingly, the net photosynthetic response to water content can change with location. Two examples are D. diacapsis, with a strong depression at high water content at Tabernas but no depression at Colorado Plateau, Utah, USA (Fig. 7C), and S. lentigera which shows the exact opposite with depression at high water content in Utah and Tabernas but not in Homburg, Germany (Fig. 7B). Although almost certainly related to thallus structure, at present no explanation exists as to how lichens can change the shape of the net photosynthetic response to thallus water content and it is even more difficult to explain why the changes are opposite in direction for the two species. However, it does show the high versatility of the lichens and this is probably an example of ecotype formation as the lichens are likely to be genetically different at the geographically widely separated locations (Williams et al. Reference Williams, Colesie, Ullmann, Westberg, Wedin and Büdel2017).
Effect of thallus water content on net photosynthesis. A, Toninia sedifolia at Öland (Sweden) (●) and T. albilabra at Tabernas (Spain) (▲); B, Squamarina lentigera at Utah (USA) (●) and at Homburg (Germany) (▲); C, Diploschistes diacapsis at Utah (●) and Tabernas (▲). Note the different scales of the x axes. Data from SCIN project for Öland, Homburg and Tabernas, and Lange et al. (Reference Lange, Belnap, Reichenberger and Meyer1997) for Utah. Lines of best fit were generated in Sigmaplot 11 (Systat. Software Inc.) using non-linear regression.

Responses to hydration: changes in thallus morphology
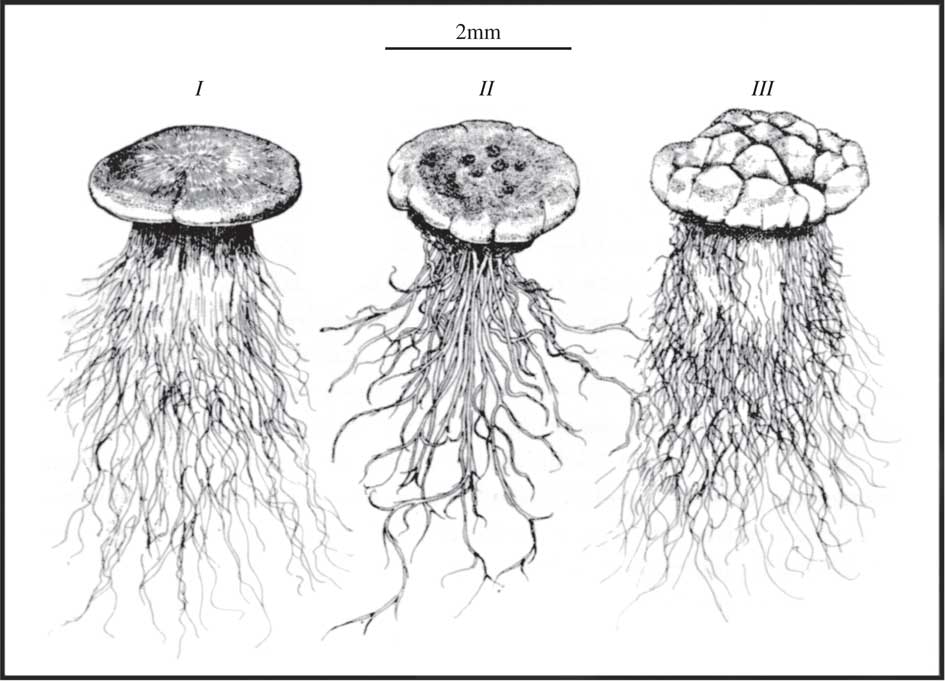
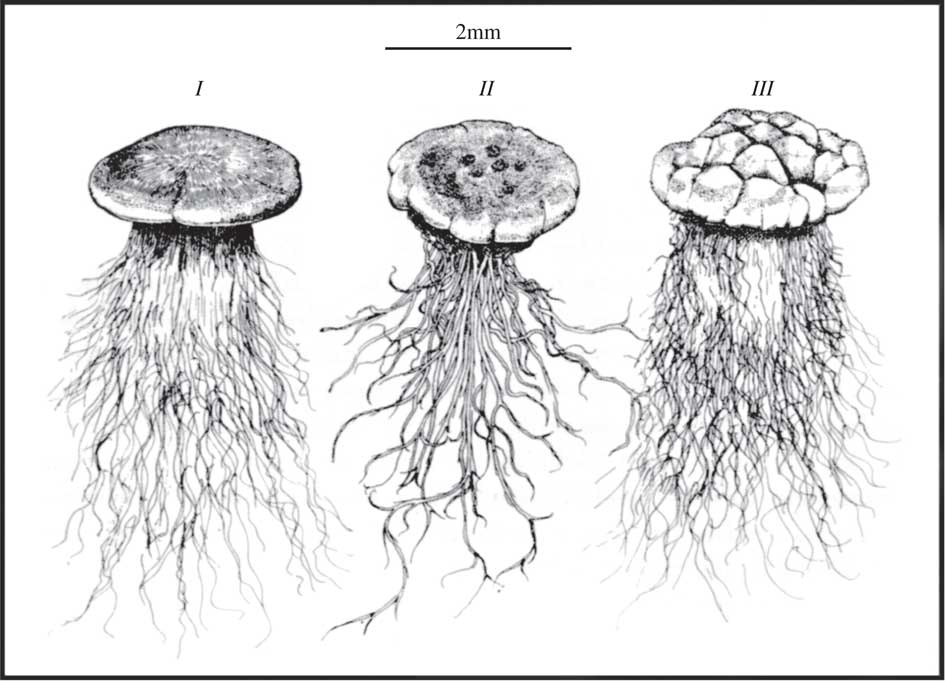
Many lichens that form common components of biocrusts develop rhizomorphs that can extend up to 14 mm into the soil (P. cerebriformis; Belnap et al. Reference Belnap, Büdel and Lange2003). There appears to be a preferred morphotype and several lichens show convergent evolution so that, at first glance, they look almost identical despite being from different genera (Fig. 8; Vogel Reference Vogel1955; Belnap et al. Reference Belnap, Büdel and Lange2003). Rhizomorphs and similar structures can contribute to the stability of the soil surface but it has now been demonstrated that they can move water rapidly into the main thallus in P. decipiens (Colesie et al. Reference Colesie, Green, Raggio and Büdel2016) and must be considered as an adaptation to improve water relations by tapping soil water in a manner similar to higher plant roots.
Convergent growth forms of thalli of three soil crust lichens from South Africa; I, Lecidea sp.; II, Endocarpon sp.; III, Toninia sp. showing large development of rhizinae and hyphae (from Vogel Reference Vogel1955, with permission).
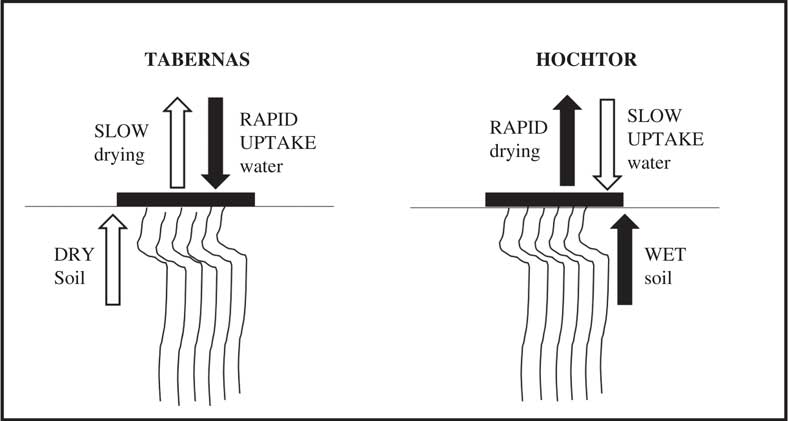
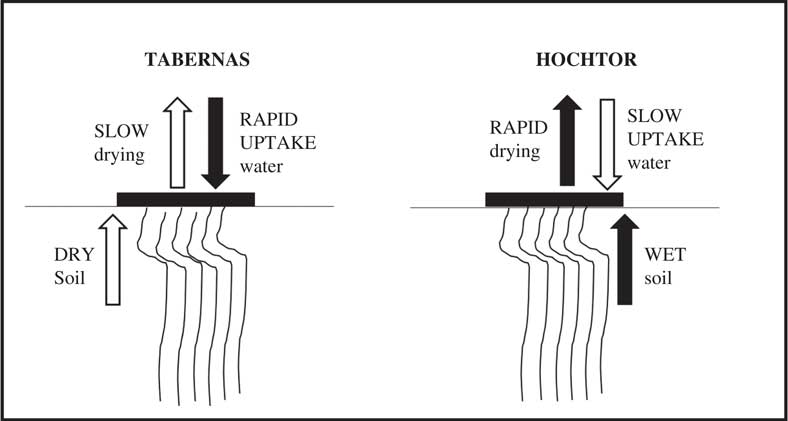
Psora decipiens develops distinct ecotypes (morphologically and genetically different) at two environmentally highly divergent sites: Tabernas, the most extreme desert in Europe, and Hochtor, a high alpine location (Fig. 9, from Colesie et al. Reference Colesie, Williams and Büdel2017). Thalli at Tabernas show the unlikely combination of rapid water uptake (drops of water absorbed in a few seconds) and slow drying. This combination suits the sporadic water supply in Tabernas and probably also assists with dew uptake. In contrast, thalli at Hochtor show the opposite combination of slow water uptake and rapid drying. In the latter case there is probably ample water available from the soil, which is accessed by rhizomorphs, with the hydrophobic upper surface preventing thallus oversaturation and depressed net photosynthesis at high water contents. The results also show the probable importance of soil conditions in water relations. The rates of net photosynthesis are very similar in the two ecotypes, indicating again that water seems to be the major driver for adaptation in the biocrust environment.
Hydration related adaptations in the lichen Psora decipiens growing at two environmentally divergent sites: Tabernas, the most extreme desert in Europe, and Hochtor, a high alpine location (developed from Colesie et al. Reference Colesie, Williams and Büdel2017). The lichen thallus is portrayed as a horizontal black rectangle on the soil surface; arrows above the lichen indicate rate of water exchange with the atmosphere (filled indicates high rate, open low rate) whilst arrows below the lichen indicate rate of water uptake from the soil.
Phenotypic plasticity
Several examples of phenotypic plasticity are now known for biocrust lichens. Long-term monitoring of gas exchange in Cladonia convoluta (Lamkey) Anders and the rock surface inhabiting Lecanora muralis (Schreber) Rabenh. showed that the response of dark respiration to temperature shows almost full acclimation so that dark respiration rates are close to identical at the mean temperature of the various seasons (Lange & Green 2003, Reference Lange and Green2005). Lichens are also known to change photobionts in response to the local habitat, with the most spectacular examples being the photosymbiodemes in the genera Pseudocyphellaria and Sticta which change completely from cyanobacterial to green-algal photobionts (Henskens et al. Reference Henskens, Green and Wilkins2012). The common soil crust lichen Psora decipens has a different photobiont at its alpine (Hochtor) and desert (Tabernas) sites (Ruprecht et al. Reference Ruprecht, Brunauer and Türk2014), and transplants made in the SCIN project showed that photobionts in Hochtor thalli were lost and not replaced when transplanted to Tabernas (Williams et al. Reference Williams, Colesie, Ullmann, Westberg, Wedin and Büdel2017).
Conclusions
Biocrust lichens are normally dry and dormant when the most extreme environmental conditions, such as temperatures of c. 60°C, occur. As such they are excellent examples of the so-called avoidance strategy (Levitt 1980). It appears that water is the major driver of adaptation in biocrust lichens, which is scarcely a surprise given that they are poikilohydric. The lifestyle of lichens in biological soil crusts is remarkable for the high level of morphological and physiological adaptations and acclimations that occur, both for the same species at different sites and different species at the same site. These can be summarised as follows. First, the most common, and apparently obligate, adaptation is the high saturation level for the response of net photosynthesis to light. This can be understood as being required to protect photosystems against the occasional extreme levels of incident radiation. The selection pressure must be considerable since a high saturation for net photosynthesis brings with it a high compensation value, and this is potentially very negative for carbon gain as the lichens are most commonly active at low light levels after nocturnal hydration by dew or fog. Second, there is an impressive range of changes in the response of net photosynthesis to thallus water content with some species, such as Diploschistes diacapsis being active at very low water contents and able to utilize dew and common low rainfall events. Third, there are changes in the response of net photosynthesis to thallus water content. A feature for many lichens is that net photosynthesis is depressed, often severely so, at high water contents. This can have major effects on the lichen carbon budget and has been shown best by long-term studies on various lichens, such as Lecanora muralis, which has a severe depression and gains very little of its net carbon from common rainfall events but a much higher proportion from nocturnal hydration by dew or fog which do not lead to elevated water contents (Lange Reference Lange2003). In contrast, a species such as Cladonia convoluta, with no depression of net photosynthesis at high thallus water content, can make full use of rain events and is more productive (Lange & Green Reference Lange and Green2003). One might expect, therefore, that there might be strong selection pressure to remove or minimize the depression at high water content and, indeed, some species of biocrust lichens, Squamarina lentigera and D. diacapsis, show that thalli at different locations can be with and without the depression. The question then remains, why is the depression not always removed? Also, even more confusingly, why does S. lentigera show the depression in Utah and not in Tabernas while D. diacapsis does exactly the opposite? There are still limits to our understanding of lichen ecophysiology. Fourth, an impressive morphological adaptation is the occurrence of rhizomorphs and similar structures that not only bind the lichens to the soil surface but also enable them to access stored water within the soil (Colesie et al. Reference Colesie, Williams and Büdel2017). The considerable morphological similarity of the thallus and rhizomorphs of lichens from different genera is an excellent example of convergent evolution (Belnap et al. Reference Belnap, Büdel and Lange2003). The occurrence of rhizomorphs means that soil water relations also need to be taken into account, which limits extrapolations from studies on lichen thalli that have been removed from the soil. Fifth, Psora decipiens is a widely distributed biocrust lichen and shows an impressive range of morphological adaptations that represent ecotypes (Colesie et al. Reference Colesie, Williams and Büdel2017) and also phenotypic plasticity in the form of photobiont changes (Ruprecht et al. Reference Ruprecht, Brunauer and Türk2014; Williams et al. Reference Williams, Colesie, Ullmann, Westberg, Wedin and Büdel2017). Sixth, it is also now clear that the lichens in biocrusts can remain continuously hydrated and active for very long periods, up to five or six months, and the concept that continuous hydration is detrimental for lichens must be abandoned or, at the very least, looked at in terms of the lichens’ habitat. Lichens at the alpine site of the SCIN project are snow-covered and almost certainly hydrated for over six months with no light reaching them. At present, we have no understanding of how this is achieved and it remains an area for potential future research.
This work was supported by the ERA-Net BiodivERsA program as “Soil Crust InterNational (SCIN) – Understanding and valuing biological soil protection of disturbed and open land surfaces”, as part of the 2010–2011 BiodivERsA joint call with national funding from the German Research Foundation (DFG) project number BU666/17-1, Austrian Science Fund (FWF), the Swedish Research Council for Environment, Agricultural Sciences and Spatial Planning (FORMAS), and the Spanish Ministerio de Economía y Competitividad (MINECO) project nos PRI-PIMBDV-2011-0874 and CTM2015-64728-C2-1-R. Rolf Gademann (Gademann Instruments) is thanked for the development of the monitoring equipment (MoniDA) used in these projects.