The delegation of discretionary power by policy makers to implementers is a salient feature of all known political systems. Delegation affects policies and consequently citizens, because it gives implementers the authority to set policy as they see fit, at least within certain circumscribed boundaries. In the European Union (EU), policy makers delegate authority to the European Commission and/or member states’ national administrations. The delegation of power to the Commission has an important function in the political system of the EU. The Commission uses its delegated authority to act as the ‘engine of integration’ and overcome collective action problems among states.Footnote 1 The delegation of power to member states in EU laws may be viewed benignly as an attempt to advance policy co-ordination while preserving diversity and flexibility. The dark side of delegation to member states is that at the extreme this would render European-level policy making a symbolic affair.
The present study focuses on delegation in legislation. Specifically, we ask what explains variation in the amounts of discretion delegated to (a) the Commission and (b) member states. The laws we examine consist of directives, regulations and decisions adopted by the Council of Ministers, or the Council of Ministers and the European Parliament (EP). The sets of relevant policy makers include member states’ representatives in the Council of Ministers. When the co-decision procedure applies, Members of the European Parliament (MEPs) are also particularly involved. The Commission is not only a possible implementation agent; it is also involved in the decision-making stage as the institution that formally introduces the legislative proposal.
We compare three perspectives on delegation in the European Union: the transaction-costs perspective, the commitment perspective, and the consensus-building perspective. According to the transaction-costs perspective, policy makers (member states’ representatives in the Council and MEPs) differ from implementers (the Commission and member states’ national administrations) in the information resources they hold. Implementers are better informed about the effects of European policies than are policy makers, particularly on policy issues that are highly complex or have a high ‘information intensity’. When implementers’ policy preferences are in line with those of policy makers, it is most efficient for policy makers to grant high levels of discretion to implementers. However, when implementers’ preferences diverge from the decision outcomes adopted by policy makers, those implementers have incentives to deviate. In this case, policy makers are faced with a choice. Should they delegate discretionary power to implementers in the knowledge that policy drift may occur? Or should they tightly circumscribe implementers’ discretionary power and closely monitor implementers’ actions, even if they incur high transaction costs in doing so? The analytical results of this simple principal–agent model are straightforward. EU policy makers will grant more discretion to the Commission and to states’ national administrations on policy issues that are more information intensive. EU policy makers will also grant more discretion to the Commission and states’ national administrations when these implementers have less incentive to deviate.
The commitment perspective refers to delegation to the Commission. This perspective builds upon the ‘fiduciary principle’: the need for member states to make credible commitments to abide by supranational policies.Footnote 2 Some policy issues are prone to acute commitment problems, because – for example – member states’ preferences are highly divergent, or the policy efforts required to achieve targets are costly to monitor. To commit themselves credibly to a supranational policy in these circumstances, EU policy makers may delegate authority to an independent implementer, the European Commission. When a commitment problem arises, we expect policy makers to grant discretionary power to the Commission. The Commission need not be an ‘ally’ of policy makers (in the sense that the transactions-costs perspective requires the Commission and the policy makers to have similar preferences) for policy makers to grant it discretionary power.
The consensus-building perspective refers to delegation to states’ national administrations. This perspective focuses on the difficulty of reaching consensus among member states’ representatives in the Council. According to this perspective, consensus is built by granting member states discretionary powers or even exemptions.Footnote 3 Policy makers’ desire to reach agreement, not their expectations about the implementation stage, drives the amount of delegation they grant to national administrations. When the Council is required to adopt a bill unanimously, it is particularly difficult to resolve disagreement. Therefore, when the unanimity rule applies, conflict in the Council will positively affect the amount of discretion granted to states’ national administrations. This contrasts with the supposed effect of conflict in the Council on delegation to states according to the transaction-costs perspective.
Consider the following example of an EU law that delegates a considerable amount of discretionary power to the Commission. In 2004, the Commission introduced a proposed regulation for the European Neighbourhood and Partnership Instrument (ENPI).Footnote 4 The ENPI, which was adopted in 2006, introduces a new regime for co-ordinating the EU’s €11 billion of external assistance programmes to countries in Eastern Europe, the Southern Caucasus and North Africa. Prior to its adoption, the ENPI gave rise to considerable controversy among state representatives in the Council. The main contentious issue concerned the allocation of funds to North African countries relative to the EU’s neighbouring countries to the east. The Mediterranean member states, in particular France, attempted to safeguard funding for North Africa. The regulation adopted by the Council and EP contained only a modest concession towards the French position. The regulation was appended with a declaration stating that the Commission would consider historical allocations when deciding on the allocation of funds. Such declarations are not legally binding, but some key informants speculated that the declaration will nevertheless be used by the French to exert influence on the Commission when the financial allocations are being made. Essentially, the content of the regulation is close to the Commission’s preference. In terms of delegation, the regulation grants a large amount of discretionary power to the Commission. Of the regulation’s 106 major provisions, twenty-two granted discretionary power to the Commission when implementing the ENPI. Only two of the regulation’s provisions granted discretion to member states.
The three perspectives on delegation emphasize different aspects of the decision situation in relation to the ENPI. Why does this particular regulation delegate so much power to the Commission and so little to member states? From the transaction-costs perspective, we might ask whether the complexity or information intensity of the law stimulated policy makers to grant discretion to the Commission as their specialized implementation agent. However, the ENPI Regulation has an average level of information intensity, as measured by the number of recitals it contains.Footnote 5 The transaction-costs perspective also directs our attention to the fact that the regulation was essentially in line with the Commission’s preference. From the commitment perspective, we could ask whether the substantial level of conflict in the Council resulted in credibility problems that induced member states to grant discretion to the Commission. From the consensus-building perspective, we wonder why the high level of conflict in the Council was not resolved by granting more discretion to the member states.
The present study derives hypotheses from the three perspectives and tests these hypotheses in a comparative research design. The analysis is based on a dataset with information on eighty-six EU laws. The data include detailed information on both the policy preferences of the Commission and member states in the Council, and on the levels of discretion granted in the EU laws to the Commission and to member states. Since the configuration of actors’ preferences is central to all models of delegation, such information is essential to testing the implications of these models. Our measures of the amounts of discretion delegated to the Commission and to the states’ national administrations are based on procedures similar to those applied by Franchino,Footnote 6 who in turn built upon the operationalization of Epstein and O’Halloran.Footnote 7 This enables us to compare the results of our new tests with existing findings.
Three perspectives on delegation in the EUropean union
The Transaction-Costs Perspective
As stated above, when policy makers do not delegate to implementers, they incur transaction costs from specifying policies in detail and monitoring whether implementers adhere to those details.Footnote 8 Formal models of delegation based on the transaction-costs perspective were first developed in the study of lawmaking in the US CongressFootnote 9 and were subsequently adapted for comparative analysis.Footnote 10 The models have three strong implications.Footnote 11 First, there is a delegation set, a set of alternative policies circumscribed by a threshold beyond which politicians will not grant discretion to an implementer. The delegation set varies in size, depending on the information intensity of the policy issue. Secondly, policy makers delegate to the implementer with policy preferences closest to their own. In other words, policy makers delegate to the implementer with least incentive to deviate. This is called the ally principle. Thirdly, when no implementer has a policy preference within the delegation set, policy makers’ risk aversion leads to the inefficient outcome of non-delegation.
Several studies applied the transaction-costs perspective to delegation in the EU.Footnote 12 Franchino developed a transaction-costs model of EU delegation in legislation, in which policy makers in the Council and the EP decide on the amount of discretionary power to give to the Commission or member states’ national administrations.Footnote 13 In Franchino’s model, information asymmetry exists between the ministers in the Council on the one hand, and member states’ national administrations and Commission experts on the other. In this model, ministers in the Council are not always informed about the particular administrative conditions in their own country, far less about the conditions in other member states. Franchino’s model replicates the transaction-cost perspective’s prediction about the positive effect of complexity or information intensity on delegation to both the Commission and member states:
Hypothesis 1: Laws involving higher levels of information intensity delegate more discretion to (a) the Commission and (b) member states’ national administrations.
In Franchino’s model, large differences between the Commission’s policy preferences and member states’ policy preferences discourage policy makers in the Council from delegating power to the Commission.Footnote 14 Therefore, with respect to the Commission, Franchino’s model replicates the transaction-cost perspective’s prediction about the negative effect of implementers’ incentives to deviate on the amount of delegation (the ally principle):
Hypothesis 2: Laws from which the Commission has more incentive to deviate delegate less discretion to the Commission.
The effect of states’ incentives to deviate as implementers is complicated by the fact that member states may be conceived of as both policy makers and implementers. When state representatives in the Council disagree, but nonetheless manage to adopt a legislative act, some states are closer allies of the Council than others. This is reflected by each member state’s incentive to deviate, which is a function of the distance between its policy preference and the decision outcome. The aggregate incentive to deviate is not only a measure of states’ incentives to deviate, but also of the level of conflict in the Council. Thus, for delegation to member states, the ally principle directly translates into a hypothesis about the effect of conflict in the Council.
The transaction-costs perspective has also been used to examine the effects of disagreement among policy makers on their decision to delegate. However, different transaction-cost models yield different expectations. Bendor and Meirowitz’s general model of delegation assumes that delegation requires the support of coalitions of politicians. It is more difficult to form coalitions when voting rules are more inclusive and when there is more disagreement among politicians.Footnote 15 In the EU, Bendor and Meirowitz’s hypotheses imply the following relations:
Hypothesis 3: Laws subject to unanimity voting in the Council delegate less discretion to (a) the Commission and (b) member states than laws subject to the qualified majority rule.
Hypothesis 4: Laws that were the subject of higher levels of conflict in the Council delegate less discretion to (a) the Commission and (b) member states.
Other transaction-cost models of delegation, however, generate different expectations about the effect of disagreement among policy makers. Some models assume that when there is a high level of political conflict, politicians will not inform each other about the policy outcomes that are likely to result from particular measures.Footnote 16 Poorly-informed politicians must rely more on the expertise of implementers. Consequently, these models predict that conflict among policy makers leads them to grant more discretion to implementers. Indeed, Epstein and O’Halloran show that decisions in the US Congress involving outlier committees (as an indicator of political conflict) grant relatively high levels of discretion to the executive.Footnote 17
Franchino’s model of delegation in the EU predicts that conflict in the Council and qualified majority voting lead policy makers to grant more discretion to the Commission and less discretion to member states. In view of these contrasting predictions, we stated Bendor and Meirowitz’s hypotheses as the most general baseline against which to test the transaction-costs perspective in the EU empirically.
The Commitment Perspective on Delegation to the Commission
Policy makers often face a commitment problem in relation to decision outcomes.Footnote 18 Two types of commitment problem can be distinguished. The first type arises when policy makers wish to commit themselves credibly to a decision outcome they opposed or did not fully support during the decision-making stage. A decision outcome may differ from policy makers’ preferred positions because they were outvoted or found it expedient to support the outcome in return for concessions on other issues. The concern underlying this type of commitment problem is that policy makers will fail to comply with the decision outcome and will instead implement their own preferred policy. This concern is particularly acute in political systems such as the EU, in which the boundaries between policy makers (member states’ representatives in the Council) and implementers (member states’ national administrations) are blurred. Indeed, empirical research on compliance with EU directives shows that under certain conditions member states disagreeing with decision outcomes face compliance problems.Footnote 19
The second type of commitment problem arises when policy makers commit themselves to the pursuit of certain policy aims, of which the costs and benefits vary over time. Here, decision outcomes may have been in line with policy makers’ preferences at the time decision outcomes were agreed upon. The concern underlying this type of commitment problem is that the same policy makers may not find these decision outcomes expedient in the future. The typical example of this commitment problem is monetary policy, where policy makers who agree to pursue anti-inflationary policies are likely to be tempted to initiate inflationary policies in the future.Footnote 20 Similarly, despite broad support for the Stability and Growth Pact (SGP) when it was adopted, member states’ commitment to the SGP has been called into question by their subsequent poor records of compliance.Footnote 21
The standard solution to commitment problems is to delegate authority to an independent agency. An independent agency can allay concerns that policy makers will fail to enforce decision outcomes that are not in line with their preferences or that their support for decision outcomes will waver over time. For example, many countries take specific monetary decisions out of the realm of party politics and grant independent central banks discretion in monetary policy making. Keefer and Stasavage’s model of monetary policy shows that, in the presence of multiple polarized veto players in the political arena, delegation to an independent agent positively affects politicians’ credibility.Footnote 22 Similarly, Majone applies the commitment perspective to delegation in the treaties of the EU.Footnote 23 He argues that member states delegate powers to the Commission to solve commitment problems that are pervasive in specific policy domains. Member states select Commissioners with pro-integration preferences to commit themselves to supranational policies laid down in the treaties.Footnote 24 Pollack reports that commitment problems also play a considerable role in policy makers’ decisions to grant discretion to the Commission in legislation.Footnote 25
In the present study, the commitment perspective implies that policy makers in the Council solve their commitment problems by delegating authority to the Commission as an independent agent. The severity of the commitment problem will positively affect the level of discretion granted to the Commission. The first type of commitment problem arises when member states’ policy preferences diverge from the decision outcomes that are adopted. Specifically, we expect that:
Hypothesis 5: Laws that were the subject of more conflict in the Council delegate more discretion to the Commission.
We do not formulate a hypothesis concerning the second type of commitment problem, which refers to the concern that policy makers may change their preferences or face different opportunities and constraints after the adoption of the legislative act. In the context of the specific cases of legislation examined here, it is unclear when this second type of commitment problem is prevalent.Footnote 26
The Consensus-Building Perspective on Delegation to Member States
According to the consensus-building perspective, the delegation of discretionary powers to member states is an integral part of the bargaining process. As in many other political systems, bargaining in the EU involves a trade-off between decisiveness and inclusiveness.Footnote 27 Inclusive decision rules in combination with conflict in the Council slow down decision making and make it more likely that the status quo will continue.Footnote 28 One way of increasing decisiveness is to make the decision rules less inclusive, as has been done by expanding qualified majority voting to more policy areas in successive revisions of European treaties.
Another solution to the problem of indecisiveness is to permit diversity in legislative arrangements at the national level. A prominent example was the opt-out clause for the United Kingdom in European social policy. Policy makers delegate such discretion to member states to build consensus in the Council. These arrangements prevent states from withholding support because they would have to change their existing national policies. Using the logic of the consensus-building perspective, Dimitrova and Steunenberg’s model explains why member states often agree to relatively low minimum standards at the EU level, while maintaining diverse national policies.Footnote 29 At the extreme, a law that delegates full discretion to member states is symbolic law, since all member states can maintain their status quo policies.
If delegation to member states is driven by the logic of consensus-building, the level of discretion is a function of two variables: the inclusiveness of the decision rule and the level of conflict in the Council. Under unanimity, the veto of only one member state is sufficient to block the adoption of a legislative proposal. Hence, we expect that more discretion is delegated to member states in laws decided by the unanimity rule than in laws decided by the qualified majority rule. The effect of conflict in the Council will be particularly marked when the unanimity rule applies. Since states’ policy preferences often reflect their existing national policy practices, conflict in the Council means that, if no discretion were delegated to member states, at least some states would need to change their policies. The consensus-building perspective implies the following hypotheses that diverge considerably from those of the transaction-costs perspective:
Hypothesis 6a: Laws subject to the unanimity rule delegate more discretion to member states than laws subject to the qualified majority rule.
Hypothesis 6b: If the unanimity rule applies in the Council, laws that have been the subject of more conflict in the Council delegate more discretion to member states.
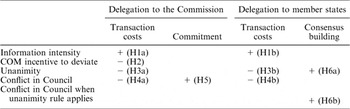
All the hypotheses are summarized in Table 1.
Summary of Hypotheses

Design and data
The Selection of Legislative Acts
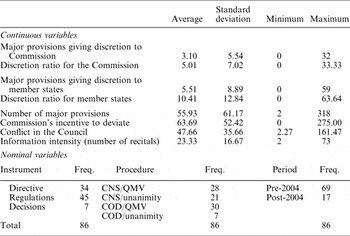
The cases we examine consist of eighty-six legislative acts.Footnote 30 Legislative proposals introduced by the Commission were selected for study according to three criteria: the time period involved, the type of legislative procedure followed and the level of political importance. Regarding the time period, each legislative proposal was on the Council’s agenda in the years 1999, 2000 or introduced after the 2004 enlargement. Legislative proposals introduced up to December 2005 were included. Concerning the decision-making procedure, the legislative proposals selected were subject to either the consultation or the co-decision procedures. Regarding political importance, the selection was restricted to proposals on which there was an indication of at least some political importance and controversy. Each proposal was mentioned in Agence Europe or European Voice, news services covering European affairs. Furthermore, key informants had to identify at least one substantive disagreement between at least some of the actors. We included directives, regulations and decisions in the EU-15 study, but excluded decisions from the post-2004 study. Of the proposals that met these criteria in the post-2004 study, seventeen became legislative acts in time for inclusion in the present study, July 2008. Given these selection criteria, the policy areas represented most prominently in the selection are agriculture (nineteen acts), internal market (thirteen), fisheries (ten), economic and financial affairs (nine), Justice and Home Affairs (six) and ten other areas (twenty-nine). The descriptive information at the bottom of Table 2 summarizes the characteristics of our cases in terms of instrument, legislative procedure and time period.
Description of the Eighty-Six Cases

Note: CNS = consultation; COD = codecision.
The Measurement of Delegation to the Commission and Member States
Our measure of discretion is based on a similar procedure to Franchino’s adaptation of Epstein and O’Halloran’s procedure for measuring executive discretion.Footnote 31 When examining the extent to which a law delegates power to the Commission, our dependent variable is the count of the law’s major provisions that grant discretionary power to the Commission. When examining the extent to which a law delegates power to member states, our dependent variable is the count of the law’s major provisions that grant discretionary powers to member states. A provision grants discretionary executive power to states if it allows the Commission or states to choose whether or not to take a particular action, or to take one of a number of actions. For example, the directive on consumer goods and associated guarantees (1999/44/EC) contains the provision that ‘Member States may provide that, in order to benefit from his rights, the consumer must inform the seller of the lack of conformity [with the contract] within a period of two months from the date on which he detected such lack of conformity’ (Article 5.2). This provision gives member states the discretion to require that consumers must report defects of products within two months of discovering the defect to benefit from the guarantee, even if they return the product within the guarantee period from the date of purchase.
Our decision to take the counts of major provisions that grant discretionary power as the dependent variables was based on the observed distribution of discretionary power. There are a considerable number of zero counts in our data: twenty-seven of our eighty-six observations grant no discretion to the Commission, while thirty-nine of our eighty-six observations grant no discretion to member states. As is clear from the descriptive information contained in Table 2, the variances of both dependent variables are greater than the mean values, a statistical property referred to as over-dispersion. Negative binomial regression is a model specifically designed for over-dispersed dependent variables. Given that our dependent variables are the counts of major provisions to the Commission and member states, we control for the total number of major provisions in each law. Obviously, we expect longer laws with more major provisions to contain higher counts of provisions that grant discretion. Table 2 gives descriptive information on the distribution of our dependent variables. It also contains information on the distribution of the discretion ratio. This is simply the number of major provisions that grant discretion as a percentage of the total number of major provisions.
Our measures of delegation have a high degree of construct validity. Directives grant more discretion to member states than do regulations and decisions, which is in line with the conventional wisdom that directives provide states with more room for manœuvre than other instruments. Directives grant less discretion to the Commission than do regulations and decisions, which is consistent with the fact that directives are implemented by member states, rather than the Commission. Further, we find a significant negative relation between delegation to the Commission and delegation to member states. This is consistent with Franchino’s finding that policy makers delegate power either to the Commission or to member states.Footnote 32
The Measurement of the Commission and Member States’ Incentives to Deviate
Our measures of the Commission and member states’ incentives to deviate are based on information from interviews with key informants. The informants described the controversial issues raised by each legislative proposal in terms of policy scales, and gave estimates of the positions of each actor and the relative importance of each issue to each actor. Key informants gave 239 interviews about decision making on these eighty-six laws. The interviews typically lasted 60–90 minutes. The key informants were selected for their knowledge of the detail of the dossiers under investigation. Usually, they were participants, such as desk officers in the permanent representations, Commission officials and EP rapporteurs or their assistants.
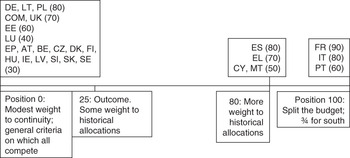
Each of the controversial issues was represented spatially, in the form of a policy scale ranging from 0 to 100. Figure 1 summarizes the data regarding the European Neighbourhood and Partnership Instrument referred to in the introduction. The decision outcomes favoured most by the Commission, each of the member states and the European Parliament were estimated by the experts during the interviews. The informants’ estimates of actors’ positions refer to the decision outcomes preferred by each of the actors at the time of the introduction of the Commission’s proposal. For each issue, the most extreme decision outcomes are located at the ends of the policy scale, at positions 0 and 100. Actors with other positions were placed between these extremes by the key informants to represent their views on the political distances between their positions and each of the extremes.
Positions of EU-25 on the issue of continuity in the programming of the EU’s neighbourhood policy Notes: Salience scores in parentheses. AT: Austria; BE: Belgium; CY: Cyprus; CZ: Czech Republic; DK: Denmark; EE: Estonia; FI: Finland; FR: France; DE: Germany; EL: Greece; HU: Hungary; IE: Ireland; IT: Italy; LV: Latvia; LT: Lithuania; LU: Luxembourg; MT: Malta; PL: Poland; PT: Portugal; SI: Slovenia; SK: Slovakia; ES: Spain; SE: Sweden; UK: United Kingdom; COM: Commission; EP: European Parliament. The Netherlands (NL) did not take a position on this issue.

The informants were also asked to estimate the level of importance each of the actors attached to each issue. This level of importance was estimated on a scale of 0–100, whereby a score of 0 indicates that the issue was of no importance whatsoever, 50 that it had an ‘average’ level of importance to the actor concerned, and 100 that the issue could not be more important. The relations between the salience scores for different actors are more important than the absolute values of the scores. As with the procedures for estimating actors’ capabilities and actors’ positions on controversial issues, the procedure for estimating issue salience was adapted from a widely used procedure for decision analysis.Footnote 33 When obtaining the judgements on actors’ positions and the levels of importance they attached to the issues, they were asked to substantiate their judgements extensively. Validity and reliability tests were conducted on the informants’ judgements, the details of which have been published elsewhere.Footnote 34
The Commission’s incentive to deviate on law d, IDCOMd, is defined as:

Where positionCOMa denotes the position of the Commission on issue a from the set of issues m raised during the political discussions on the law prior to its adoption, outcomea is the decision outcome on issue a. This is the outcome of the political discussions embodied in the legislative act. The level of salience that the Commission attaches to issue a (in the calculations, salience is divided by 100 so that it ranges from 0 to 1) is salienceCOMa. The number of controversial issues raised by the law prior to its adoption is denoted by m. Thus, the more distant the Commission is from the outcomes in the act, and the higher the level of salience the Commission attaches to those issues, the stronger the Commission’s incentive to deviate. Our inclusion of the Commission’s salience is based on the assumption that issue salience gauges the extent to which the Commission is expected to respond to its incentive to deviate.
The above hypotheses also refer to conflict in the Council. This concept refers to the aggregated distances between member states’ positions and the decision outcomes embodied in a legislative act. As such, this is an aggregation of member states’ incentives to deviate from the content of the decision outcomes. For law d, the aggregate member states’ incentive to deviate, IDMSd, is defined as:

where, using the same notation as above, positionia is the position of member state i (from the set of member states n) on issue a (from the set of issues m raised by the law when it was a legislative proposal). The decision outcome contained in the law on issue a is denoted by outcomea, while capabilitiesia is a measure of member state i’s capabilities to influence the outcome of the decision on issues a (the capability weight for each member state is standardized so that the sum of the capabilities of all the member states in the Council is 1). Thus, member states’ incentives to deviate are stronger when powerful member states disagree with the content of the decision outcomes on many controversial issues. The measure of capabilities is based on a voting power index, the Shapley–Shubik Index.Footnote 35
The Measurement of Information Intensity
Information intensity or complexity is measured by the number of recitals in the law. Recitals precede the articles and major provisions of each law. They usually state the principles and assumptions on which the law is based, and often refer to other laws to which the present one relates. For a similar purpose, Kaeding uses the number of recitals to measure the amount of detail in laws.Footnote 36
Control Variables
We report statistical models with two control variables: the number of major provisions mentioned above and a dichotomous variable identifying the cases that are directives. The inclusion of the number of major provisions is obvious. We expect acts with more provisions to have higher counts of provisions that grant discretion. The inclusion of a dichotomous variable for directives requires more justification. Arguably, the conflict in the Council that we observe might affect the Commission’s decision to introduce a particular type of instrument. If the general policy problem to which the legislative proposal relates is fraught with controversy, the Commission may decide to introduce a directive, rather than a regulation, since directives give more discretion to member states. If this were the case, it would not be appropriate to control for the type of instrument when examining the effect of conflict in the Council. However, our measure of conflict in the Council is based on controversial issues that arose after the Commission introduced the proposal, and therefore after the type of instrument had been selected. It is, therefore, unlikely that the controversy we observe has affected the type of instrument selected.Footnote 37 As will be reported in the following section, the inclusion of a control variable for directives is crucial to our results.
Analysis
Delegation to the Commission
Delegation to the Commission is purportedly explained by information intensity (Hypothesis 1a), the Commission’s incentive to deviate (Hypothesis 2), the decision rule (Hypothesis 3a) and conflict in the Council (Hypotheses 4a and 5), depending upon the theoretical perspectives as outlined in Table 1. Of these hypotheses, we find significant evidence in line with only the first hypothesis (1a) concerning information intensity, which is at the core of the transaction-costs perspective.
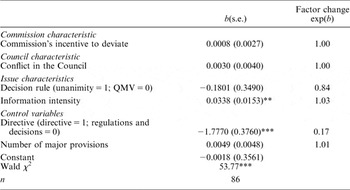
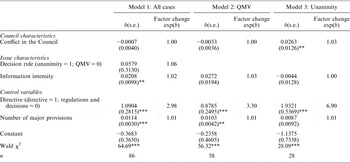
The first hypothesis, derived from the transaction-costs perspective, posits that information intensity positively affects the amount of discretion granted to the Commission. Table 3 shows that information intensity (the number of recitals) has a positive effect on the number of major provisions that grant discretionary powers to the Commission. The exponent of the coefficient (factor change) of 1.03 indicates that every additional recital is associated with an increase of 3 per cent in the count of major provisions that give discretion to the Commission.
Delegation to the European Commission

**p < 0.05; ***p < 0.01.
Note: Negative binomial regressions (robust standard errors in parentheses). The likelihood ratio test that α = 0 is significant (p = 0.00), indicating that the data are over-dispersed.
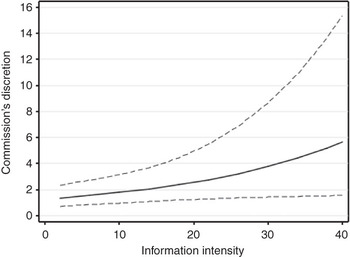
Figure 2 contains additional information on the magnitude of the effect of information intensity on delegation to the Commission.Footnote 38 The unbroken line shows the increase in the expected count of major provisions that grant discretion to the Commission at different levels of information intensity. At the lowest observed level of information intensity, the expected count of discretionary provisions for the Commission is 1.36. At an average level of information intensity, this expected count more than doubles to 2.91. At a high level of information intensity (one standard deviation above the mean), the expected count of major provisions that give discretion to the Commission increases to 5.67.
Expected count of delegation to the Commission at different values of information intensity Note: Effects estimated with the model in Table 3. We varied information intensity from 2 to 40 recitals, which is from the minimum value to approximately one standard deviation above the mean.

There is little to no evidence for the other three hypotheses from the transaction-costs perspective concerning delegation to the Commission (Hypotheses 2, 3a and 4a). The Commission’s incentive to deviate does not appear to affect the amount of discretion given to the Commission (Hypothesis 2). In line with the transaction-costs perspective, laws subject to unanimity voting in the Council grant less discretion to the Commission (Hypothesis 3a). However, the effect is nowhere near statistical significance. There is no evidence that conflict in the Council is negatively associated with the amount of delegation to the Commission (Hypothesis 4a).
Contrary to the commitment perspective on delegation to the Commission, there is no evidence that Conflict in the Council positively affects the amount of delegation to the Commission (Hypothesis 5). The coefficient associated with conflict in the Council is positive but does not differ significantly from 0.
Regarding our control variables, directives clearly grant far less discretion to the Commission, even after controlling for other variables. This is a strong and significant effect. Moreover, without controlling for the type of instrument, information intensity has an insignificant effect on delegation to the Commission. The control for the number of major provisions is positively but not significantly associated with the count of provisions that give delegation to the Commission. Our findings, and most importantly the effect of information intensity, are the same if different measures of the Commission’s incentive to deviate and conflict in the Council are applied.Footnote 39
Delegation to Member States
Delegation to member states is purportedly explained by information intensity (Hypothesis 1b), the decision rule (Hypotheses 3b and 6a), conflict in the Council (Hypothesis 4b) and conflict in the Council when the unanimity rule applies (Hypothesis 6b), depending upon the theoretical perspectives as outlined in Table 1. Of these hypotheses, we find evidence for the information intensity hypothesis (1b) from the transaction-costs perspective and for the conditional effect of conflict in the Council (6b) from the consensus-building perspective.
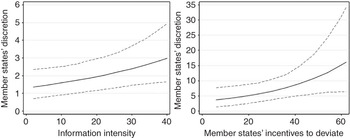
The first hypothesis, from the transaction-costs perspective, is that information intensity is associated with more delegation to member states. In line with this hypothesis, the coefficient associated with information intensity in Model 1 of Table 4 is positive and significant. The expected values reported in Figure 3 provide a better indication of the size of this effect. Controlling for other variables, the expected count of discretionary provisions for member states increases from 1.36 to 2.98 as the information intensity of a law increases from low to high. Although noteworthy, this effect is smaller than the effect of information intensity on delegation to the Commission. In addition, when we examine the subgroups of cases subject to qualified majority voting and unanimity in Models 2 and 3 of Table 4, the effect is not detectable. This may be at least partly due to the smaller number of cases.
Delegation to the Member States

**p < 0.05; ***p < 0.01.
Note: Negative binomial regressions (robust standard errors in parentheses). The likelihood ratio tests that α = 0 are significant (p = 0.00), indicating that the data are over-dispersed.
Expected counts of delegation to member states at different values of information intensity and incentives to deviate. Note: Effects estimated with Model 1 in Table 4 (for information intensity) and Model 3 in Table 4 (for incentives to deviate). We varied information intensity from 2 to 40 recitals and incentives to deviate from 6 to 62, which is from the minimum values to approximately one standard deviation above the means.

The evidence does not support the other two hypotheses from the transaction-costs perspective. We expected that laws decided under the unanimity rule would be associated with less delegation to member states according to the transaction-costs perspective (Hypothesis 3b). This is not the case. Overall, laws decided under the unanimity rule grant somewhat more discretion to member states than laws decided on by qualified majority voting (QMV, see Model 1 of Table 4). However, the difference is not significant. In addition, on the basis of the transaction-costs perspective, we expected that laws that gave rise to more conflict in the Council would be associated with less discretion to member states (Hypothesis 4b). The effect of conflict in the Council is represented by the coefficient associated with this variable in Model 1 of Table 4. The factor change shows that this effect is essentially 0.
By contrast, there is significant evidence to support one of the two hypotheses from the consensus-building perspective on delegation to member states. As mentioned above, we find no evidence that the Council decision rule has an overall significant effect on the amount of discretion granted to member states (Hypothesis 6a). However, we do find that conflict in the Council is significantly and positively associated with the number of discretionary provisions to member states when the unanimity rule applies (Hypothesis 6b). Model 3 in Table 4 is calculated on the basis of the laws subject to the unanimity rule in the Council. The coefficient associated with conflict in the Council in this model is positive and significant. When the unanimity rule applies, conflict in the Council dramatically increases the amount of discretion delegated to member states. Figure 3 shows the expected counts of major provisions that grant discretion to member states at different levels of conflict in the Council when the unanimity rule applies. At the lowest observed value of conflict in the Council under unanimity (6), the expected count is 3.74 provisions. At the average observed value of conflict in the Council under unanimity (35.77), the expected count of its discretionary provisions doubles to 7.63. Approximately one standard deviation above the average level of conflict in the Council (62), the expected count of discretionary provisions is 16.10.
Both of the control variables are associated with significant effects in the expected direction. Directives are associated with significantly more discretion to member states. As with our analyses of discretion to the Commission, the inclusion of a control for directives is crucial for our results. Without it, conflict in the Council still has a positive effect under unanimity, but falls short of statistical significance. Regarding our control for the number of major provisions, laws with more provisions also contain a larger number of discretionary provisions. Our findings, and most importantly the effect of conflict in the Council under unanimity, are similar if different measures of conflict in the Council are applied.Footnote 40
Conclusion
In the midst of contrasting predictions and mixed empirical results from current research on delegation, the present study compared key predictions from three perspectives on delegation to the European Commission and to member states in the EU: the transaction-costs perspective, the commitment perspective and the consensus-building perspective. The predictions of all three perspectives are based on variants of the spatial model of delegation, in which policy makers’ and implementers’ preferences are mapped in a policy space. We tested the predictions with a new dataset of eighty-six EU laws. Because the dataset includes detailed information on actors’ relative policy positions on the controversial issues raised by each law when it was a proposal, we were able to provide a more direct test of the effects of spatial variables than has been possible in previous studies.
Regarding delegation to the European Commission, our findings are more supportive of the transaction-costs perspective than of the competing commitment perspective. The transaction-costs perspective focuses on the information advantage that the Commission enjoys relative to policy makers in the Council and European Parliament.Footnote 41 Particularly on complex, information-intensive policy problems, technical experts in the Commission have more information than policy makers about the effects of alternative policy actions. In line with the transaction-costs perspective, laws that are more complex delegate more discretionary power to the Commission.
However, we find no evidence that actors’ policy preferences affect the amount of discretion delegated to the Commission. Actors’ policy preferences are central to the mechanisms posited in both the transaction-costs perspective and the commitment perspective. On the basis of the transaction-costs perspective, we hypothesized that laws from which the Commission has stronger incentives to deviate would delegate less power to the Commission. We also found no evidence that more conflict in the Council leads to less delegation to the Commission as suggested by Bendor and Meirowitz’s transaction-costs model.Footnote 42
On the basis of the commitment perspective, we hypothesized that laws that evoked more conflict in the Council would delegate more power to the Commission. Our findings, therefore, do not support the claim that the commitment perspective applies to legislation, as Pollack reported on the basis of case studies.Footnote 43 It should be noted that our results do not bear upon the claim made by Majone that the commitment perspective applies to the treaty-based independence of the Commission.Footnote 44
Our findings present a puzzle. While information intensity, the core of the transaction-costs model, positively affects the amount of discretion granted to the Commission, the Commission’s incentive to deviate, which also features prominently in the transaction-costs model, has no effect. The reason for this may lie in the costs of monitoring the Commission’s compliance with the letter and spirit of EU laws. The transaction-costs model assumes that the costs of monitoring compliance are prohibitively high. Monitoring costs are likely to be particularly high when the internal workings of implementing agents are difficult for policy makers to scrutinize. This might not apply to the Commission if the Commission is imbued with member states’ national interests. Indeed, a growing body of scholarship casts doubt on the view that the Commission is independent of national interests. Several studies show how the socialization of career officials in the Commission, the secondment of officials from national administrations and the appointment of Commissioners populate the Commission with individuals whose actions are informed by their national affiliations.Footnote 45
The delegation of discretionary power to member states’ national administrations is a relatively new subject of research. We examined the implications of the transaction-costs perspective and the consensus-building perspective for explaining variation in the amount of discretion granted to member states. According to the consensus-building perspective, it is not analytically evident that delegation to member states follows the logic of transaction-costs models. The key difference is that member states are both principals and agents when they delegate powers to themselves. The consensus-building perspective on delegation to member states is based on Dimitrova and Steunenberg’s model and our recent study of EU compliance.Footnote 46 This perspective conceives of the decision to delegate as an integral part of the bargaining process, and posits that policy makers delegate discretionary power to reach agreement in the Council.
Our findings on delegation to member states lend more credence to the consensus-building perspective than to the transaction-costs perspective. When the Council must adopt a legislative proposal by unanimity, laws that evoked more conflict in the Council delegate more discretionary power to member states. The obvious consequence of this, however, is the continuation of diverse policies in different member states. We find weaker evidence for the transaction-costs perspective. Contrary to one of the hypotheses from the transaction-costs perspective, conflict in the Council does not negatively affect the amount of discretionary power that states are granted. We do, however, find evidence that more complex laws delegate more power to states.
At a more general level, the limitations of the present study suggest three areas for exploration in future research. First, researchers might consider a set of laws that vary more in terms of the levels of controversy they evoked prior to adoption. The laws examined in the present study all evoked some minimum level of controversy. The effect of this is to limit variation in the independent variables that refer to actors’ policy preferences. This means that while the estimates of the effects are unbiased, we have less certainty about the significance of the effects than would be the case with a more inclusive selection procedure. Moreover, we noted that our measures of actors’ policy positions are based on controversies that arose after the legislative proposals were introduced, and therefore after the type of policy instrument had been selected. Nonetheless, there is still ample variation in conflict in the dataset, with many observations where conflict within the Council and the Commission’s incentive to deviate are small.
Secondly, future research could incorporate the role of the European Parliament more extensively. While we did control for the possible effect of EP involvement, we did not extensively examine the impact of possible inter-institutional coalitions between the Commission and the EP on delegation.
Finally, the present study did not test an integrated model of delegation to both the Commission and states’ national administrations. It is likely, however, that these decisions are inter-related. Indeed, we reported a significant negative relation between delegation to the Commission and delegation to member states, exactly as recently predicted by Franchino.Footnote 47 Future studies that refine models of delegation might, therefore, integrate the alternative forms of delegation in the EU, as well as different perspectives on delegation. Our findings suggest that these different perspectives are necessary. While delegation to the Commission is driven partly by the logic of the transaction-costs perspective, delegation to member states is driven more by the logic of consensus-building.