

Introduction
Self-esteem is a term which reflects a person's overall evaluation or appraisal of his/her own worth. It encompasses beliefs, such as ‘I am competent’, ‘I am worthy’, and emotions, such as triumph, despair, pride and shame (Hewitt, Reference Hewitt2009). Accordingly, low self-esteem (LSE) reflects a problem existing at a schema or core belief level, which is dominated by negative self-evaluations (Fennell, Reference Fennell1997).
While there has been some debate about the exact causal relationship between LSE and mental health diagnoses, many studies have identified LSE as a factor in a variety of mental health problems (see McManus et al. Reference McManus, Waite and Shafran2009 for a summary). Research has also shown LSE to be a moderator between psychological work stress and well-being (Makikangas & Kinnuen, Reference Makikangas and Kinnuen2003), to have a negative impact on economic outcomes, such as greater unemployment and lower earnings (Feinstein, Reference Feinstein2000), and to be both a poor prognostic indicator for treatment and a predictor for relapse in depression (McManus et al. Reference McManus, Waite and Shafran2009).
Exploring the causal relationship between self-esteem and specific mental health problems is in effect a discussion of how maladaptive schemas and mental health interact. The very basis of a cognitive understanding of emotional disorders suggests this is a two-way interaction (Beck, Reference Beck1967; Beck, Reference Beck1976). The work of Fennell has significantly influenced the way LSE is conceptualized within a CBT framework (Fennell, Reference Fennell1997, Reference Fennell1998, Reference Fennell1999, Reference Fennell2004), with her transdiagnostic model incorporating both longitudinal elements and idiosyncratic depression and anxiety maintenance cycles. Given that Improving Access to Psychological Therapies (IAPT) services are commissioned to work with common mental health difficulties, such as depression and/or anxiety disorders, understanding how LSE influences treatment gains and outcomes would arguably be beneficial to such services.
There is a significant evidence base for the effectiveness of CBT in treating both depression and anxiety (Robinson et al. Reference Robinson, Berman and Neimeyer1990; Gorey & Cryns, Reference Gorey and Cryns1991; Scogin & McElreath, Reference Scogin and McElreath1994; Gaffan et al. Reference Gaffan, Tsaousis and Kemp-Wheeler1995; Stuart & Bowers, Reference Stuart and Bowers1995; Roth & Fonagy, Reference Roth and Fonagy1996; Gould et al. Reference Gould, Otto and Pollack1997; Department of Health, 2001; Westen & Morrison, Reference Westen and Morrison2001; Whitfield & Williams, Reference Whitfield and Williams2003; Hunot et al. Reference Hunot, Churchill and Silva de Lima2007; Covin et al. Reference Covin, Ouimet, Seeds and Dozois2008). CBT group interventions also have a long-standing evidence base [National Institute for Health and Clinical Excellence (NICE), 2005, 2009, 2010].
However, there is currently a limited, but emerging, evidence base for the effectiveness of CBT in treating LSE. In a single case study of individual therapy McManus et al. (Reference McManus, Waite and Shafran2009) showed large effect sizes on measures of depression, anxiety and self-esteem, which were sustained at 1-year follow up. Waite et al. (Reference Waite, McManus and Shafran2012) have also shown that a course of 16 sessions of CBT improves self-esteem compared to a waiting list control. In terms of group CBT, Rigby & Waite (Reference Rigby and Waite2006) found group therapy was effective at improving self-esteem and reducing depression and anxiety, and Morton et al. (Reference Morton, Roach, Reid and Stewart2011) described a significant increase in self-esteem and a significant decrease in depression and anxiety after completion of a LSE group. However, these studies were limited due to either small sample sizes, single gender samples, or lack of follow-up data. We therefore describe a study evaluating the effectiveness of group CBT for LSE delivered to adults of both genders and with a 3-month follow-up.
Method
Design
This study is an evaluation of group CBT for LSE in a primary care IAPT service. It has a naturalistic design reflecting standard clinical practice within the IAPT service.
Participants
This study was conducted within an IAPT service, which is primarily accessed by GP- or self-referral. It provides both CBT and counselling interventions, and is aimed at individuals aged ≥18 years who are experiencing difficulties with mild to moderate depression and/or anxiety. The participants in this study were referred to the LSE group if they were interested in attending a group and their initial triage assessment indicated that LSE was either their main difficulty or a significant contributor to their mental health difficulties. Participants were also referred after receiving other interventions within the service if they and their clinician believed the group would be of benefit to them.
The final sample consisted of 50 participants, of which 32 were women and 18 were men. Ages ranged from 23 to 70 years (mean = 39.5 years; s.d. = 11.2 years) and 78% were white British, 10% were black or black British, and 10% were classed as other. All participants scored <15 on the Rosenberg Self-Esteem Scale (RSES; Rosenberg, Reference Rosenberg1965, Reference Rosenberg1989) during the first week of the group. Such a score is indicative of LSE. Many participants also had comorbid depression and anxiety difficulties, as predicted by Fennell's model (Fennell, Reference Fennell1997). Participants were excluded if they were currently open to or needed secondary-care mental health services, if their primary difficulty was drug and/or alcohol misuse, or if they were deemed to be at high risk of harming themselves or others. Participants were also excluded if they were undergoing any concurrent individual or group therapy or counselling. These criteria reflect those of the service within which the study was performed. Nine participants were also excluded on the basis that they achieved a score on the RSES which indicated a healthy level of self-esteem during the first week of the group.
Measures
Patient Health Questionnaire (PHQ-9; Spitzer et al. Reference Spitzer, Kroenke and Williams1999)
A self-report, 9-item measure of depression used as a standard questionnaire within IAPT services (National IAPT Programme Team, 2010). The PHQ-9 asks the individual to consider the frequency of each item over the last week on a 4-point scale from ‘not at all’ to ‘nearly every day’. Scores can range from 0 to 27, with 5–9 indicating mild depression, 10–14 indicating moderate depression, 15–19 indicating moderately severe depression, and ≥20 indicating severe depression. A score of ≤9 on the PHQ-9 indicates a below caseness score. The PHQ-9 has been found to possess good reliability, validity and consistency (Kroenke et al. Reference Kroenke, Spitzer and Williams2001) and to be comparable with the Beck Depression Inventory – II (Kung et al. Reference Kung, Alarcon, Williams, Poppe, Moore and Frye2013).
Generalized Anxiety Disorder Measure (GAD-7; Spitzer et al. Reference Spitzer, Kroenke, Williams and Löwe2006)
A self-report, 7-item measure of anxiety used as a standard questionnaire within IAPT services (National IAPT Programme Team, 2010). The GAD-7 asks the individual to consider the frequency of each item over the last week on a 4-point scale from ‘not at all’ to ‘nearly every day’. Scores can range from 0 to 21, with 4–8 indicating mild anxiety, 9–14 indicating moderate anxiety, and ≥15 indicating severe anxiety. A score of ≤7 on the GAD-7 indicates a below caseness score. The GAD-7 has been found to possess good reliability, validity and consistency (Spitzer et al. Reference Spitzer, Kroenke, Williams and Löwe2006).
Rosenberg Self-Esteem Scale (RSES; Rosenberg, Reference Rosenberg1965, Reference Rosenberg1989)
A self-report, 10-item measure of self-esteem. The RSES asks the individuals to consider how much they agree with 10 statements on a 4-point scale from ‘strongly agree’ to ‘strongly disagree’. A score of ≤14 indicates low self-esteem, while a score of ≥15 indicates a healthy level of self-esteem. The RSES has shown good reliability and validity across a range of sample groups (Robinson et al. Reference Robinson, Wrightsman and Andrews1991).
Intervention
The LSE group consists of ten weekly sessions each lasting 1.5 hours. There is a further 1.5 hour follow-up session approximately 3 months after the end of the group. The groups were co-facilitated by both authors and a colleague, all of whom were accredited specialist psychological therapists (CBT) and have postgraduate diplomas in CBT. Clinical supervision was provided by a senior specialist psychological therapist (CBT) within the service. The data for this study was gathered from nine cohorts of the group, five of which had two female co-facilitators (the second author and a colleague) and four of which had mixed gender co-facilitators (the first and second authors). There was a mean of six completers from each group cohort.
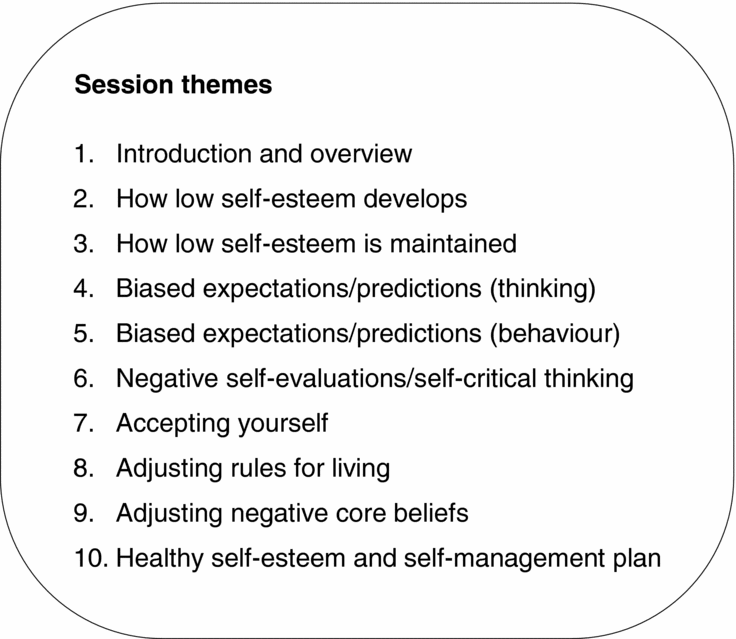
The group is based on Fennell's (Reference Fennell1999) model of LSE and utilizes a number of worksheets devised by the Centre for Clinical Interventions (Lim et al. Reference Lim, Saulsman and Nathan2005). (See Fig. 1 for an overview of themes for the ten sessions.) The group initially aims to increase participants’ understanding and to conceptualize the idiosyncratic development and maintenance of their LSE difficulties. It then focuses on identifying and challenging unhelpful thoughts, behaviours, rules and beliefs, and on increasing self-acceptance. The group also covers the development of a healthy self-esteem model and relapse prevention. Participants are encouraged to explore session themes through group discussion and are expected to complete homework tasks outside of the group sessions to increase awareness and understanding, practice new skills and techniques, and to consolidate learning. Any risk issues which were raised were discussed with participants individually following the group session, and appropriate risk assessment and management procedures were undertaken. Participants were required to complete the standard IAPT questionnaires during every session of the group and during the follow-up session. Participants also completed the RSES at the first and last week of the group and at the follow-up session.
Session themes.

Results
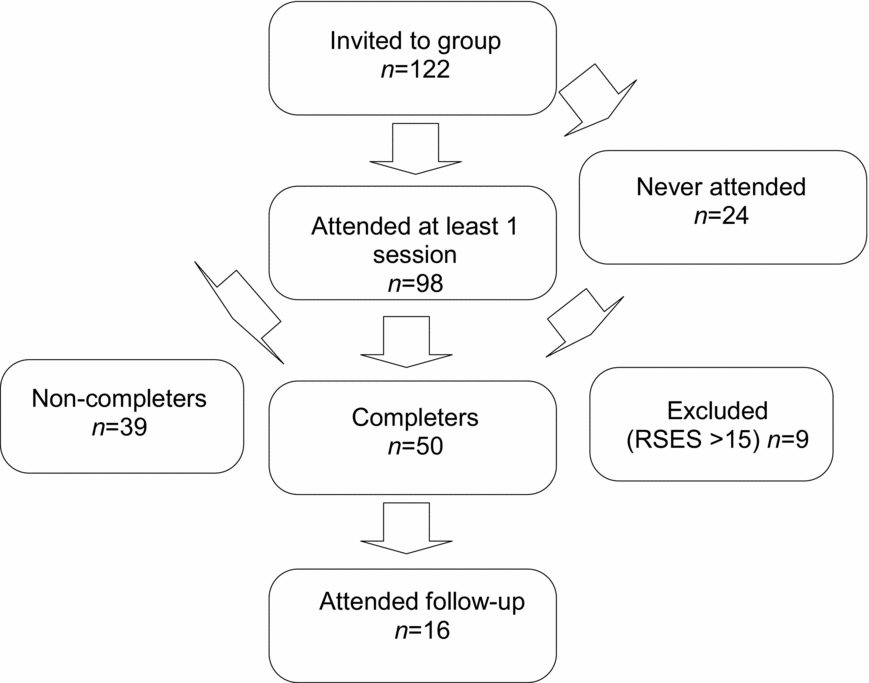
Of the 122 individuals invited to attend the group, 98 attended at least one session (see Fig. 2 for attrition flowchart). As stated above, nine individuals were excluded as their RSES score indicated a healthy level of self-esteem during the first week of the group. Fifty individuals were identified as completing the group. Completers and non-completers did not differ on demographics or initial outcome measure scores, and it was deemed beyond the remit of this article to conduct a more detailed analysis of factors associated with drop out.
Attrition flowchart.
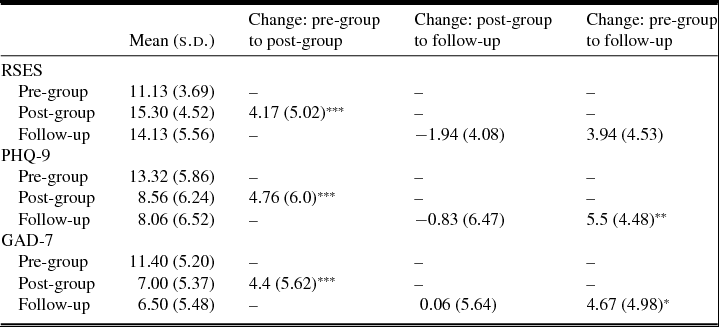
Mann–Whitney U tests were used to analyse changes in self-reported scores on the PHQ-9, GAD-7 and RSES from pre-group to post-group, post-group to follow-up, and pre-group to follow-up (see Table 1). Results indicated that there was a statistically significant and clinically meaningful change across all pre- to post-group measures. Mean post-group measures indicated levels of depression and anxiety which were below caseness and a healthy level of self-esteem. Despite considerable attrition at follow-up, results indicated that gains were maintained at 3-month follow-up.
Means and changes in self-reported scores on outcome measures
RSES, Rosenberg Self-Esteem Scale; PHQ-9, Patient Health Questionnaire; GAD-7, Generalized Anxiety Disorder Measure.
Significant change on Mann–Whitney U test at ***p = 0.0001, **p = 0.016, *p = 0.024.
RSES
The results indicate a clinically and statistically significant improvement between RSES scores at pre-group (mean = 11.13, s.d. = 3.69) and those at post-group (mean = 15.30, s.d. = 4.52) (Mann–Whitney U = 1893, z = −4.43, p = 0.0001, r = 0.63). The difference between post-group and follow-up scores (mean = 14.13, s.d. = 5.56) was not statistically significant (Mann–Whitney U = 102, z = 1.88, p = 0.061, r = 0.44), and neither was the difference between pre-group and follow-up scores (Mann–Whitney U = 195.5, z = −1.04, p = 0.298, r = 0.25).
PHQ-9
The results indicate a clinically and statistically significant improvement between PHQ-9 scores at pre-group (mean = 13.32, s.d. = 5.86) and those at post-group (mean = 8.56, s.d. = 6.24) (Mann–Whitney U = 669, z = 4.0, p = 0.0001, r = 0.57). The difference between post-group and follow-up scores (mean = 8.06, s.d. = 6.52) was not significant (Mann–Whitney U = 166, z = −0.11, p = 0.91, r = 0.03). There was a further clinically and statistically significant improvement between pre-group and follow-up scores (Mann–Whitney U = 85.5, z = 2.4, p = 0.016, r = 0.56).
GAD-7
The results indicate a clinically and statistically significant improvement between GAD-7 scores at pre-group (mean = 11.40, s.d. = 5.20) and those at post-group (mean = 7.00, s.d. = 5.37) (Mann–Whitney U = 675.5, z = 3.96, p = 0.0001, r = 0.56). The difference between post-group and follow-up scores (mean = 6.50, s.d. = 5.48) was not significant (Mann–Whitney U = 155, z = 0.21, p = 0.83, r = 0.05). There was a further clinically and statistically significant improvement between pre-group and follow-up scores (Mann–Whitney U = 90, z = 2.26, p = 0.024, r = 0.53).
Discussion
The results from this study highlight the effectiveness of group CBT for LSE in improving levels of self-esteem, as measured on the RSES, and at reducing levels of depression and anxiety, as measured on the PHQ-9 and GAD-7, respectively. Post-group to follow-up change was not statistically significant demonstrating that these gains were sustained at 3-month follow-up. This adds further support for previous research (Rigby & Waite, Reference Rigby and Waite2006; McManus et al. Reference McManus, Waite and Shafran2009; Morton et al. Reference Morton, Roach, Reid and Stewart2011; Waite et al. Reference Waite, McManus and Shafran2012) showing the effectiveness of CBT for LSE. Rigby & Waite (Reference Rigby and Waite2006), McManus et al. (Reference McManus, Waite and Shafran2009) and Morton et al. (Reference Morton, Roach, Reid and Stewart2011) also highlight the effectiveness of CBT for LSE, in both individual and group formats, at improving comorbid diagnoses, such as depression and anxiety disorders. The results from this study would support these findings and would suggest that such an intervention represents an efficient way of working with such comorbidity.
Previous research focusing on CBT for LSE has considered the mechanisms for change involved in such treatment. For example, Morton et al. (Reference Morton, Roach, Reid and Stewart2011) suggest that the shift in core beliefs is significant, while McManus et al. (Reference McManus, Waite and Shafran2009) postulate that it is the combination of breaking maintenance cycles and core belief/schema work that is important. The anecdotal experience of facilitating group CBT for LSE highlights the value of working on both maintenance and longitudinal elements of clients’ idiosyncratic conceptualizations, and of the benefits of shared experience, validation of emotions, and acceptance (Morton et al. Reference Morton, Roach, Reid and Stewart2011). Client feedback gathered post-group also identified change in these areas as important. Examples of this include; ‘I feel I have learned to challenge some of my thoughts, learning the difference between my low self-esteem and “normal” behaviour’ (maintenance) and ‘challenging my interpretations, life rules, focusing on my achievements and positive attributes/qualities to build self-esteem’ (maintenance and longitudinal). The inclusion of some measures of these aspects and any associated change would be an interesting area for future research. Consideration of comorbid depression and/or anxiety difficulties and medication usage may also help in understanding the mechanisms of change and what factors influence outcomes within this client group.
Addressing some of the limitations of previous research, this sample was a mixed gender sample and included a 3-month follow-up. However, the attrition rate between post-group (n = 50) and follow-up (n = 16) is such that the results from the follow-up session can only be reasonably seen as indicative of trends towards maintaining gains at 3 months. Consideration of alternatives to face-to-face groups to gather follow-up data in future research may compensate for attrition and thus give a clearer indication of the degree to which gains are maintained. Furthermore, although the ethnicity of the group participants broadly reflects the ethnic mix of those seen within the service and the local borough, the majority were white British which limits this study's generalizability to different ethnic populations. The results of this study can also only be generalized to a population of individuals with mild to moderate levels of depression and anxiety. In addition, data regarding socioeconomic status, such as deprivation levels, is not routinely collected with sufficient detail to facilitate an analysis of any potential influence. As the evidence base regarding the efficacy of CBT for LSE becomes more robust, gathering greater information relating to the factors which influence treatment gains and how they are maintained would be beneficial in future research. The authors also acknowledge the inherent biases associated with investigating the effectiveness of a group that they were involved in developing and co-facilitating. Future research may therefore benefit from independent researchers to replicate these findings, and from the inclusion of a control or comparison group. Despite these limitations, it is hoped that highlighting the effectiveness and efficiency of group CBT for LSE will encourage other IAPT services to consider delivering such an intervention.
Summary
LSE is widely acknowledged to be associated with a variety of mental health problems, although there is currently a limited evidence base regarding effective treatment. This study evaluated a 10-week CBT group for LSE and demonstrated the effectiveness of this treatment at improving levels of self-esteem and at reducing levels of depression and anxiety. Despite attrition at follow-up, results indicate a trend towards gains being maintained at 3-month follow-up.
Acknowledgements
The authors thank the clients who attended the low self-esteem group and acknowledge the support and contributions of colleagues, including Elizabeth Brewer, Anthony Davies, Katy Grazebrook, Nancy Hampton, Joachim Ryan (for write-up contributions and as chair of the service's research group), and Chris Spicer.
Declaration of Interest
None.
(1) To increase knowledge regarding the evidence base for the effectiveness of CBT in treating low self-esteem.
(2) To gain an awareness of how CBT groups for low self-esteem could be run in routine clinical practice.
(3) To explore possible mechanisms of change involved in CBT treatment for low self-esteem.
(4) To consider further areas for research and evaluation in this area to make a valued contribution to the existing evidence base.



Comments
No Comments have been published for this article.