Introduction
Kaolin particle film (KF) is one of many sustainable alternatives to face global climate temperature increases (Unigarro et al., Reference Unigarro, Quinchua, Hernandez and Zornosa2023). It is used in conventional crop management and organic agriculture (OMRI, 2022), as short-term strategy for the sustainable alleviation of adverse abiotic stress (Brito et al., Reference Brito, Dinis, Moutinho-Pereira and Correia2019). KF consists mainly of calcined kaolinite, a white, nonporous, nonswelling, and nonabrasive, fine-grained aluminosilicate mineral, which disperses easily in water and is chemically inert in a wide pH range (Glenn et al., Reference Glenn, Puterka, Vanderzwet, Byers and Feldhake1999). Studies with noncalcined kaolin were documented (Abou-Khaled et al., Reference Abou-Khaled, Hagan and Davenport1970), but the advances in nanotechnology from 90s allowed the production of kaolin particles of beneficial size, shapes, chemical, and light-reflective properties, as we know today (Mazzaglia et al., Reference Mazzaglia, Fortunati, Kenny, Torre and Balestra2017).
KF has been widely used to attenuate the deleterious effects of high solar irradiance (Steiman et al., Reference Steiman, Bittenbender and Idol2007) and high temperatures (Abreu et al., Reference Abreu, Roda, Abreu, Bernado, Rodrigues, Campostrini and Rakocevic2022). The combination of high solar irradiance and elevated temperatures causes physiological disorder called sunburn (Abo Ogiela, Reference Abo Ogiela2020), especially due to UV bands (Santos et al., Reference Santos, Lorenzetti, Souza, de Paula and Luz2016). Sunburn is expressed by symptoms of chlorosis (chlorophyll degradation), reduced photosynthesis, stomatal conductance (g s ) and transpiration, and reduced growth and may lead to necrosis and death of the affected plant tissue (Racskó et al., Reference Racskó, Szabó, Nyéki, Soltész and Nagy2010). Some species and varieties show reduced chlorophyll content and g s in acclimation to high-light and temperature stresses, such as Vitis vitifera (Paduá et al., Reference Pádua, Bernardo, Dinis, Correia, Moutinho-Pereira and Sousa2022). The very low chlorophyll (Chl) content decreases leaf absorbance, which, in turn, reduces the potentially damaging heating effect of high solar radiation in droughted plants whose stomata are closed (Havaux and Tardy, Reference Havaux and Tardy1999). Kaolin-treated grapevines show increased Chla/Chlb ratio, displaying some features of high-light adapted leaves (Bernardo et al., Reference Bernardo, Dinis, Luzio, Machado, Vives-Peris, López-Climent, Gomez-Cadenas, Zacarías, Rodrigo, Malheiro, Correia and Moutinho-Pereira2021a). Under stress conditions, the direct estimation of g s and/or transpiration from thermal data is of great interest for plant physiologists (Leinonen et al., Reference Leinonen, Grant, Tagliavia, Chaves and Jones2006). Those methods permit the calculation of index of relative stomatal conductance – Ig, and crop water stress index (CWSI) – (Jones, Reference Jones1999; Kumari et al., Reference Kumari, Lakshmi, Krishna, Patni, Prakash, Bhattacharyya, Singh and Verma2022; Paduá et al., Reference Pádua, Bernardo, Dinis, Correia, Moutinho-Pereira and Sousa2022). In addition, performance indexes of overall photochemistry (PIABS and PItotal), calculated from chlorophyll fluorescence OJIP curves (Strasser et al., Reference Strasser, Tsimilli-Michael, Srivastava and Papageorgiou2004), reflect the state of plant photosynthetic apparatus more accurately than Fv/Fm (Appenroth et al., Reference Appenroth, Stöckel, Srivastava and Strasser2001). Those two indexes are used in estimation of overall photosynthesis responses to stress, being both sensitive to heat and elevated light conditions (Hao et al., Reference Hao, Zhou, Han and Zhai2021). The positive kaolin effect on the PIABS increased in some grape varieties at ripening, indicating varietal acclimatation difference (Bernardo et al., Reference Bernardo, Luzio, Machado, Ferreira, Vives-Peris, Malheiro, Correia, Gómez-Cadenas, Moutinho-Pereira and Dinis2021b).
In coffee crops (Coffea spp.), the saturation light intensity is relatively low, occurring at photosynthetic photon flux density (PPFD) from 300 to 700 µmol photons m−2 s−1 (DaMatta, Reference DaMatta2004; Rodrigues et al., Reference Rodrigues, Machado Filho, Silva, Figueiredo, Ferraz, Ferreira, Bezerra, Abreu, Bernado, Passos, Sousa, Glenn, Ramalho and Campostrini2016) under the current air CO2 concentration (Rakocevic et al., Reference Rakocevic, Batista, Pazianotto, Scholz, Souza, Campostrini and Ramalho2021a). There are no reports of depression of photosynthesis when PPFD is higher than 1200 µmol m−2 s−1 (Ramalho et al., Reference Ramalho, Pons, Groeneveld, Azinheira and Nunes2000). Light intensity above this value reduces the maximum quantum efficiency of photosystem II (PSII) photochemistry, expressed in Fv/Fm (Martins et al., Reference Martins, Galmes, Cavatte, Pereira, Ventrella and DaMatta2014), especially in the Coffea canephora, coffee species sensitive to UV radiation (Bernado et al., Reference Bernado, Rakocevic, Santos, Ruas, Baroni, Abraham, Pireda, Oliveira, Cunha, Ramalho, Campostrini and Rodrigues2021, Reference Bernado, Baroni, Ruas, Santos, de Souza, Passos, Façanha, Ramalho, Campostrini, Rakocevic and Rodrigues2022). From 130 recognized coffee species (Davis, Reference Davis2011; Davis et al., Reference Davis, Chadburn, Moat, O’Sullivan, Hargreaves and Lughadha2019; Davis and Rakotonasolo, Reference Davis and Rakotonasolo2021), the world production mainly depends on two species, Coffea arabica L. (Arabic coffee) and C. canephora Pierre ex A. Froehn (Robusta coffee). The latter is a perennial species of bushy shape, with woody and branched stems, characterized by gametophytic self-incompatibility, which favors allogamy and increases the possibility of genetic variability (Ferrão et al., Reference Ferrão, de Muner, Fonseca and Ferrão2019; Nowak et al., Reference Nowak, Davis, Anthony and Yoder2011; Vázquez et al., Reference Vázquez, López-Fernández, Vieira, Fdez-Riverola, Vieira and Reboiro-Jato2019).
In 2020, the world produced 175.4 million 60 kg bags of processed coffee, with Brazil accounting for approximately 40% of all global production (ICO, 2022), even though it is geographically distant from the African centers of origin of the species (Anthony et al., Reference Anthony, Bertrand, Etienne, Lashermes and Kole2011). C. canephora accounts for 36% of all coffee beans produced in Brazil, with the state of Espírito Santo being responsible for 68% of the Brazilian Robusta coffee (CONAB, 2022a). At least 60% of Coffea spp. crops may be eliminated (Davis et al., Reference Davis, Chadburn, Moat, O’Sullivan, Hargreaves and Lughadha2019), if the increase in global temperature indicated by future projection models is confirmed (Moat et al., Reference Moat, Williams, Baena, Wilkinson, Gole, Challa, Demissew and Davis2017). This will affect the livelihood of millions of families in Latin America, Africa, and Asia (ICO, 2022). In Brazil, the majority of coffee plantations are established under full sunlight conditions (DaMatta et al., Reference DaMatta, Rahn, Läderach, Ghini and Ramalho2019).
Due to continuous increase in product demand, coffee plantations have moved to agricultural zones characterized by supraoptimal temperatures and low water availability. Those factors are negatively affecting leaf and plant physiology (Martinez et al., Reference Martinez, de Souza, Caixeta, de Carvalho and Clemente2020; Rodrigues et al., Reference Rodrigues, Machado Filho, Silva, Figueiredo, Ferraz, Ferreira, Bezerra, Abreu, Bernado, Passos, Sousa, Glenn, Ramalho and Campostrini2016), yield (Cassamo et al., Reference Cassamo, Draper, Romeiras, Marques, Chiulele, Rodrigues, Stalmans, Partelli, Ribeiro-Barros and Ramalho2023; Rakocevic et al., Reference Rakocevic, Scholz, Pazianotto, Matsunaga and Ramalho2023; Venancio et al., Reference Venancio, Filgueiras, Mantovani, Amaral, Cunha, Silva, Althoff, Santos and Cavatte2020), and even the phenological cycle of the coffee plants (Marcolan et al., Reference Marcolan, Ramalho, Mendes, Teixeira, Fernandes, Costa, Vieira Junior, Oliveira, Fernandes and Veneziano2009), or of grapevines (Bernardo et al., Reference Bernardo, Dinis, Machado, Barros, Pitarch-Bielsa, Gómez-Cadenas and Moutinho-Pereira2021c). The complete phenological cycle of coffee tree takes 2 years and is composed of vegetative (first phenological year) and reproductive (second phenological year) phases, six in totality (Camargo and Camargo, Reference Camargo and Camargo2001). After the first harvest, two parallel phenophases (e.g., flower bud induction and vegetative growth) can happen in the branches of one plant, or in neighboring metamers of the same plagiotropic axis (Rakocevic et al., Reference Rakocevic, Matsunaga, Baroni, Campostrini and Costes2021b).
In young plants of two cultivated coffee species, when transferred from the greenhouse to the field, the KF decreases leaf temperature up to 6.7 °C and minimizes damage to the photochemical apparatus, preventing stomatal closure, which allows greater leaf net photosynthesis on area basis, and improves plant acclimatization to high-light and elevated midday temperatures (Abreu et al., Reference Abreu, Roda, Abreu, Bernado, Rodrigues, Campostrini and Rakocevic2022). Those events are more pronounced in young C. canephora than in C. arabica in summer than in autumn.
There is still a gap in knowledge about the effects of KF on the productivity of adult C. canephora plants at the end of a complete phenological cycle. It was hypothesized that greater ecophysiological effects of KF would occur during the summer phenophase of leaf and berry expansion (BE) compared with autumn berry maturation phase, and that those benefits will have impact on bean production and physical quality. The present study analyzed the effects of KF on ecophysiological parameters, bean productivity, and bean size classification in the last phenophases of C. canephora biennial cycle.
Material and Methods
Experimental site and plant description
The field experiment was conducted in Atílio Vivácqua, state of Espírito Santo, Brazil (41º9′54″ W, 20º58′1″ S, 89 m.a.s.l.). The region is characterized as Aw tropical rainy climate with dry winter (Alvares et al., Reference Alvares, Stape, Sentelhas, Gonçalves and Sparovek2013; Seki et al., Reference Seki, Tetto, Tres and Vieira2021).
Six clones of Coffea canephora propagated from cuttings were planted in 2014 in an experimental field of 19 500 m2, in arrangement of 3 m between rows and 1 m between the plants in the row, totaling 3,333 plants ha−1. Clones were selected from four cultivars: ‘Andina’ – clone ‘P1’, ‘Tributun’ – clone A1, ‘Vitória 8142’ – clones V2 and V8, and ‘Monte Pascoal’ – clones Lb1 and P2 (Partelli et al., 2019, 2020, Reference Partelli, Covre, Oliosi and Covre2021a). Only the clone ‘P1’ was measured in this experiment due to its phenotype uniformity. Pruning of all plants was carried out to control the plant shape, maintaining a pattern of ca. 10 000 orthotropic axes ha−1.
The soil under the experiment was determined as red-yellow latosol (EMBRAPA, 2013). To schedule fertilization, soil was collected for physicochemical analyses before the planting, and posteriorly, 2 years after planting (Supplementary Material, Table S1). Per planting hole, 100 g of CaCO3, 30 g of MgCO3, 300 g of CaSO4, 50 g of P, 5 g of H3BO3, 10 g of ZnSO4, 5 g of CuSO4, and 10 g of FeSO4 were used. In the first year, 50 g of CH4N2O and 30 g of K were used per plant, which changed to 100 g of CH4N2O and 60 g of KCl in the second year, and to 200 g of CH4N2O, 50 g of P, 120 g of KCl, 5 g of H3BO3, 10 g of ZnSO4, 5 g of CuSO4, 10 g of MnSO4, and 10 g of FeSO4 in the third year. Fertilization always took place during the greatest coffee plant’s demands, in October, December, and February (Prezotti et al., Reference Prezotti, Oliveira, Gomes and Dadalto2013). The coffee cultivation increased the soil pH, diminished saturated Al, increased the organic matter, and clay participation for only 2 years of cultivation (Table S1). Throughout the experiment, soil moisture was maintained close to field capacity of this soil type, with use of drip irrigation equipped with microsprinklers. The available water capacity (CAD) considering the soil layer from 0 to 20 cm (z = 200 mm) was 15.125 mm. Irrigation intensity was calculated based on the Hargreaves–Samani method, for reference evapotranspiration estimation (Nóia Júnior et al., Reference Nóia Júnior, Fraisse, Cerbaro, Karrei and Guindin2019).
Fine calcined kaolin-based particle film (KF) applications throughout the phenological coffee calendar
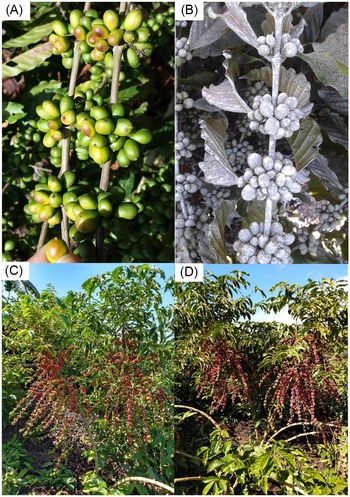
The KF used in experiment was produced from calcinate purified kaolin (Surround® WP; TK Inc., Phoenix, AZ., USA), enriched with a low abrasive compound of aluminum silicate (Al4Si4O10(OH)8), which is chemically inert (Glenn et al., Reference Glenn, Cooley, Walker, Clingeleffer and Shellie2010). It was mixed in the proportion of 2.5 kg to 100 L of water. During the biennial coffee phenological cycle, eight applications, each of 10 kg of KF ha−1 (400 L ha−1 of the mixture), were carried out in an adult conilon coffee orchard to ensure good coverage of leaves and berries, in 2016 and 2017 (Table 1, blue flashes). A total of 40 plants received KF (Fig. 1B, 1D), randomly distributed in experimental field in five plots, each plot with eight plants. They were compared with 40 plants cultivated without KF applications, termed ‘green leaf’ (GL) plants, distributed in other 10 plots over the experimental field (Fig. 1A, 1C). All 10 plots were used for productivity measurements, while the central 4–6 plants of each plot for ecophysiological observations.
Phenological calendar of Coffea canephora with indication of actions done during the period of the experiment

Legend: VG = vegetative growth; RG = reproductive growth; green flashes indicate the transition from winter to spring and the transition from summer to autumn; blue flashes indicate the moments of kaolin film applications; red flashes indicate the moments of harvest; yellow flash indicates the moment of pruning of plagiotropic branches that previously produced berries. The ecophysiological evaluations occurred in berry expansion (BE) and berry ripening (BR) phenophases.
Illustration of kaolin film (KF) impacts on Coffea canephora: (A) Plagiotropic branch not protected with KF (scald on berries, damaged by excess solar radiation) during leaf and berry expansion and (B) berries protected with KF. (C) Whole coffee plants during berry ripening (BR), 15 days before a harvest, previously not protected with KF and (D) protected with KF.

KF applications occurred in December, January, February, and March (rainy period), as indicated by the blue arrows (Table 1). In this period, the phyllochron (time between the emission of two successive metamers) in coffee is about 15 days (Rakocevic and Matsunaga, Reference Rakocevic and Matsunaga2018), requiring a reapplication of KF to protect newly emitted leaves and to renew the protection film on older ones. Additionally, in grapevines, even in the rainy season, KF persisted on leaves and fruits for more than 30 days (Valentini et al., Reference Valentini, Pastore, Allegro, Muzzi, Seghetti and Filippetti2021).
The KF applications were situated in the biennial phenological cycle of the coffee trees. The coffee phenology was first defined for C. arabica (Camargo and Camargo, Reference Camargo and Camargo2001; Pezzopane et al., Reference Pezzopane, Pedro Júnior, Thomaziello and Camargo2003) and here adapted for C. canephora (Marcolan et al., Reference Marcolan, Ramalho, Mendes, Teixeira, Fernandes, Costa, Vieira Junior, Oliveira, Fernandes and Veneziano2009). In the first phenological year, 1) cell multiplication and leaf expansion (October–February) is followed by the 2) induction and maturation of flower buds (April–August). In the second phenological year, 3) the anthesis (September–October) is followed by 4) leaf and BE (November–March), 5) berry ripening (BR) (April–June), and 6) rest and senescence of the highest order axes (Table 1). During the rest phase of C. canephora, branches that have already produced 75% or more of the flower buds are removed naturally or using pruning (Ferrão et al., Reference Ferrão, de Muner, Fonseca and Ferrão2019).
Environmental and ecophysiological measurements
Environmental variables, such as PPFD (µmol m–2 s–1), air temperature (Tair, ºC), relative air humidity (RH, %), and rainfalls (mm), were obtained from https://portal.inmet.gov.br/dadoshistoricos for the period from coffee planting (2014) to the harvest analyzed in this paper (2017). The midday daily values were selected, and the average midday values for PPFD, Tair, and RH of every month were presented, together with a monthly sum of rainfalls.
Ecophysiological measurements were performed in three periods: 1) rainy January, corresponding to BE phenophase, 2) end of rainy period–March (BE phenophase), and 3) April, beginning of dry period, corresponding to BR phenophase, all performed between 12 a.m. and 2 p.m.
For thermographic measurements, three fully expanded leaves in the upper third layer of the experimental coffee plant were used. A leaf was moistened with water 1 min before image recording, to reduce the leaf temperature caused by evaporation of water from the leaf surface, representing Twet. On the second leaf, the Vaseline was applied on its abaxial face (stomata are presented only at the abaxial leaf surface in coffee) 30 min before the image was registered, to attain the maximum leaf temperature, because of transpiration blockage, representing Tdry. No intervention was made on the third leaf so that it represented the reference leaf temperature (Tleaf). Thermal images were obtained with a Flir i50 mid-wave infrared camera (Flir Systems, Billerica, MA, USA) with camera emissivity set to 0.96. With a focal plane array detector, images with a resolution of 140 × 140 pixels (19 600 pixels) were produced with an accuracy of ± 2%. During measurements, the equipment was approximately 0.50 m above the measured leaves. The captured images were stored in the equipment’s memory, and all image processing and analysis were undertaken in Flir Tools software (version 5.2.15161) in the temperature range of 20–50 °C. Thermographic images were treated with the iron palette, using a circle, to calculate Tdry, Twet, and Tleaf, which were used to calculate the CWSI (Idso et al., Reference Idso, Jackson, Pinter, Reginato and Hatfield1981; Jones, Reference Jones, Sánchez-Moreiras and Reigosa2018). It relates the reference temperature to the minimum (nonstressed) and maximum (nontranspiring) temperatures of a reference crop under similar environmental conditions, using Eq. (1):
 $${\rm{CWSI}} = {{{{\rm{T}}_{{\rm{leaf}}}} - \;{{\rm{T}}_{{\rm{wet}}}}} \over {{{\rm{T}}_{{\rm{dry}}}} - \;{{\rm{T}}_{{\rm{wet}}}}}}$$
The thermal index of relative stomatal conductance (Ig) was calculated according to Jones (Reference Jones, Sánchez-Moreiras and Reigosa2018), using Eq. (2):
 $${{\rm{I}}_{\rm{g}}} = {{{{\rm{T}}_{{\rm{dry}}}} - \;{{\rm{T}}_{{\rm{leaf}}}}} \over {{{\rm{T}}_{{\rm{leaf}}}} - \;{{\rm{T}}_{{\rm{wet}}}}}}$$
In each evaluation period, thermographic measurements were performed at four central plants of each plot.
The green color intensity of the leaves was estimated using a Soil Plant Analyzer (SPAD-502 model of Portable Chlorophyll Meter, Minolta, Tokyo, Japan), which generates the dimensionless values, on a scale from 1 to 100. For each leaf, three measurements were performed, using their average for further calculations. To avoid distorted values, the particle film was removed from the leaf surface during the measurements. In each evaluation period, measurements were performed for two leaves of five central plants of each plot.
Chlorophyll a fluorescence measurements were performed on the same dates used for thermography, at midday (12 a.m.–2 p.m.), using a nonmodulated fluorimeter model Pocket PEA (Plant Efficiency Analyzer, Hansatech, King’s Lynn, Norfolk, UK. Leaves were previously dark-adapted for about 30 min, using Hansatech leaf clips. This premeasure ensures that all reaction centers of PSII acquired an ‘open’ status, and heat loss is minimalized (Strasser et al., Reference Strasser, Srivastava and Tsimilli-Michael2000). Thereafter, the dark-adapted leaf parts were exposed to saturating irradiance of red light (650 nm, 3,500 µmol m–2 s–1) to obtain the fast chlorophyll a fluorescence transient of PSII, usually used to detect the stress impact affecting photosynthetic processes (Oukarroum et al., Reference Oukarroum, Schansker and Strasser2009). Subsequently, the collected data were submitted to the JIP test (Strasser et al., Reference Strasser, Tsimilli-Michael, Srivastava and Papageorgiou2004). Some variables generated by the JIP test were used, such as the Fv/Fm and PIABS (Strasser et al., Reference Strasser, Tsimilli-Michael, Srivastava and Papageorgiou2004). In each evaluation period, measurements were performed at two leaves of six central plants of each plot.
Coffee bean productivity and physical traits
The harvests were conducted in June (Table 1). In the first harvest year (2016), the coffee production was usually low (Rakocevic et al., Reference Rakocevic, Scholz, Pazianotto, Matsunaga and Ramalho2023), so only the production of the second harvest year was analyzed (2017). The harvest was carried out by removing the ripe berries (visually red) from the coffee trees. Harvested coffee berries are processed to separate the skin, pulp, and mucilage from beans, using dry or wet processing (Kitzberger et al., Reference Kitzberger, Pot, Marraccini, Pereira and Scholz2020). The dry processing was applied in our study. It is the cheapest form of coffee cherries transformation into green beans, accounting for more than 80% of Arabica coffee from Yemen, 60% of Arabica coffee from Brazil and Ethiopia, and almost all Robusta varieties (Poltronieri and Rossi, Reference Poltronieri and Rossi2016).
Harvested berries were immediately weighed (fresh mass, FM), and then dried on cement yard for 12 days (dry processing) until reaching ∼12% of water content and then weighed again (dry mass, DM). Samples of 2 kg of dry berries (per plot) were used for further evaluation. Their endocarp, mesocarp, and pericarp were removed, obtaining commercially processed bean mass (BM). The ratio (FM-DM)*100/FM informs the initial berry moisture, while the BM * 100/FM (BM performance) informs how many percent of FM effectively became a commercial product (Rakocevic et al., Reference Rakocevic, Scholz, Pazianotto, Matsunaga and Ramalho2023). Ripe berries were harvested from all eight plants from each plot.
After the preliminary processing, the samples of 300 g of BM from each plot were passed through perforated metal plates with different diameters. The size of coffee beans is classified according to the grain rail where they were retained. Sieve sizes vary from 8 to 20, on the scale of 1/64 inch (Núñez Rodríguez et al., Reference Núñez Rodríguez, Carvajal Rodríguez and Mendoza Ferreira2021). Sieve 18 means 18/64-inch holes, measuring 7.1 mm, and similarly, sieve 16 means 6.3 mm.
Shortly after harvest, the plagiotropic branches of the lower third of the C. canephora were removed. Plants of this species, when left to grow freely, reduce leaf area with the increase in the total DM of the plant, which could not adequately supply the demand of the plant, thus decreasing the vitality and, consequently, the productivity of the culture (Ronchi and DaMatta, Reference Ronchi, DaMatta, Ferrão, Fonseca, Bragança, Ferrão and De Muner2007). Pruning in C. canephora should be done after the harvest and before the flowering of the next year’s crop (Morais et al., Reference Morais, Cavatte, Medina, Silva, Martins, Volpi, Junior, Machado Filho, Ronchi and DaMatta2012).
Statistical analyses
Analyses of period of measurements (January, March, and April) and KF (KF compared with GL) application effects were performed using the two-way mixed effects linear model (lme), with plant (for infrared thermography, n= 20), or leaf (for chlorophyll fluorescence and SPAD index, n = 50 and 60, respectively) as repetitions. If no significant interaction was found, the model reduction was applied and fitted. The analyses of applied KF effects on FM, DM, and BM productivity, initial berry moisture, DM and BM performances, and bean size participation were performed using the two-way mixed effects linear model (lme) with plots as repetitions (n = 5). All data were previously evaluated for homogeneity of variance between treatments by Bartlett’s test (Snedecor and Cochran, 1983). The R Core (2022) software was used with the help of the packages ‘nlme’, ‘emmeans’, ‘multcompView’, and ‘multcomp’. Data are shown in figures as estimated mean ± estimated standard error, with the increment or decrease of KF in relation to GL values, represented by Δ (%).
Results
Environmental and ecophysiological responses to kaolin throughout the coffee phenology
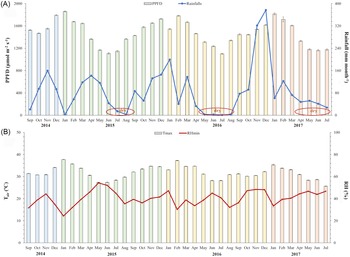
The dry winter period appears every year (Fig. 1A). During the period of ecophysiological observations (January–April 2017), the average value of midday PPFD was ca. 1820 and 1610 μmol m−2 s−1 in January and March 2017, respectively – summer rainy period during BE and was reduced to ca. 1330 μmol m−2 s−1 in April 2017, at the beginning of the dry period, during BR (Fig. 2A). The average midday Tair was 35.3ºC and 33.8 ºC in January and March 2017, respectively (BE) and decreased to 33.0ºC in April (BR) – (Fig. 2B). In the period of ecophysiological measurements, the average midday RH was 33.4, 40.4, and 44.4% in January, March, and April 2017, respectively.
Environmental data for the period from coffee plantation (2014) to the harvest (2017): (A) Average ± SE of month midday photosynthetic photon flux density (PPFD) and a sum of month rainfalls – dry winter periods are highlighted in red oval forms; (B) Average ± SE of month midday air temperature (Tair) and of relative humidity (RH).

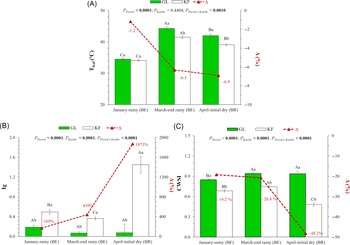
The midday leaf temperature (Tleaf) on the day of measurements was the highest in March (BE, summer rainy period), lower in April (B, autumn, beginning of dry period), and the lowest in January (BE, summer rainy period) – (Fig. 3A). In January, the KF application did not have any effect on Tleaf, while in March and April, the reduction was 2.8ºC and 2.9ºC, or 6.3% and 6.9%, respectively.
Thermography of C. canephora: (A) leaf temperature (Tleaf), (B) thermal index of relative stomatal conductance (Ig), and (C) crop water stress index (CWSI). The measurements taken in rainy January and March coincided with the berry expansion (BE) phenophase, and those taken in April (initial of dry season) coincided with the berry ripening (BR) phenophase. Means ± SE followed by different uppercase letters indicate statistical differences among periods of observation, while by different lowercase letters statistically different values between treatments with (KF) and without (GL) kaolin film. ANOVA p-values marked in bold indicate statistical differences (n = 20). Δ (%), dashed, red lines, and the accompanying numbers indicate the increase or decrease of KF values compared with GL treatment.

The Ig of plants cultivated under the conventional management (GL) did not vary in three periods of measurement, while the plants treated with KF showed the lowest Ig values in hot March, followed by January, and the highest in April (Fig. 3B). The increase of Ig with KF was significant in all three periods, ranging 169%, 439%, and 1873% for January, March, and April, respectively, indicating that this treatment induced more open stomata at midday, probably permitting higher CO2 assimilation when compared with GL treatment.
Under the conventional cultivation (GL), the CWSI was the lowest in January, not differing between March and April, while the CSWI under the KF treatment was the highest in March, lower in January, and the lowest in April (Fig. 3C). KF treatment reduced the stress index in all three periods. The CWSI of the GL plants was 0.848, 0.939 and 0.935, and 0.939 and 0.932, in January, March, and April, respectively, showing the greatest reduction in stress index in plants with KF during BR (initial dry season), of 48%, when compared with ca. 20% in rainy season.
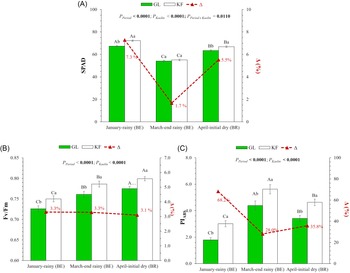
Relative chlorophyll content (SPAD values) was the highest in January, lower in April, and the lowest in the hot March (Fig. 4A). The KF treatment increased SPAD values compared to GL leaves by 7.3% and 5.5% in January and April, respectively, while no significant difference was observed in hot March. Plants treated with KF showed SPAD values of up to 72, while GL plants did not exceed value of 67.
Chlorophyll content and fluorescence of C. canephora: (A) relative chlorophyll index (SPAD), (B) maximum quantum yield of photosystem II (Fv/Fm), and (C) performance index of overall photochemistry (PIABS). The measurements taken in rainy January and March coincided with the berry expansion (BE) phenophase, and those taken in April (initial of dry season) coincided with the berry ripening (BR) phenophase. Means ± SE followed by different uppercase letters indicate statistical differences among periods of observation, while by different lowercase letters statistically different values between treatments with (KF) and without (GL) kaolin film. ANOVA p-values marked in bold indicate statistical differences (n = 50 or 60). Δ (%), dashed, red lines and the accompanying numbers indicate the increase or decrease of KF values compared with GL treatment.

The Fv/Fm was highest in April, followed by March, and the lowest in January (Fig. 4B). Treatment with KF prevented damage to the photosynthetic apparatus, keeping Fv/Fm above 0.75, and this effect was significant for all three observed periods, increasing the Fv/Fm by ca. 3%. In leaves of GL plants, the Fv/Fm values dropped to 0.73 during BE in January, indicating damage to the photosynthetic apparatus.
PIABS, which represents the state of plant photosynthetic apparatus, had the highest values in March, followed by April, and the lowest in January (Fig. 4C). The PIABS values were significantly higher in plants treated with KF than in GL ones, in all observed periods, indicating that KF contributed to better plant performance. The greatest difference between the two treatments occurred during BE in January and March (the rainy season), with about 68% higher PIABS in KF than GL plants, dropping to 28% in hot and humid March, and to 36% in April (beginning of dry season).
Responses of productivity and bean size to kaolin application
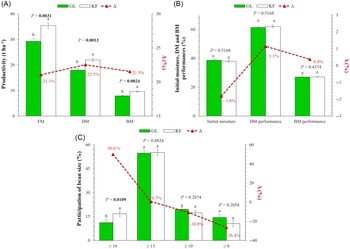
Plots treated with KF produced ca. 35 t ha−1 of FM, 22 t ha−1 of DM, and 9.6 t ha−1 of BM, significantly greater than the GL treatment, where the production was ca. 29 t ha−1 of FM, 18 t ha−1 of DM, and 7.9 t ha−1 of BM (Fig. 5A).
Coffea canephora berry and bean productivity and physical traits: (A) fresh berry mass (FM), dry berry mass (DM), and bean mass (BM), (B) BM mass performance, and (C) size distribution of beans in production by sieve size. Means ± SE followed by different lowercase letters indicate statistically different values between treatments with (KF) and without (GL) kaolin particle film. ANOVA p-values marked in bold indicate statistical differences (n = 5). Δ (%), dashed, red lines, and the accompanying numbers indicate the increase or decrease of KF values compared with GL treatment.

The initial berry moisture was ca. 38%, not differing between the two treatments (Fig. 5B), indicating similar maturity between treated and not treated plants. DM and BM performances were 62% and 27%, not differing between KF and GL plots (Fig. 5B), indicating similar ratios of dry berry biomass and commercially useful bean biomass.
Large bean distribution (ø 16) was increased by 50% by the KF compared to GL treatment (Fig. 5C). In the KF treatment, 16.8% of processed beans were retained on sieve ø 16 (>6.35 mm), 55.2% on sieve ø 13 (>5.17 mm), 17.4% on sieve ø 10 (>3.97 mm), and 10.6% on sieve ø 8 (>3.18 mm). In GL treatment, 11.2% of beans were retained on sieve ø 16, 54.8% were retained on sieve ø 13, 19.5% were retained on sieve ø 10, and 14.4% were retained on sieve ø 8.
Discussion
This work demonstrated temporal dynamics in responses of field-grown adult plants of C. canephora to KF applications. The highest positive impact of KF on Ig and CWSI was observed in the BR phase (April, in the beginning of dry period), positive effect on relative chlorophyll content in January and April, while the chlorophyll a fluorescence was proportionally similar among the three observed periods. A second finding of this work was the increased production of the most desirable large beans (>ø 16) and an increased total productivity related to KF applications. These results supported our hypothesis that greater ecophysiological effects of KF would occur in the summer phenophase of leaf and BE when compared with the autumn BR phase. Also, in young Coffea plants, the highest KF efficiency is observed in the summer period (Abreu et al., Reference Abreu, Roda, Abreu, Bernado, Rodrigues, Campostrini and Rakocevic2022), while the responses of adult plants to KF seemed to be predominantly controlled by their reproductive phenology.
Ecophysiological responses to Kaolin throughout the coffee phenology
The positive ecophysiological and productive responses of C. canephora to applied KF can be related to reduction of deleterious impact of high-light conditions measured at midday in all observed periods, characterized by PPFD >1200 μmol m−2 s−1 (Fig. 2A), which are above the saturation light intensity in coffee species (Ramalho et al., Reference Ramalho, Pons, Groeneveld, Azinheira and Nunes2000; Rakocevic et al., Reference Rakocevic, Batista, Pazianotto, Scholz, Souza, Campostrini and Ramalho2021a), resulting in reduced Tleaf (Fig. 3A). In C. arabica, the leaf surface temperatures after exposure to 45 °C for 72 and 96 h are 44.0 and 46.3 °C, respectively (Yamane et al., Reference Yamane, Nishikawa, Hirooka, Narita, Kobayashi, Kakiuchi, Iwaib and Iijima2022). Thus, a tolerance threshold in leaves of C. arabica under heat stress is likely between 44.0 and 46.3 °C. The application of kaolin creates a white color film on the plant organ surfaces, increasing albedo of leaves and fruits (Shellie and King, Reference Shellie and King2013) and causing a reduction of Tleaf and CWSI (Fig. 3A, 3C). By reducing Tleaf (in the case of adult C. canephora for ca. 3 °C – Fig. 3A), metabolism becomes more stable, diminishing the weakening of chemical bonds, protein denaturation, and overproduction of reactive oxygen species (Wahid et al., Reference Wahid, Gelani, Ashraf and Foolad2007). Additionally, decreased CWSI values are strongly correlated with greater leaf water potential (Costa et al., Reference Costa, Coelho, Barros, Fraga Junior and Fernandes2020). The elevated leaf water content in plants treated with KF was confirmed by the increased Ig values (Fig. 3C). These results indicated more open stomata and higher photosynthetic functioning expressed by PIABS in KF than in GL plants (Fig. 4C). These cumulative effects support the increased berry and bean productivity over the final phenophases (Fig. 5A).
The observed low Chl concentration (SPAD) in leaves of GL plants (Fig. 4A) is a characteristic sign of oxidative stress (Smirnoff, Reference Smirnoff1993) that could be a consequence of higher Chl degradation, or of Chl synthesis reduction with changes in thylakoid membrane composition (Brito et al. Reference Brito, Costa, Fonseca and Santos2003). As the Chl plays crucial role in photosynthesis, our results indicate some degrees of injury of this important molecule biosynthesis/degradation in leaves of plants not treated with kaolin. Additionally, in plants treated with KF, the average SPAD value was 68, higher in BE and BR, in relation to GL plants (Fig. 4A). In mature leaves of young C. canephora, the SPAD value attains ca. 45 (Bernado et al., Reference Bernado, Baroni, Ruas, Santos, de Souza, Passos, Façanha, Ramalho, Campostrini, Rakocevic and Rodrigues2022) and can attain 75 (Putra and Soni, Reference Putra and Soni2018), varying due to genetic characteristics or leaf nitrogen content, where higher SPAD values indicate higher leaf nitrogen content (Netto et al., Reference Netto, Campostrini, de Oliveira and Bressan-Smith2005). Leaf nitrogen was not measured in the current study. It is documented that leaf N participates in metabolic pathways that mitigate the deleterious effects of light stress on the photosynthetic apparatus and, in adequate concentrations, can prevent plant death (DaMatta et al., Reference DaMatta, Loos, Silva and Loureiro2002; Nunes et al., Reference Nunes, Ramalho and Dias1993). So, the higher SPAD values with KF treatment compared to GL suggested that KF could positively affect the leaf nitrogen concentration, suggesting increased photosynthetic activity (together with CWSI and PIABS indices), especially during BE and BR phenophases.
In C. canephora under conventional cultivation, even under high summer temperatures, values of Fv/Fm are expected to be approximately 0.8, followed by PIABS values of 4.2 (Rodrigues et al., Reference Rodrigues, Silva, Ferreira, Filho, Figueiredo, Ferraz, Bernado, Bezerra, Abreu, Cespom, Ramalho and Campostrini2018). With KF treatment, PIABS of this species increased by 56% in the summer, during BR, reaching mean values of 6.3 (Fig. 4C). The Fv/Fm represents the maximum efficiency at which light absorbed by PSII is converted to chemical energy (Baker et al., Reference Baker, Harbinson and Kramer2007). Values of this variable around 0.75–0.85 show that a probability of 75 to 85% of the energy of an absorbed photon will reduce the Quinone A molecule, indicating adequate PSII activity (Strasser, Reference Strasser1997). The accumulation of active PSII reaction centers in grapevine is associated with decreased susceptibility to photoinhibition in the kaolin-treated plants and with more efficient photochemical quenching (Dinis et al., Reference Dinis, Ferreira, Pinto, Bernardo, Correia and Moutinho-Pereira2016), similar response that could be related to our results (Fig. 4B and 4C).
A decrease in both the solar irradiance and temperature, and an increase in the air relative humidity, is obtained at all seasons under well-planned agroforestry cultivation of C. canephora, with good yield potential (Oliosi et al., Reference Oliosi, Giles, Rodrigues, Ramalho and Partelli2016). The opposite strategy, opening tree plantations for coffee agroforestry, results in additional income-generating opportunities for rural communities, provides wider ecosystem service benefits, and reduces pressure for land-use change (Fitch et al., Reference Fitch, Rowe, McNamara, Prayogo, Ishaq, Prasetyo, Mitchell, Oakley and Jones2022). The adoption of agroforestry systems with 50% shade cover can reduce the mean temperatures and maintain 75 % of the area suitable for coffee production in 2050, especially between 600 and 800 m altitude (Gomes et al., Reference Gomes, Bianchi, Cardoso, Fernandes, Fernandes Filho and Schulte2020). Our experiment was managed in MO, where the application of KF was shown as a solution for intensive C. canephora growing and production under the full sun (Figs. 1–5). Treatment with KF is also shown efficient during the transfer of young plants from nursery to the field (Abreu et al., Reference Abreu, Roda, Abreu, Bernado, Rodrigues, Campostrini and Rakocevic2022), but it does not have the properties sufficient to avoid the elevated seedling mortality in nurseries in full sun (Unigarro et al., Reference Unigarro, Quinchua, Hernandez and Zornosa2023). So, the KF applications in coffee culture must be adapted to plant species, age, phenophases, cultivation, and environmental conditions.
Environmental and ecophysiological responses to kaolin particle film treatment throughout the coffee phenology
The ‘P1’ genotype produced 9.6 t BM ha−1 when treated with KF and 7.9 t BM ha−1 when maintained under conventional management, in the second harvest after planting (Fig. 5A). Other works with the ‘P1’ genotype plants of the same age show a production of 4.7 t BM ha−1 at 850 m altitude (Martins et al., Reference Martins, Partelli, Golynski, Pimentel, Ferreira, Bernardes, Ribeiro-Barros and Ramalho2019; Partelli et al., Reference Partelli, Golynski, Ferreira, Martins, Mauri, Ramalho and Vieira2019). This difference in productivity may be related to the difference in altitude (here 89 m), and the applied irrigation system. At both altitudes and management systems, the ‘P1’ genotype produced above the national average for the conilon coffee crop, which in 2022 was 2.8 t BM ha−1 of (CONAB, 2022b), while the cultivation system with KF produced 6.8 t ha−1 BM more than the national average.
The KF treatment produced 1.7 t BM ha−1 more than the GL treatment (Fig. 5A), due to a cascade effect, where lowering Tleaf reduced CWSI and increased Ig, and PIABS, increasing and guaranteeing the maintenance of Fv/Fm above 75% of PSII efficiency. The better functioning of the photochemical machinery, in turn, contributed to higher SPAD values, which indicates better use, or maintenance of leaf nitrogen. Nitrogen serves as a constituent of many components of the plant cell, such as amino acids, proteins, and nucleic acids, in addition to being part of the constitution of chlorophyll molecules. Therefore, nitrogen deficiency and protein degradation by excess solar radiation inhibit plant growth (DaMatta and Ramalho, Reference DaMatta and Ramalho2006) and consequently cause a reduction in the productive potential. The greater accumulation of dry matter in coffee berries, mainly in the endosperm, affects coffee productivity, indicating that genotypes with higher BM accumulated also more biomass in the berries (Partelli et al., Reference Partelli, Oliosi, Dalazen, Silva, Vieira and Espindula2021b). The thermal mitigation and gains in ecophysiological parameters given to the coffee tree with KF application ensured an increase in the growth of larger beans, with an increase of 50% in beans of size 16/64 inch (Fig. 5C). GL coffee plants produced more 8 sieve beans (14.4%) than 16 sieve ones (11.2%), suggesting their lower individual BM accumulation per bean than KF, thus reducing the whole productivity per ha compared with KF treatment. Similarly, KF treatment increases the grapevine berry size, which reduces the skin-to-pulp weight ratio (Luzio et al., Reference Luzio, Bernardo, Correia, Moutinho-Pereira and Dinis2021). These treatment effects reduced risks inherent to coffee production, where the application of 40 kg of KF ha−1 year−1 required an investment of 240 US$ (∼ 220 €) and brought a return of 3,195 US$ (∼2925 €).
Conclusions
In adult plants, improved ecophysiological effects of KF occurred during the autumn BR phenophase than in summer leaf area and BE phenophase, contrary to the original hypothesis, as compared to seasonal responses of young coffee plants. This suggested that the responses of adult plants to KF were predominantly controlled by their reproductive phenology due to the positive KF impact on bean productivity and physical quality, supporting the second hypothesis. The KF treatment produced 1.7 t BM ha−1 more than the GL treatment, due to a cascade effect, where lowering Tleaf reduced CWSI and increased Ig, and PIABS, increasing and maintaining the chlorophyll SPAD index and chlorophyll a fluorescence parameters at adequate levels for the full development of the plant, with emphasis on maintaining Fv/Fm above 0.75 and increasing PIABS efficiency. The application of kaolin at 40 kg ha−1 distributed four times per year was highly effective as a protection strategy against high-light and elevated Tair. In future experiments, various KF doses distributed in variable number of applications can be investigated, to increase, even more, the management effectiveness in coffee crops.
Supplementary material
The supplementary material for this article can be found at https://doi.org/10.1017/S001447972300011X
Data availability statement
Publicly available datasets were analyzed in this study. The authors can provide the experimental data for all interested researchers.
Author contributions
Deivisson Pelegrino de Abreu: Investigation, data curation, software, and writing original draft; Newton de Matos Roda: Funding acquisition and conceptualization; Cesar Abel Krohling: Investigation; Eliemar Campostrini: Conceptualization, definition, and validation; Miroslava Rakocevic: Methodology, validation, reviewing, and editing. All authors have read and agreed with the actual version of the manuscript.
Financial support
The research work was carried out with the support of Fundação Carlos Chagas Filho de Amparo à Pesquisa do Estado do Rio de Janeiro (FAPERJ), by grants E-26/210.037/2020 and E-26/200.957/2022. The authors acknowledge the CNPq fellowships awarded to MR (PV, 350509/2020-4) and to EC (PQ, 303166/2019-3).
Competing interests
The authors declare no conflict of interest.