The Cold War saw the rapid development and deployment of nuclear weapons. To expedite its nuclear weapons program, the United States began conducting experimental atmospheric nuclear tests at the Nevada Test Site (NTS) in 1951. This policy decision created tremendous amounts of harmful radioactive material, and much of this material rained across the continental United States. Environmental factors often have direct effects on economic activity and public welfare. Governments are often responsible for the policies that ensure the provision of environmental goods. However, atmospheric nuclear testing provides a historical example where policy decisions had detrimental and unintended effects on the environment and public welfare. The U.S. nuclear weapons program has fueled much controversy over the years, and there is substantial narrative and medical research studying the consequences of these activities for the regions surrounding the NTS. In this article, I expand the scope of the analysis to regions hundreds to thousands of miles from the NTS and study whether fallout from nuclear testing had direct effects on the U.S. agricultural economy.
Domestic atmospheric nuclear testing in the 1950s led to a unique intersection between government policy, pollution, and disaster. Nuclear testing possesses many characteristics of a natural disaster. Each test was a controlled catastrophic event that irradiated surrounding material, drew radioactive debris high into the atmosphere, and unwittingly exposed people, crops, and livestock to this harmful material. One estimate places the total atmospheric release of radioactive material from the NTS at 12 billion curies between 1951 and 1963. This is roughly equivalent to having one Chernobyl disaster a month over 13 years. The average atmospheric test at the NTS released more than 100 million curies of material.Footnote 1 In comparison, the partial nuclear meltdown at Chernobyl released approximately 81 million curies of radioactive material into the atmosphere (LeBaron Reference LeBaron1998). Economists often study historic episodes of natural disaster to better understand how economic agents respond to catastrophic events and the costs of these disruptions. For example, Fabian Lange, Alan L. Olmstead, Paul W. Rhode (Reference Lange, Olmstead and Rhode2009) studied how farmers acted in anticipation of the boll weevil. Leah Boustan, Matthew E. Kahn, and Rhode (Reference Boustan, Kahn and Rhode2012) study responses to flooding and tornadoes, Richard Hornbeck (Reference Hornbeck2012) measures the long-run adaptive responses populations made in response to the Dust Bowl, and Hoyt Bleakley and Sok Chul Hong (Reference Bleakley and Hong2017) measure how economic responses to temperature have evolved over many decades. Economic historians also explore how policy decisions made decades ago can have unintended environmental and social consequences. For example, Werner Troesken (Reference Troesken2008) and Karen Clay, Troesken, and Michael Haines (Reference Clay, Troesken and Haines2014) show that idiosyncratic adoption of lead water pipes had long-term negative effects for public welfare.
The medical and scientific research studying the unintended effects of the NTS activities and their social costs has focused primarily upon persons living in the region surrounding the test site in Nevada, Arizona, and Utah. This region is generally termed “Downwind” in the historical and popular literature. Researchers studying populations living in these areas have linked increases in thyroid cancer and leukemia to the NTS activities (Stevens et al. Reference Stevens, Thomas and Lyon1990; Kerber et al. Reference Kerber, Till and Simon1993; Gilbert et al. Reference Gilbert, Huang and Bouville2010). Furthermore, the experimental literature suggests that fallout from nuclear testing would have adversely affected agriculture (Bustad et al. Reference Bustad, George and Marks1957; Garner Reference Garner1963; Sparrow, Schwemmer, and Bottino Reference Sparrow, Schwemmer and Bottino1971). To test whether the NTS fallout adversely affected U.S. agriculture and to measure the geographic scale of the effects, I develop an annual county-level panel measuring fallout deposition from records obtained from the National Cancer Institute (1997). From these records, I exploit plausibly exogenous within county-level variation in radioactive fallout deposition across years to measure the effects nuclear testing had on U.S. agriculture. This methodology allows me to measure to what extent the NTS activities affected domestic agricultural production.
This article also adds to a small but growing economics literature using variation in radioactive pollution as a source of exogenous variation. Douglas Almond, Lena Edlund, and Mårten Palme (Reference Almond, Edlund and Palme2009) and Sandra Black et al. (Reference Black, Bütikofer and Devereux2017) use low doses of ionizing radiation to test the fetal origins hypothesis in Scandinavian populations. Research by Hartmut Lehmann and Jonathan Wadsworth (Reference Lehmann and Wadsworth2011) and Alexander Danzer and Natalia Danzer (Reference Danzer and Danzer2016) measure the effects of the Chernobyl disaster in the Ukraine on self-reported measures of wellbeing. More recent studies by Daiji Kawaguchi and Norifumi Yukutake (Reference Kawaguchi and Yukutake2017) and Nobuyuki Ito and Koichi Kuriyama (Reference Ito and Kuriyama2017) have explored how perceptions of the Fukashima nuclear disaster have been internalized in land values and consumer behavior. Through examining both the United States and agricultural production, this article tests whether radioactive pollutants can directly affect the economy and provides a broader historical account of the social costs of the Cold War.
HISTORICAL AND SCIENTIFIC BACKGROUND
History of U.S. Nuclear Testing
The Atomic Age began in the predawn hours of 15 July 1945 over the sands of the American Southwest. Researchers hoisted a bomb at the top of a tower at the Alamogordo Bombing Range, New Mexico and detonated the first man made nuclear weapon dubbed Trinity (Fehner and Gosling Reference Fehner and Gosling2012). This test was the first of hundreds conducted by the U.S. government and the first of many such weapons successfully tested in the American Southwest. With the Trinity test arose the dangers of radioactive fallout. Fission from bomb tests released tremendous energies that can irradiate surrounding material.Footnote 2 This irradiation creates unstable elements, and as this material decays it releases charged particles. These charged particles are called ionizing radiation and can cause harm to biological tissue and DNA at the atomic level.
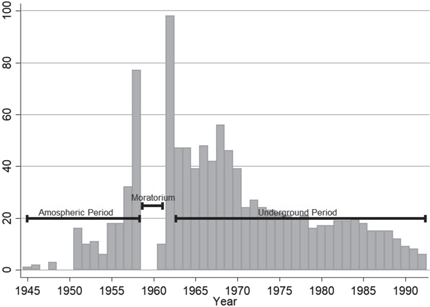
During the Cold War, governments worldwide detonated more than 2,000 nuclear weapons. Of these tests, the U.S. government was responsible for 1,054 nuclear tests. From 1945 to 1992, the United States conducted 210 atmospheric tests, 5 underwater tests, and 839 underground atomic tests. These nuclear tests occurred primarily at Pacific atolls and at the NTS. The atmospheric testing period lasted from 1945 to 1963. A brief pause in atmospheric testing occurred from 1958 to 1961 as a nuclear testing moratorium between the United States and the U.S.S.R. suspended atmospheric testing. A small period of atmospheric testing resumed after the U.S.S.R. broke the moratorium in 1961 with the largest bomb test in history, the Tsar Bomba (roughly equivalent to 50 megatons of TNT). At the NTS, four small atmospheric tests with a cumulative yield of less than two kilotons were detonated in 1962. After the Partial Nuclear Test Ban Treaty was signed and ratified in 1963, the United States ended atmospheric nuclear testing. All subsequent U.S. nuclear tests from 1963 to 1992 were conducted underground with the majority, 828, occurring at the NTS just northwest of Las Vegas, Nevada (U.S. Department of Energy 2000; Fehner and Gosling Reference Fehner and Gosling2006). This article focuses on the largest atmospheric test series conducted by the United States at the NTS from 1951 to 1958.Footnote 3
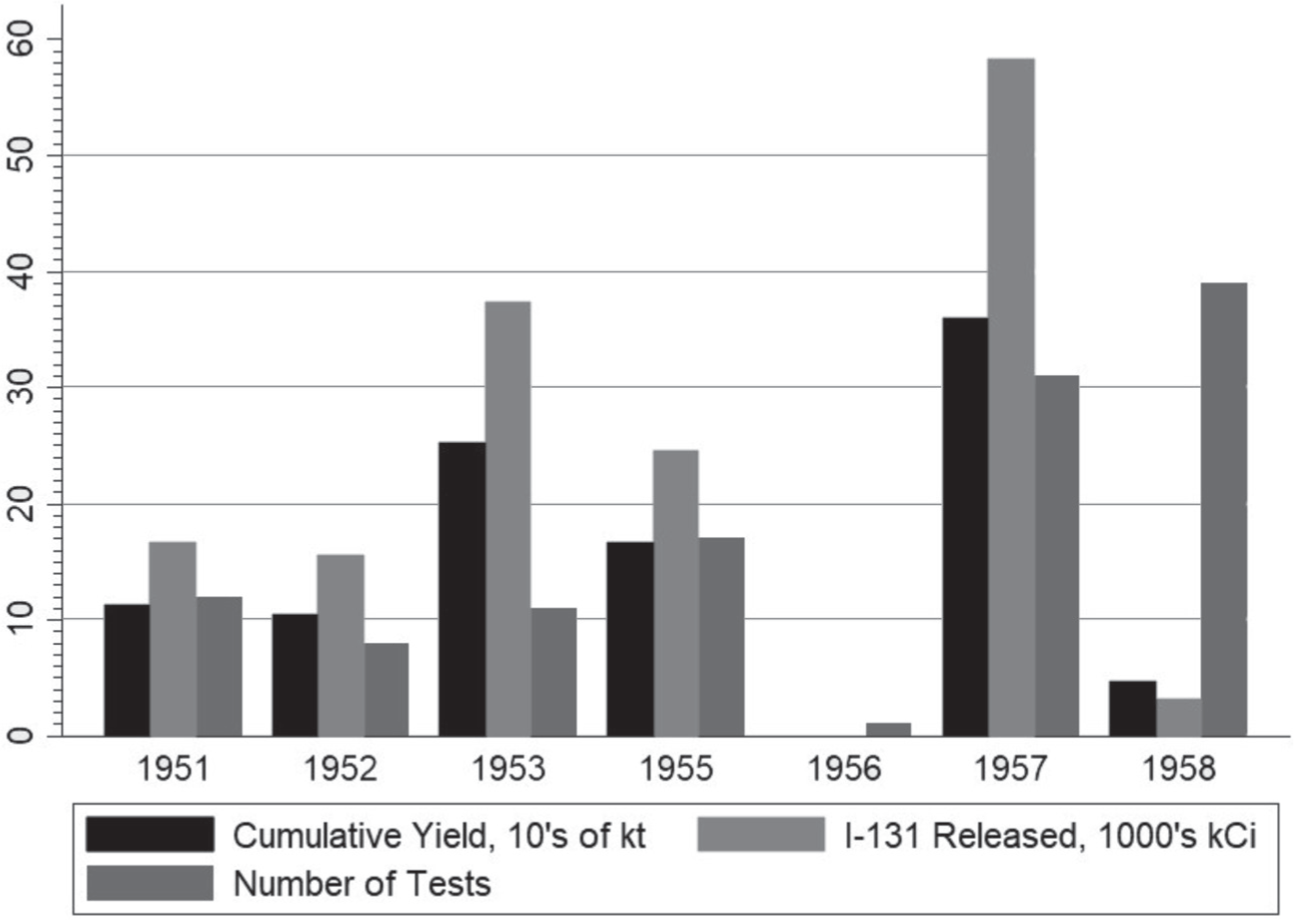
Figure 1 illustrates the number of U.S. nuclear tests conducted in each year during the three major time periods. A total of 828 underground blasts and 100 above-ground detonations occurred at the NTS (U.S. Department of Energy 2000).Footnote 4 While generally smaller in magnitude than the tests performed in the Pacific, atmospheric tests performed in Nevada were extremely polluting and created enormous quantities of radioactive fallout. Figure 2 describes these tests, their size, and relative “dirtiness” (measured as the amount of radioactive iodine-131 (I-131) released in 1,000’s of kilocuries). Much of this irradiated material generated by desert testing was carried high into the atmosphere and precipitated down with rainfall across the United States, east of the test site.
NUMBER OF U.S. NUCLEAR TESTS

ANNUAL CUMULATIVE YIELDS, ATMOSPHERIC I-131 RELEASES, AND NUMBER OF TESTS FOR THE NTS, 1951–1958

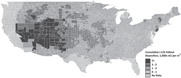
Figure 3 reports the cumulative amount of iodine-131 (a radioactive pollutant harmful to public health created by nuclear testing) that deposited across U.S. counties from the NTS tests.Footnote 5 The West Coast is upwind of the NTS and was relatively unexposed; regions surrounding the NTS would experience radioactive dust blown by low altitude winds. Test operators accounted for meteorological conditions within a few hundred kilometers of the test site when picking the test dates and would delay tests if meteorological conditions were not favorable. Work by the National Cancer Institute (1997) suggests that much of the radioactive fallout generated from nuclear testing was collected by rainfall through a process called scavenging and landed across areas of the United States east of the “Downwind” region.
TOTAL I-131 FALLOUT DEPOSITION BY COUNTY, 1951–1958

Prior to the NTS testing, all nuclear tests (apart from the 1945 Trinity Test) were carried out in the Pacific. Conducting nuclear testing presented significant logistical and security challenges for the United States due to their distance and isolated nature. Testing in the Pacific required the forced relocation of native inhabitants, the climate conditions were unfavorable to equipment, and weather exacerbated local fallout risks. A taskforce to identify the feasibility of continental nuclear testing and potential test sites, codenamed Project Nutmeg, started work in 1947. Policymakers identified potential testing locations in Nevada, Utah, New Mexico, and on islands off the coast of North Carolina. Policymakers were initially hesitant about the prospects of testing nuclear weapons on the North American continent and advised against continental testing barring a “national emergency.”
Nevertheless, policymakers during the period of testing generally thought that radioactive fallout from atmospheric testing posed little threat to public health or the economy. The individual tasked with identifying potential sites for continental nuclear testing in 1949, Navy Captain Howard B. Hutchinson, is quoted to have said that continental atmospheric nuclear tests would not cause “physical or economic detriment to the population, the economy nor the industry of the nation” (Fehner and Gosling Reference Fehner and Gosling2000, p. 40). In fact, many AEC researchers hypothesized economic benefits in using ionizing radiation in agriculture, and researchers thought that radioactive fertilizers and pesticides could promote plant growth (Oatsvall Reference Oatsvall2014). These positive predictions, however, did not materialize in experimental research.
Opinions regarding continental nuclear testing quickly changed as several global events altered leaders’ political calculus. On 29 August 1949, the Soviet Union shocked the world by detonating its first nuclear weapon and threatening American atomic hegemony. This caused military and civilian leaders to expand the U.S. nuclear weapons program. The onset of the Korean War during the summer of 1950 exacerbated this geopolitical situation and raised security concerns regarding the Pacific tests (Fehner and Gosling Reference Fehner and Gosling2000, Reference Fehner and Gosling2006). These two forces led leaders to conclude that continental testing was necessary for national defense, and so the Las Vegas Gunnery and Bombing Range was expanded and converted into the NTS.
The Science of Radiation Exposure
During the period of atmospheric testing and the decades following, the public generally did not know the extent to which it was exposed to radioactive material generated from the NTS tests. Even scientists were debating whether low doses of radioactive fallout were harmful and how much was entering the food supply. During the period of testing, academic researchers and persons in the medical field noticed that radioactive iodine-131 started to appear in animal and human thyroids and connected these results with the timing and incidence of domestic nuclear tests (Van Middlesworth Reference Van Middlesworth1956; Beierwaltes et al. Reference Beierwaltes, Crane and Wegst1960). Other researchers found that long-lived strontium-90 was absorbed by wheat hundreds to thousands of miles from the test site (Kulp and Slakter Reference Kulp and Slakter1958; Rivera Reference Rivera1961; Olson Reference Olson1962). The Public Health Service (PHS) and Atomic Energy Commission (AEC) at the time corroborated these findings but expressed doubt regarding the risks posed by these levels of radiation (Flemming Reference Flemming1959, Reference Flemming1960; Wolff Reference Wolff1957, Reference Wolff1959). Comprehensive studies measuring the extent to which American populations were exposed to the NTS fallout began in the 1980s when Congress mandated that the Department of Health and Human Services study the issue (National Cancer Institute 1997; Centers for Disease Control 2006).Footnote 6
Atmospheric detonations conducted near the surface of the earth irradiated thousands of tons of soil. This material was then drawn up with the mushroom cloud many kilometers into the atmosphere. A portion of the radioactive material was intercepted by low altitude winds and deposited in the surrounding area as radioactive dust. Most of the material, however, was carried higher up and intercepted by high altitude winds. In the days following a test, areas outside of the “Downwind” region experienced radioactive fallout only if it happened to be raining while the radiation cloud was over head. The agricultural regions studied in this article would only experience the NTS fallout exposure through rainfall. As such, radioactive fallout from nuclear testing can be treated as a plausibly exogenous event that would be uncorrelated with unmeasured aspects of farm production.
After radiation was dispersed across agricultural fields, plants absorbed radioactive material and animals consumed contaminated pasture. This radiation then might have caused sickness in animals. Anecdotal and legal evidence suggests that nuclear test fallout harmed ranchers and farm animals living near the NTS. Note that this region is closer to the test site than the areas examined in this article and the exposure mechanism differed because radioactive material was carried through low altitude winds and not necessarily delivered through precipitation. In 1955 and 1956, ranchers in Iron County, Utah sued the U.S. Government and AEC asserting that their animals had died because of radioactive fallout from 1953 tests at the NTS. The ranchers claimed that these animals fell ill after consuming irradiated pasture in northern Nevada. In Bulloch v. United States, Judge Sherman Christensen ruled that the U.S. government and thus nuclear testing was not at fault (Seegmiller Reference Seegmiller1998).
In 1979, the U.S. Committee on Interstate and Foreign Commerce (1980) in the U.S. House of Representatives opened a hearing into reported incidents of animal deaths from radiation poisoning because of the 1953 test series. The report discussed the fact that thousands of sheep and lambs belonging to the Iron County farmers died during the spring and summer of 1953. Around 12.1 percent of lambing ewes and 25.4 percent of new lambs died that spring (or were stillborn). The report also details independent veterinary assessments identifying radiation poisoning and birth defects in the animals and the subsequent government cover up conducted by both the AEC and PHS. Following these revelations, Judge Sherman Christensen claimed that government lawyers and federal employees had been “intentionally false or deceptive” and that the government had enacted a “species of fraud” upon the public. He ultimately vacated his 1956 decision in 1979. Ranchers again sued the government and won settlements. The Tenth Circuit Court of Appeals overturned this ruling stating that Congressional testimony was inadmissible as evidence and the Supreme Court declined to hear the appeal in 1986 (Seegmiller Reference Seegmiller1998, pp. 146–47).
Further corroborating the narrative of the Utah ranchers, General Electric scientists L.K. Bustad et al. (Reference Bustad, George and Marks1957) ran experiments on the biological and health effects of radioactive I-131 in sheep. Starting in 1950, they fed groups of sheep varying daily doses of I-131 from .005 nanocuries per square meter (nCi) to 1,800 nCi and followed the effects across years and generations. Starting at 15 nCi animals showed growth retardation and deformities, thyroid damage, reduced fertility, trouble nursing, motor difficulty, and patchy skin/balding. At higher doses researchers found that ewes that were impregnated failed to give birth to viable offspring. A comprehensive survey of the literature on the toxicity of radioactive isotopes by R. J. Garner (Reference Garner1963) suggests that radioactive toxicity is greater in sheep than cattle and that relatively low amounts of exposure reduced offspring viability, increased difficulty nursing, and stunted growth.
Radiation can hamper seedling development, weaken resilience, and cause plant sterility. Studies into how gamma and beta radiation exposure alter plant growth suggest that ionizing radiation hampers seed germination, growth, and reproduction (De Micco et al. Reference De Micco, Arena and Pignalosa2011). Arnold Sparrow et al. (Reference Sparrow, Schwemmer and Bottino1971) summarize experimental results measuring the effect of different levels of radiation on crop survival and yields. They found that large radiation doses can lead to diminished yields depending on the time crops are exposed.Footnote 7 According to Sparrow et al. (Reference Sparrow, Schwemmer and Bottino1971), winter wheat is particularly susceptible to harm. Irradiated winter wheat in field trials failed to survive winter hibernation. This evidence suggests that exposure to radioactive material reduces wheat’s cold tolerance. Furthermore, winter wheat is planted in the fall and is harvested in late summer. This long growing period means that the crop could have had prolonged exposure to ionizing radiation. Most of the nuclear tests examined in this article were conducted in March and April and, thus, radiation landed on fields when winter wheat was most vulnerable.
EMPIRICAL METHODOLOGY AND DATA
Annual County Panel Regression Model
To test whether atmospheric nuclear testing at the NTS had adverse effects on U.S. agriculture, I estimate a series of panel regressions with multiple lags of fallout deposition. These econometric models identify the effect of radioactive fallout on agricultural production. Equation (1) represents the full specification of the regressions employed in measuring how fallout from nuclear tests altered agricultural productivity.
 $${\rm{in(}}{y_{it}}{\rm{)}} = {\beta _0}{D_{it}} + {\beta _1}{D_{it - 1}} + {\beta _2}{D_{it - 2,t - 5}} + {\beta _3}{D_{it - 6,t - 10}} + {\gamma _t}{{\bf{\it{X}}}_i} + {{\bf{\it{W}}}_{it}}\theta + {\alpha _i} + {\varepsilon _{it}}$$
Yit denotes the outcome of interest such as the bushels produced per acre planted in county i at time t, acres harvested, and livestock numbers. I use yield per acre planted because farmers may have opted to harvest only productive acreage in the event of sporadic crop damage. While farmers might not be able to observe the cause of damage to their crops, they could observe poor performance and decreased yields. The use of yield per acre harvested could understate the true magnitude of a negative productivity shock, because it would not capture the losses associated with the acreage that was planted but not harvested.
The main variable of interest is Dit. This variable measures the total I-131 deposition in county i in year t, as thousands of nCi per square meter. It is a proxy for total radioactive fallout exposure resulting from each nuclear test series. To determine potential longer-term effects, I include a lag for Dit– 1 and average deposition for testing in prior years. To capture potential longer-run effects of fallout shocks, I pool average deposition two to five years prior and six to ten years prior. Pooling these lags reduces a profusion of coefficients.Footnote 8 While most radioactive material would decay in the months after the test, longer-lived isotopes might persist in the environment. Researchers found radioactive material in wheat after testing ceased (Flemming Reference Flemming1960; Ichikawa, Abe, and Eto Reference Ichikawa, Abe and Eto1961; Olson Reference Olson1962). M. A. Dreicer et al. (Reference Dreicer, Aarkog and Alexakhin1996) assess the Chernobyl disaster ten years after the event. They find radioactive material affected plants and crops mostly in the two years following the partial meltdown, but also report that crops could absorb radioactive material for many more decades.
Wit denotes a vector of commodity-specific monthly precipitation levels and monthly temperature averages for county i in years t. Year fixed effects and county fixed effects are represented by γt and αi, respectively. These fixed effects control for annual shocks that are common across counties and time invariant county-specific characteristics. Following the methods used in Hornbeck (Reference Hornbeck2012), I interact time fixed effects with a series of control variables, Xi, that account for county characteristics in 1945. These interactions flexibly control for underlying county factors that might affect annual production decisions. The controls include the share of cropland used as pasture, share of farmland as cropland, log number of farms, log agricultural land value per acre, log average farm size, percent of the labor force employed in agriculture, and population density per square mile.Footnote 9 The variable ɛit denotes the heteroskedastic error term which is not observed by the researcher. To correct for potential county-specific heteroskedasticy, errors are clustered at the county-level.Footnote 10
The county-level panel data come from multiple sources. Annual agricultural data are obtained from the National Agricultural Service’s Quick Stats program (National Agricultural Statistics Service 2015). Additional county-level control variables come from Michael Haines (Reference Haines2010) and Michael Haines, Price Fishback, and Paul Rhode (Reference Haines, Fishback and Rhode2015). Monthly temperature average and precipitation measures come from Jay H. Lawrimore et al. (Reference Lawrimore, Menne and Gleason2011). Radioactive fallout deposition measures come from the National Cancer Institute (1997) and are described in more detail later.Footnote 11
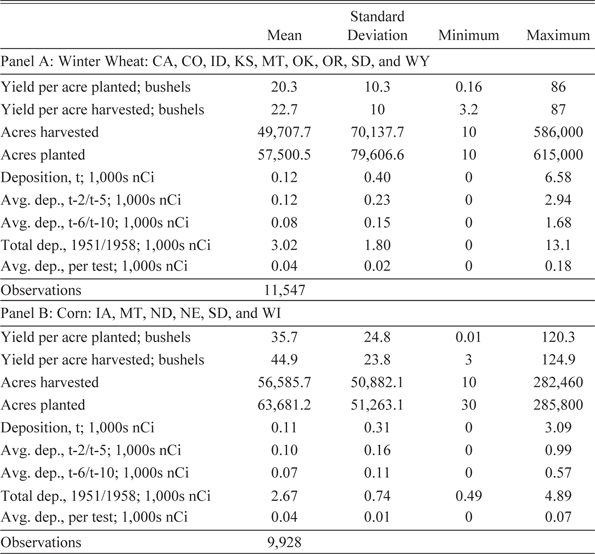
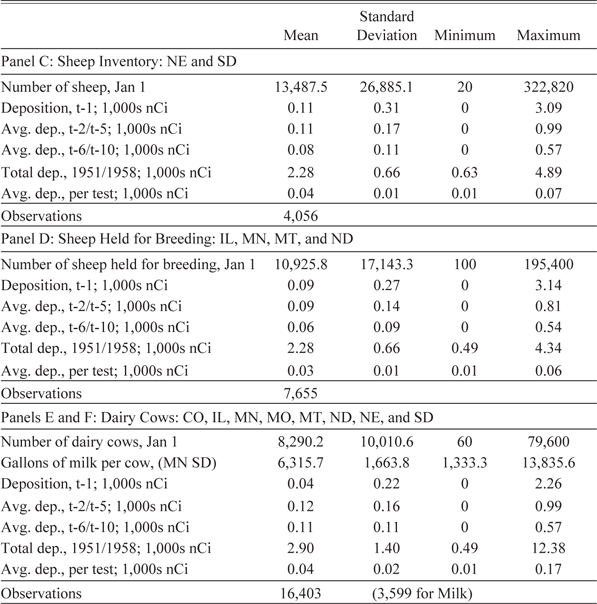
The samples include years from 1945 to 1970. All counties included in the sample were observed in the period before the testing and during the testing, 1945 to 1958. This balancing ensures that the sample includes only counties that have data from before and during the period of NTS atmospheric nuclear testing. Balancing the panel from 1945 to 1970 removes Wisconsin from the corn producing sample and Wyoming from the wheat producing sample. This is because Wisconsin stopped reporting acres planted for corn in 1968 and Wyoming did not report wheat production data for 1963.Footnote 12 Summary statistics for crops are in Table 1. Summary statistics for livestock are in Table 2.
SUMMARY STATISTICS FOR EACH CROPS SAMPLE

Notes: Agricultural production records are from the National Agricultural Statistics Service’s Quick Stats program. Radioactive fallout deposition measures are from the National Cancer Institute. All samples include counties that report data continuously from 1945 to 1958. Deposition denotes the estimated amount of radioactive I-131 per m2 depositing in a given county. Total deposition is cumulative deposition in a given county for all years. Radioactive fallout is reported for 73 atmospheric tests and this number is used to calculate per test depositions. Some atmospheric tests did not properly detonate, did not result in contamination outside of the NTS boundaries, or were conventional detonations conducted as safety tests.
Source: Author’s tabulation.
SUMMARY STATISTICS FOR LIVESTOCK SAMPLES

Notes: Agricultural production records are from the National Agricultural Statistics Service’s Quick Stats program. Radioactive fallout deposition measures are from the National Cancer Institute. All samples include counties that report data continuously from 1945 to 1958. Deposition denotes the estimated amount of radioactive I-131 per m2 depositing in each county. Total deposition is cumulative deposition in each county for all years. Radioactive fallout is reported for 73 atmospheric tests and this number is used to calculate per test depositions. Some atmospheric tests did not properly detonate, did not result in contamination outside of the NTS boundaries, or were conventional detonations conducted as safety tests.
Source: Author’s tabulation.
The main treatment variables of interest are annual and lagged county-level fallout deposition measures are from the National Cancer Institute (1997). These measures are reported as thousands of nCi of I-131 deposited per m 2 in each year. The U.S. Congress in 1983 authorized the Secretary of Health and Human Services to investigate and measure human exposure to ionizing radiation resulting from above-ground nuclear tests. The National Cancer Institute undertook the task of gathering radiation measurements from historical records and estimating exposure from tests conducted at the NTS. In 1997, the National Cancer Institute released a report titled the “Estimated Exposures and Thyroid Doses Received by the American People from Iodine-131 in Fallout Following Nevada Atmospheric Nuclear Bomb Tests.” The radiation exposure measures employed here come from the I-131 deposition measures produced for the report.
Radiation monitors collected information on radioactive fallout deposition for all tests from 1951 to 1970 with the exceptions of three tests in the Ranger series in 1951 and six underground tests with accidental atmospheric releases of radioactive materials from 1962 to 1970 (a total of 100 atmospheric releases occurred at the NTS). I use measures from 1951 to 1958 as these are the only tests that resulted in detectable depositions in my sample.Footnote 13 These county-level estimates are reported in terms of nCi. Much of the raw data came from national monitoring stations.Footnote 14 The military also engaged in air monitoring and used city-county stations around the NTS to track the radiation cloud (National Cancer Institute 1997). This raw information allowed researchers to track the position of the radiation cloud over time and understand how much radiation precipitated down under differing meteorological conditions.
The National Cancer Institute applied an interpolation technique called kriging to estimate the amount of radioactive fallout that deposited in each county for each test. Kriging is a statistical technique often used to interpolate data between monitoring stations and is commonly used in estimating local weather conditions. With observational data from radiation monitoring stations and from the test site, the National Cancer Institute knew approximately how much radioactive material was in the atmosphere for each test, the position of the radiation cloud as it transited across the United States, and how much radioactive material would be scavenged given meteorological conditions. Accounting for these factors, the researchers assumed that radioactive material high in the atmosphere would only reach the ground if it was scavenged by rainfall and used a much denser rain gauge network to interpolate fallout deposition between monitoring stations.
I use within-county variation in fallout patterns across years to identify the causal effect of fallout on agricultural production. In the most restrictive model specification, I use changes in fallout deposition across time within counties while controlling for time trends in agricultural productivity and county-specific weather conditions. There are a few potential challenges to this identification strategy. There is the possibility that the radiation measures were correlated with local weather patterns. Most of the fallout deposition resulting from the tests came down as wet precipitate. This means that radiation would have come down in a region if it was both raining and the radiation cloud was overhead. To control for any potential correlations with weather patterns I included monthly temperature averages and monthly precipitation totals specific to each crop’s growing season window. For corn it is April to September. For winter wheat, it is the previous September until the subsequent August.
Another challenge could be measurement error in the deposition measure. My fallout treatment variable is only positive during test years, but global fallout from nuclear testing in the U.S.S.R. and Pacific could have led to more fallout deposition in the United States. This global fallout was much smaller in magnitude and diffuse relative to the NTS fallout. If global fallout were an issue it would introduce attenuation bias and bias the treatment effect of the deposition variable towards zero. Furthermore, it is unlikely that mis-measurement of radiation deposition through kriging would be systematically correlated with underlying unobserved variables that affect farmers’ production decisions or agricultural productivity. Therefore, mis-measurement of radiation deposition through kriging would weaken the radiation deposition proxy and bias regression coefficients towards zero.
The location of the testing site was not random, because it was chosen for its remote location and proximity to government labs. However, the tests themselves are exogenous events from the perspective of farmers. The precipitation of fallout across much of the United States can be treated as a quasi-exogenous shock because the U.S. government, AEC, and U.S. military provided little public information regarding the tests. Persons living far away from the site did not know where a fallout cloud traveled or the exact dates of nuclear tests. While test planners avoided meteorological conditions that could result in fallout in the immediate area around the base, they were unable to adjust test schedules for weather conditions far outside the region (National Cancer Institute 1997).
Public knowledge of the dangers associated with nuclear testing was under-developed early in the testing period at the NTS. Persons living in the few counties downwind of the test site might have suspected the tests caused illness and were harmful to the environment, as they could visibly link tests with radioactive dust blown by low altitude winds. These counties are excluded from my sample because they are neither corn nor wheat producing areas. Furthermore, the livestock data also come from outside this local area. The public at large became aware of how dangerous atmospheric tests at the NTS were in the late 1970s after the Freedom of Information Act requests and Congressional hearings revealed that the AEC and PHS mislead the public about radiation risks (U.S. Committee on Interstate and Foreign Commerce 1980; Ball Reference Ball1986; LeBaron Reference LeBaron1998; Fradkin Reference Fradkin2004).
It is unlikely that farmers living hundreds of miles from the test site anticipated the dangers of fallout from tests, the position of fallout clouds, or possessed knowledge of how fallout precipitates down under various meteorological conditions. To engage in avoidance behaviors, farmers would have needed an understanding of fallout dispersal, but that knowledge was only being developed by researchers roughly at the same time as testing or later. Furthermore, most of this research was classified until 1978. Even if the deposition variable is correlated with rainfall, precipitation and temperature controls should control for this correlative effect. Simple correlations suggest that cumulative yearly rainfall is weakly correlated with fallout deposition.
EMPIRICAL MODEL RESULTS
Evidence from controlled scientific experiments predicts that exposure to radioactive material can harm the development of commercial crops and that animals ingesting this radioactive material become less healthy. To test whether more irradiated counties experienced relative decreases in crop yields, harvested acreage, and livestock populations, I perform a series of fixed effect panel regressions.Footnote 15 I report four different regression specifications in the corresponding tables. Specification (1) includes only county and year fixed effects. Specification (2) reports the regression results after adding monthly weather controls. Reporting these two specifications helps establish the consistency of the empirical results and establishes that the effects of radioactive fallout are distinct from those of weather. Specification (3) includes state-specific time trends to control for trends that might be spuriously correlated with the treatment variable of interest. Specification (4) represents the regression specification discussed in the model section and includes the full set of 1945 county characteristics interacted with time indicator variables. These interactions flexibly control for potential confounding economic and demographic trends. All coefficient results discussed in this section refer to Specification (4) and are statistically significant at the 10 percent level and below unless otherwise noted. All standard deviation measures refer to sample deposition values from Table 1 and Table 2.
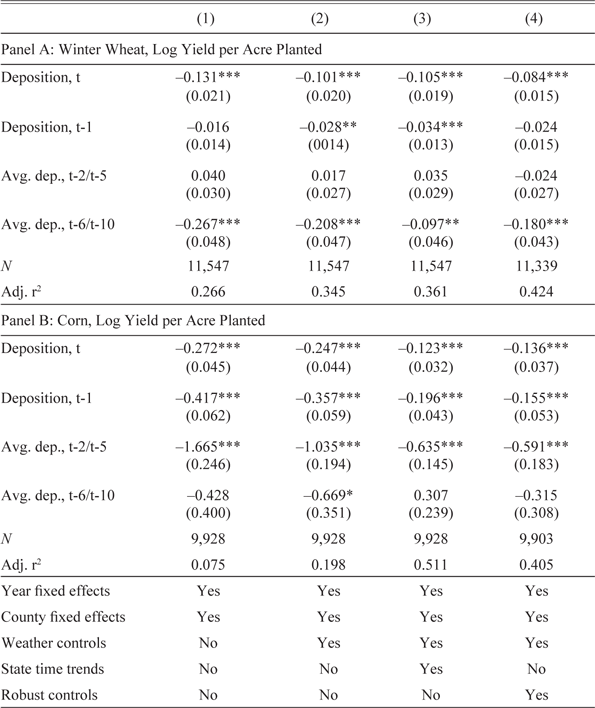
Radioactive fallout from atmospheric nuclear testing caused reductions in agricultural output throughout the Midwest and Plains states. Table 3 presents the effects of fallout deposition on winter wheat per yield planted (Panel A) and corn yield per acre planted (Panel B). In Specification (4), wheat yields decrease in the year of fallout deposition. The coefficient of –0.084 suggests that a one standard deviation increase in fallout deposition of 400 nCi would cause a 3.3 percent reduction in wheat yields per acre planted. In the year after deposition, fallout continued to reduce yields. Yield reductions also appear many years after the initial fallout deposition event. An increase in average fallout deposition six to ten years prior reduced wheat yields. The estimated coefficient of –0.180 suggests that a one standard deviation increase in average fallout six to ten years ago, 150 nCi, would reduce wheat yields by approximately 2.7 percent. This delayed effect reveals that fallout from the NTS testing decreased wheat productivity many years after atmospheric testing ceased.
ESTIMATED EFFECTS OF FALLOUT ON LOG YIELD PER ACRE PLANTED, 1945–1970

* p<0.10, ** p<0.05, *** p<0.01
Notes: Standard errors in parentheses are clustered by county. States in wheat sample include CA, CO, ID, KS, MT, OK, OR, SD, and WY. States in corn sample include IA, MT, ND, NE, SD, and WI. Samples are restricted to counties observed continuously from 1945 to 1958. Deposition is measured as thousands of nCi of I-131 depositing per m2 in each year. Weather controls for wheat consist of monthly temperature averages and precipitation totals from January to August in the current year and months September to December of the previous year. Weather controls for corn are from January to September in the current year. Robust controls are year dummies interacted with controls from 1945. These include share of cropland used as pasture, share of farmland as cropland, log number of farms, log agricultural land value per acre, log average farm size, percent of the labor force employed in agriculture, and population density per square mile.
Source: Author’s calculations.
Corn yields per acre planted were also sensitive to radioactive fallout shocks. Corn yields decrease in the year of fallout deposition. The coefficient of –0.136 suggests that a one standard deviation increase in deposition of 310 nCi would decrease corn yields per acre planted by 4.1 percent. In the subsequent year, the coefficient of –0.155 suggests that a one standard deviation increase in fallout would cause corn yields to decrease by 4.7 percent. Corn yields were also negatively affected two to five years after fallout deposited on fields. The coefficient of –0.591 implies that a one standard deviation increase in average fallout deposition two to five years ago, 160 nCi, would decrease corn yields per acre planted by 9 percent.
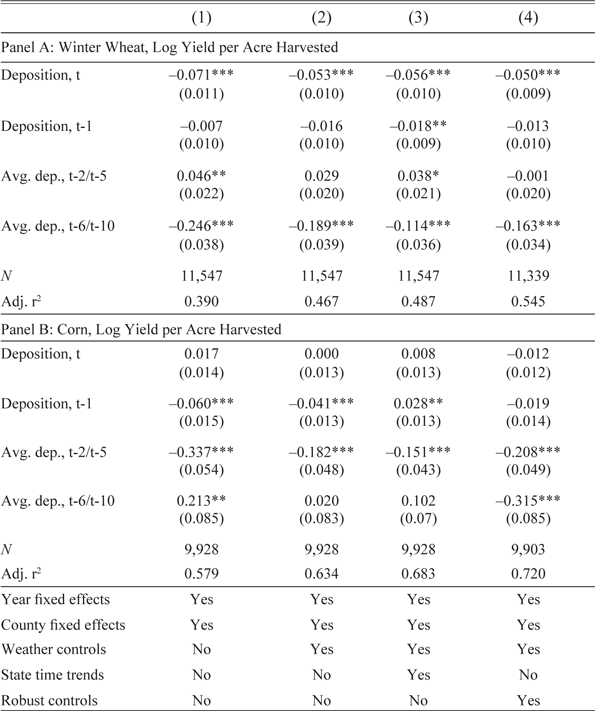
The results noted earlier reveal that radioactive fallout from the NTS nuclear tests resulted in large agricultural losses for two major commodity crops. Farmers have the option to not harvest cultivated acreage for grain (e.g., corn producers may leave corn on the field as fodder for cattle). Even though farmers could not observe the fallout that was damaging their crops, they might have opted not to harvest fields after observing the damage caused by the NTS fallout. Next, I report the effects of fallout deposition on yield per acre harvested in Table 4. Under Specification (4), the effects of fallout deposition on yield per acre harvested are mostly smaller than those for yield per acre planted for both wheat and corn. For wheat, the coefficient of –0.05 suggests that a one standard deviation increase in fallout deposition of 400 nCi would cause a 2 percent reduction in wheat yields per acre harvested. Fallout continued to reduce yields in the year after deposition. Yield reductions also appear many years after the initial fallout deposition event. An increase in average fallout deposition six to ten years prior would reduce harvested wheat yields. The estimated coefficient of –0.163 suggests that a one standard deviation increase in average fallout six to ten years ago, 150 nCi, would decease wheat yields by approximately 2.4 percent. Harvested corn yields were also negatively affected two to five years after fallout deposited on fields. The coefficient of –0.208 implies that a one standard deviation increase in average fallout deposition two to five years ago, 160 nCi, would decrease corn yields per acre harvested by 3.3 percent, and the coefficient of –0.315 implies that a one standard deviation increase in deposition six to ten years ago, 110 nCi, results in a 3.4 percent reduction in corn yields.
ESTIMATED EFFECTS OF FALLOUT ON LOG YIELD PER ACRE HARVESTED, 1945–1970

* p<0.10, ** p<0.05, *** p<0.01
Notes: Standard errors in parentheses are clustered by county. States in wheat sample include CA, CO, ID, KS, MT, OK, OR, SD, and WY. States in corn sample include IA, MT, ND, NE, SD, and WI. Samples are restricted to counties observed continuously from 1945 to 1958. Deposition is measured as thousands of nCi of I-131 depositing per m2 in each year. Weather controls for wheat consist of monthly temperature averages and precipitation totals from January to August in the current year and months September to December of the previous year. Weather controls for corn are from January to September in the current year. Robust controls are year dummies interacted with controls from 1945. These include share of cropland used as pasture, share of farmland as cropland, log number of farms, log agricultural land value per acre, log average farm size, percent of the labor force employed in agriculture, and population density per square mile.
Source: Author’s calculations.
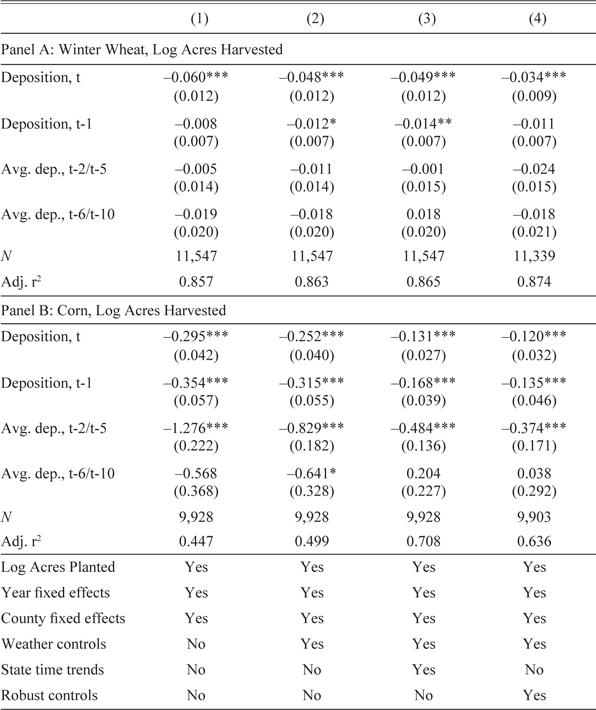
To measure the extent to which damage from fallout deposition caused crop abandonment, I regress fallout deposition on the natural log of acres harvested while controlling for the natural log of acres planted. Table 5 reports that damage from radioactive fallout led farmers to leave cultivated acreage unharvested. Under Specification (4), crop failure and poor performance (due to fallout that was unobservable to the farmer) resulted in farmers leaving planted crops unharvested. These decreases in acres harvested partially explain the observed reductions in yield per acre planted. For wheat, acres harvested decreases in the year fallout deposited on the ground. The coefficient of –0.034 suggests that a one standard deviation in fallout deposition that year of 400 nCi would cause wheat farmers to leave an additional 1.4 percent of their planted wheat unharvested. Harvesting decisions made by corn producers appear much more sensitive to the NTS fallout shocks. A coefficient of –0.120 suggests that a one standard deviation increase in fallout deposition that year of 310 nCi would decrease corn acres harvested by 3.7 percent. In the following year, the coefficient of –0.135 suggests that fallout would cause corn producers to harvest 4.1 percent fewer acres of corn. Harvested corn acreage was also negatively affected two to five years after fallout deposited on fields. The coefficient of –0.374 represents a large effect and suggests that a one standard deviation increase in average deposition two to five years ago, 160 nCi, would decrease harvested corn acreage by 5.8 percent.
ESTIMATED EFFECTS OF FALLOUT ON ACRES HARVESTED CONDITIONED ON ACRES PLANTED, 1945–1970

* p<0.10, ** p<0.05, *** p<0.01
Standard errors in parentheses are clustered by county. States in wheat sample include CA, CO, ID, KS, MT, OK, OR, SD, and WY. States in corn sample include IA, MT, ND, NE, SD, and WI. Samples are restricted to counties observed continuously from 1945 to 1958. Deposition is measured as thousands of nCi of I-131 depositing per m2 in each year. Weather controls for wheat consist of monthly temperature averages and precipitation totals from January to August in the current year and months September to December of the previous year. Weather controls for corn are from January to September in the current year. Robust controls are year dummies interacted with controls from 1945. These include share of cropland used as pasture, share of farmland as cropland, log number of farms, log agricultural land value per acre, log average farm size, percent of the labor force employed in agriculture, and population density per square mile.
Source: Author’s calculations.
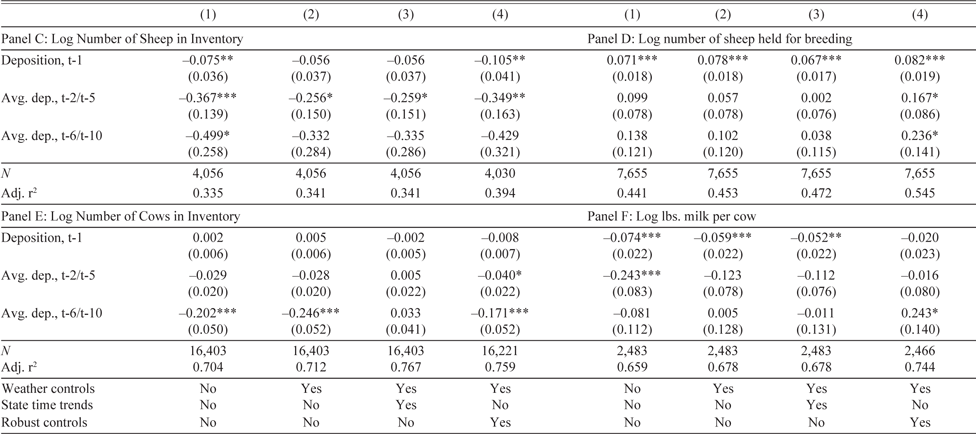
The effects of fallout upon grazing livestock are also large in magnitude. Ingestion of irradiated pasture likely decreased animal fertility and possibly killed some animals. Table 6 reports the effects of fallout deposition on four different outcomes, log number of sheep reported in inventory (Panel C), log number of sheep withheld for breeding (Panel D), log number of dairy cows in inventory (Panel E), and log lbs. of milk produced per head of cow (Panel F).
ESTIMATED EFFECT OF FALLOUT ON LIVESTOCK, 1945–1970

* p<0.10, ** p<0.05, *** p<0.01
Notes: All regressions include county and year fixed effects. Standard errors in parentheses are clustered by county. States in sheep inventory sample include NE and SD. States in sheep breeding sample include IL, MN, MT, and ND. States in dairy cow sample include CO, IL, MN, MO, MT, ND, NE, and SD. States in milk sample include SD starting in 1954 and MN starting in 1955. Samples are restricted to counties observed continuously from 1945 to 1958. Deposition is measured as thousands of nCi of I-131 depositing per m2 in each year. Weather controls consist of monthly temperature averages and precipitation totals for all months of the previous year. Robust controls are year dummies interacted with controls from 1945. These include share of cropland used as pasture, share of farmland as cropland, log number of farms, log agricultural land value per acre, log average farm size, percent of the labor force employed in agriculture, and population density per square mile.
Source: Author’s calculations
Under Specification (4), the number of sheep reported in county inventories decrease in response to fallout. In the year following deposition, the coefficient of –0.105 implies that a one standard deviation increase in fallout deposition of 310 nCi would cause a 3.2 percent reduction in sheep inventories at the county-level. Two to five years after fallout landed, sheep inventories continued to decrease. The coefficient of –0.349 suggest that a one standard deviation increase in average deposition two to five years ago, 170 nCi, would decrease sheep inventories by 5.8 percent. If the ingestion of irradiated pasture made livestock less healthy and stunted animal growth, then farmers may have opted to hold on to animals until they increased in weight or had sufficient offspring to recover from the fallout induced damage. Fallout landing in the previous year increased the number of sheep farmers withheld from sale for breeding purposes. The coefficient of 0.082 implies that a one standard deviation increase in fallout deposition of 270 nCi would cause farmers to hold onto 2.2 percent more sheep next year. The coefficient of 0.167 suggests that a one standard deviation increase in average fallout deposition two to five years prior, 140 nCi, would result in farmers holding onto 2.3 percent more sheep for breeding purposes. A one standard deviation increase in average deposition six to ten years prior, 90 nCi, and coefficient of 0.236, results in farmers holding on to 2.1 percent more sheep.
In the bottom portion of Table 6, the effects of fallout on dairy cow inventories and milk output per cow are reported. Cattle are larger than sheep and are more resilient to damage from ingesting irradiated pasture. Nevertheless, cows that consumed irradiated pasture might have experienced decreased lactation, reductions in fertility and offspring viability, and became less healthy. To test whether dairy cows were adversely affected by fallout, I examine dairy cow inventories and average annual milk production per cow. The impact of fallout deposition on the number of dairy cows is negative and statistically significant for all deposition lags in Specification (4). Cow populations decreased in the year following deposition and the magnitude of this negative effect increases over time. A one standard deviation increase in average deposition two to five years prior, 160 nCi, on the coefficient of –0.040 is also less than 1 percent. The magnitude of the effect increases with average deposition six to ten years prior. The coefficient of –0.171 suggests that a one standard deviation increase in average fallout deposition six to ten years ago, 110 nCi, would decrease dairy cow inventories by approximately 1.9 percent. Finally, data is available for milk per head of cow from 1954 onwards for South Dakota and 1955 onwards for Minnesota. Some specifications suggest that the ingestion of irradiated pasture decreased lactation in cows, but the magnitude and statistical significance of the negative coefficients attenuates with the inclusion of more controls in Specification (4).
Effects of Radioactive Fallout Shocks on Farm Decisions
If damage from nuclear testing was sizable enough, it is plausible that fallout shocks may have altered the decisions of agricultural producers. In the Online Appendix, I present a series of fixed effect panel regressions describing how fallout deposition between enumeration years of U.S. Agricultural Censuses affect the log number of farm operations, agricultural land values per acre, and the share of farmland dedicated to crop production in counties from 1945 to 1969. I find some evidence that fallout from the NTS may have led to reductions in agricultural land values and the amount of farmland used to produce crops.
In a companion paper, I analyze how U.S. Department of Agriculture policy can fundamentally shape producers’ responses to agricultural productivity shocks (Meyers Reference Meyers2018a). Fallout induced productivity shocks interacted with USDA production controls for wheat. The amount of wheat farmers could harvest was tied to a three-year moving average of past harvested acreage and this creates a “use-it or lose-it” incentive for farmers to plant. Generally, one would expect farmers to divert resources away from a poorly performing crop if they believe adverse productivity shocks are serially correlated. With nuclear testing, I find that wheat producers diverted resources towards rather than away from wheat following a fallout induced productivity shock and increased wheat planting in the year after fallout deposition. Corn producers, who were not subject to such a “use-it or lose-it” policy, do not change their planting decisions in a statistically significant manner.
INTERPRETING THE MAGNITUDE OF THE EFFECTS
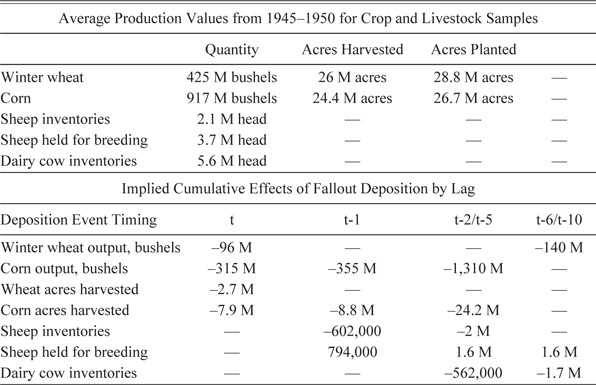
To interpret the magnitude of these estimates described earlier, I use a series of back-of-the-envelope calculations. These are reported in Table 7 along with averages of annual totals for the years 1945 to 1950 for each regression sample. To calculate the total effect, I create county-specific percent changes in output from estimated coefficients and radiation deposition measures for each year. I then multiply these percent changes by a baseline. Next, I sum up all the changes in output attributable to nuclear testing from 1951 to 1970. Specifically, I first take fallout deposition coefficients estimated in Specification (4), multiply them by their respective fallout measures for each county and year. This gives the county-specific percent change in output attributable to fallout for each year in the sample. To measure the effect on wheat and corn yields, I multiply these fallout effects by planted acreage and the average county-specific yield from 1945 to 1950. I use these average yields as a counter-factual yield baseline in the absence of the NTS nuclear testing. When estimating how much planted acreage was abandoned, I multiplied the estimated fallout effect by how much corn or wheat acreage was planted that year.
ESTIMATED CUMULATIVE EFFECTS OF FALLOUT UPON AGRICULTURAL PRODUCTION

Notes: All calculations are based on regression coefficients from specification (4) and their relevant tables. Unless otherwise noted, all measures are reported in the millions and denoted by “M.” For each county and year, the output effect is calculated using the coefficient and deposition measures. These effects were then multiplied against the 1945/1950 average values (and acres planted for crop output) to estimate the cumulative effect. Acres harvested total was based on actual acres planted in each year. Totals were summed up for each respective regression sample.
Source: Author’s calculations.
I estimate that atmospheric testing at the NTS decreased winter wheat output by a total of 236 million bushels. The cumulative loss in output over this 19-year window is approximately half of the average annual production in the wheat sample between 1945 and 1950. This amount comes out to be 368.8 bushels per farm.Footnote 16 The total value of this loss using nominal prices from 1951 to 1970 is $430 million ($3.62 billion in 2016$). The U.S. Consumer Price Index adjusted values are in parentheses.Footnote 17 The loss per farm in the wheat sample is approximately $672. The total drop in output for corn was greater. The cumulative loss in output was approximately two billion bushels, which is more than two years of the 1945/1950 average production for the corn sample. The nominal value of this loss is $2.4 billion dollars ($21.2 billion). The average farm in the corn sample would have produced approximately 3,048.3 fewer bushels over the sample period and lost approximately $3,658 in corn. To put this value into perspective, the average price paid for a 20-horsepower tractor in 1945 was $922. In 1946, the average U.S. farm earned $4,330 in gross income, and the average annual operating cost of a farm 1946 was $2,289.Footnote 18
Approximately 2.7 million acres of planted wheat and 40.9 million acres of planted corn went unharvested due to the NTS nuclear tests. This comes out to 4.2 fewer acres of wheat and 62.5 fewer acres of corn harvested per farm. Inventories for animals also changed because of radioactive fallout. Total inventories of sheep dropped by as much as 2.6 million head and dairy cow populations decreased by as much as 2.3 million head. This comes out to approximately 14.5 fewer sheep and 2.4 fewer cows per farm over the sample period.Footnote 19 The cumulative values of these losses are approximately $41.2 million ($353 million) for sheep and $451 million ($3.63 billion) for cows. These losses come out to $229 per farm in the sheep inventory sample and $469 per farm in the dairy cow sample.
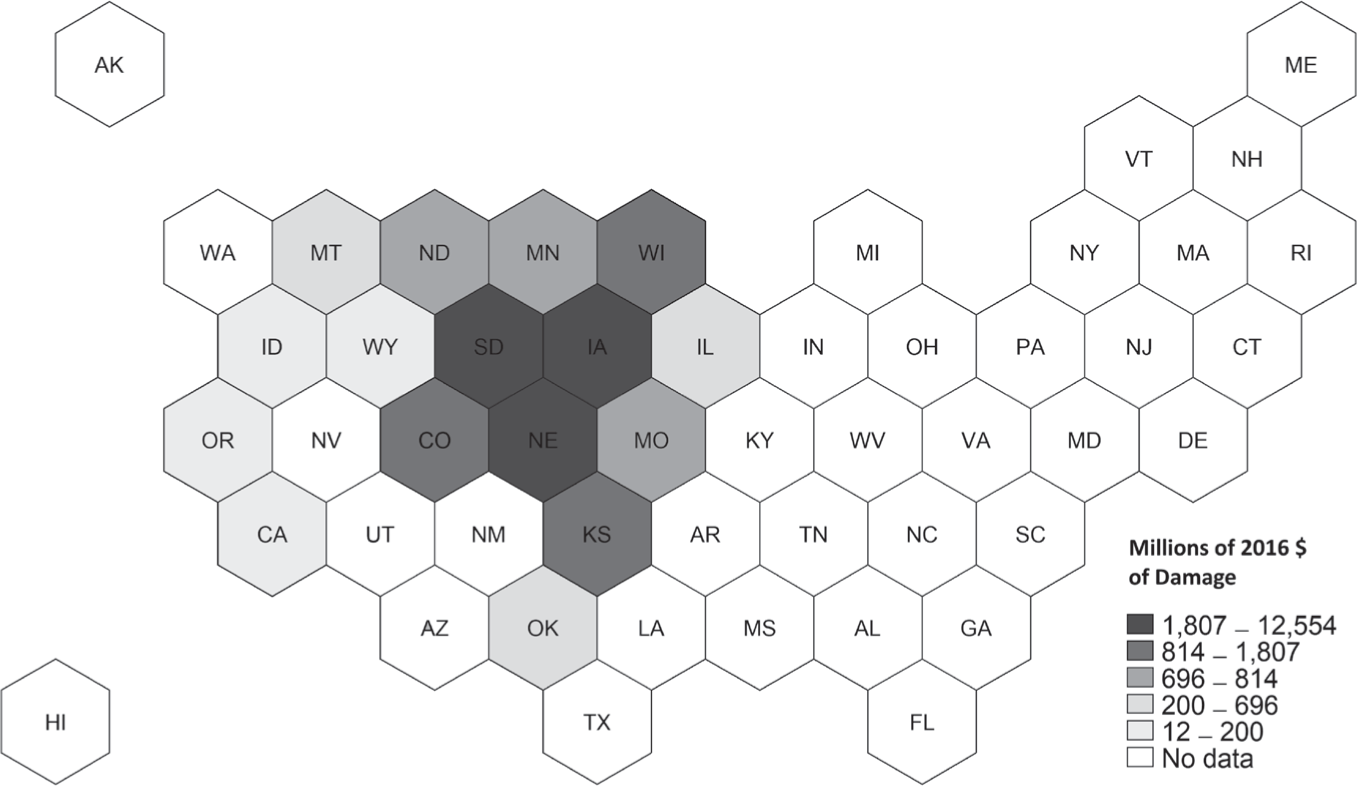
According to the empirical estimates Iowa, Nebraska, and South Dakota experienced the greatest amount of harm from the NTS atmospheric testing. Figure 4 plots these cumulative losses by state.Footnote 20 This map shows that areas with large amounts of corn and wheat cultivation experienced the greatest amount of harm. These areas are far from the NTS and show that the externalities associated with the NTS activities had a broader geographic extent than what was previously known.
ESTIMATES OF CUMULATIVE AGRICULTURAL LOSSES, 1951 TO 1970, 2016$

The U.S. Justice Department has paid out approximately $2 billion in compensation to victims of domestic nuclear testing since 1990.Footnote 21 This compensation program was a legislative solution for victims of nuclear testing (often victims did not have legal standing to sue the U.S. government and judicial remedies were not possible). This program compensates persons who lived in the several “Downwind” counties in Nevada, Arizona, and Utah during the period of testing and their decedents. The program also compensates persons who were involved with the U.S. nuclear weapons program. I find that radioactive pollution depositing far beyond the compensation region had substantial effects on agricultural output over a 20-year period and the value of these losses dwarf the amount of compensation the U.S. government has paid to some victims of nuclear testing.
CONCLUSION
The Cold War was a tumultuous period in geopolitics. Many of the policy decisions made decades ago with respect to the Cold War had unintended consequences and many of these choices continue to shape contemporary events. The decision to conduct atmospheric nuclear tests in the Nevada desert is one example of these policies that had unintended and unanticipated social costs. The geopolitical conflict between the United States and the U.S.S.R. resulted in the rapid development and deployment of nuclear weapons in the 1950s. This process accelerated atmospheric nuclear testing and created tremendous quantities of harmful radioactive pollution.
The social costs of atmospheric nuclear weapons tests are not yet fully understood and contemporary research is only beginning to grapple with the scale and scope of these costs. The scientific and medical research studying the effects on nuclear testing in Nevada has focused almost exclusively on regions surrounding the NTS. These studies, however, have not measured the external costs of these polluting activities nor the geographic extent of the harm. To study externalities associated with nuclear testing, I construct a new dataset of county-level fallout deposition for each year from 1951 to 1958 for the United States. With this novel dataset, I can use within-county changes in fallout deposition across time while controlling for national shocks, local weather effects, and trends in agricultural productivity.
Fallout from nuclear testing had direct adverse effects on the U.S. economy and these effects were felt especially in the Plains and Midwestern states. This article connects reductions in agricultural output to radioactive fallout originating from atmospheric nuclear tests conducted in Nevada. I show that the great amounts of economic harm occurred in areas not studied in the previous literature. Much of the agricultural damage occurred far from the NTS, and damage from fallout contamination persisted for many years following the deposition of radioactive materials. Recent literature suggests that radioactive pollution resulting from nuclear testing and nuclear power accidents have profound long-run effects on human capital and wellbeing. Much of the radioactive material studied in this article entered the food supply and was subsequently consumed by millions of people. These facts raise important questions regarding the long-term social costs of the Cold War.