INTRODUCTION
Worldwide, projected increases in human populations and incomes by 2050 and its affluence have led to predictions of increased demand for livestock products (Steinfeld et al. Reference Steinfeld, Gerber, Wassenaar, Castel, Rosales and De Haan2006). However, in contrast, because of saturated fat intakes from livestock products, reductions in their consumption have been recommended to counter the epidemic of obesity associated disease in the developed world (World Health Organisation 2003). Further, methane (CH4) production by ruminant livestock is a contributor to greenhouse gas (GHG) emissions (Steinfeld et al. Reference Steinfeld, Gerber, Wassenaar, Castel, Rosales and De Haan2006) and policy requirements to reduce GHG emissions also suggest that livestock numbers may decline and consequently the quantities of milk, meat and eggs available for consumption by humans would also be reduced.
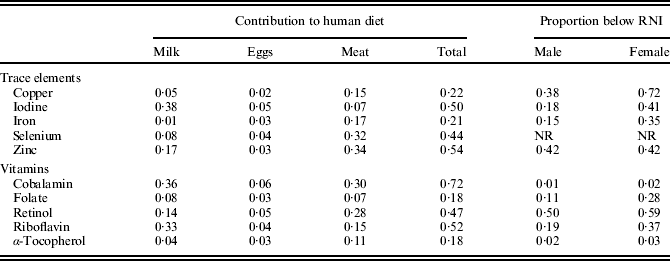
In addition to macro-nutrient components, livestock products contribute quantitatively important amounts of trace elements and vitamins to the human diet. Table 1 summarizes information extracted from the UK National Diet and Nutrition Survey (NDNS; Henderson et al. Reference Henderson, Irving and Gregory2002), including for each micro-nutrient the proportion of men and women whose intakes were less than the Reference Nutrient Intake (RNI, defined as the amount of a nutrient sufficient, or more than sufficient, to prevent deficiencies in 0·975 of the UK people in any group). Two main conclusions can be drawn. First, more than half of iodine (I), zinc (Zn), cobalamin and riboflavin intakes were accounted for by livestock products; indeed, more than 0·20 of intake for all micro-nutrients was supplied from livestock products. Secondly, and particularly for females, substantial proportions of the population had intakes less than RNI, particularly Zn, copper (Cu), iron (Fe) and retinol. The NDNS did not report data for selenium (Se), but Rayman (Reference Rayman2008) summarized intakes worldwide and demonstrated that in many populations the mean intakes of 75 (men) and 60 (women) μg/d were less than the intakes recommended by COMA (1991). Therefore, if the consumption of livestock products is to decrease in the future, consideration needs to be given to how intakes of important trace elements and vitamins are to be maintained, particularly those where a proportion of the population already consume less than the daily RNI. One method could be to increase the concentration in livestock products of specific nutrients which can significantly contribute to the human diet.
Contribution (proportion) of trace elements and vitamins from livestock products to the human diet and the proportion of population with intakes below RNI (Henderson et al. Reference Henderson, Irving and Gregory2002)

NR, not reported.
Therefore, the objective of the present review is to explore the feasibility of increasing the trace element and vitamin concentrations of livestock products by nutritional and genetic routes and to estimate what contribution to human intake might be made by the products of improved composition. In relation to nutrition, the emphasis will be on supplementation above the requirement of livestock for any nutrient, but within levels permitted by current feeding stuff regulations and below intakes which would be toxic to the animal. The micro-nutrients discussed were selected, because (a) livestock products currently make a substantial contribution to human intakes; (b) there is evidence that human intakes may be less than the RNI and (c) evidence exists that concentrations in livestock products can be manipulated. To maintain the focus of the review, differences in bio-availability between different chemical forms of particularly the trace elements (for example, haem v. non-haem Fe and seleno-cysteine v. seleno-methionine) are not dealt with in any detail, or are other compounds present in livestock products which may influence bio-availability. Further details of the sources for the range of values for each nutrient given in the Tables are supplied as Supplementary Material, available from the JAS website at http://journals.cambridge.org/, instead of being described in detail in the text.
NUTRITION
The discussion of trace elements is structured to account for the homeostatic control of body concentrations. Therefore, Cu, Fe and Zn, for which absorption from the diet and liver storage are important control mechanisms, will be considered separately from I and Se, in which these factors are less important.
Copper, iron and zinc
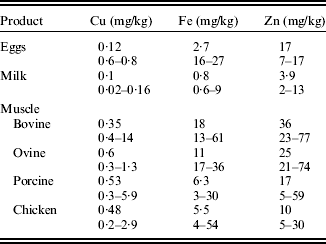
Mean values for Cu, Fe and Zn concentrations in milk, meat and eggs (derived from McCance and Widdowson's The Composition of Food; Food Standards Agency 2002) are given in Table 2 together with a summary of the range of values reported in research publications, mainly from the last 10 years (see Supplementary Material for source references). In general, the ranges reported in the research studies agreed with the mean values from the Food Standards Agency (2002). However, while the ratio of the maximum to minimum values for different meats was approximately 10-fold, the maximum to minimum ratio for milk and eggs was less, approximately 2-fold. Although some of the variation in values for muscle meats is undoubtedly due to factors such as species, muscle type and age (Lawrie & Ledward Reference Lawrie and Ledward2006), this greater variation suggests that there might be scope for the manipulation of meat Cu, Fe and Zn concentrations.
Mean Cu, Fe and Zn concentrations for muscle meats, milk and eggs from the Food Standards Agency (2002) together with the range of values derived from recent literature (see Supplementary Material for details)

Copper
Copper homeostasis in mammals is largely achieved by an uptake of Cu into the liver and the excretion of excess Cu into bile (Sharp Reference Sharp2004). The ability to excrete Cu varies between species and is correlated with the risk of Cu deficiency in the species. Thus ruminants, particularly sheep, which habitually encounter Cu deficiency, accumulate more Cu in the liver and are correspondingly more susceptible to Cu toxicity (Underwood & Suttle Reference Underwood and Suttle1999). Thus, liver Cu concentrations reflect dietary status and vary widely, particularly in ruminants (e.g. 60–450 mg/kg liver in sheep; Woolliams et al. Reference Woolliams, Suttle, Wiener, Field and Woolliams1982) and are 100–1000-fold greater than muscle (Table 2). In contrast to liver concentrations, most supplementation studies have not increased the Cu concentration of other livestock products. It therefore appears that muscle Cu is unresponsive to increasing dietary Cu (Scientific Committee for Animal Nutrition 2003). Studies not reported in the above support this conclusion: there were no differences in muscle Cu in sheep either when herbage with increased Cu concentration was fed (Wilkinson et al. Reference Wilkinson, Hill and Livesey2001), or when ewes were fed 12 or 20 mg Cu/kg diet (Woolliams et al. Reference Woolliams, Suttle, Wiener, Field and Woolliams1982). In pigs, recent studies have shown that muscle Cu does not decline until the Cu status of the pig becomes marginal (Hartmann et al. Reference Hartmann, Eder and Kirchgessner1994; Hernández et al. Reference Hernández, Pluske, D'Souza and Mullan2008).
In eggs, responses (Pesti & Bakalli Reference Pesti and Bakalli1998; Skrivan et al. Reference Skrivan, Skrivanova and Marounek2006b) have been reported in egg Cu at levels of supplementation (250 mg/kg) which approach the tolerable upper level for Cu for hens but not at lower levels of supplementation (Skrivan et al. Reference Skrivan, Skrivanova and Marounek2005). However, increases in Cu concentrations have been observed in the yolk and shell but not the white; thus, overall increases in the Cu concentration of edible egg were not statistically significant (Pesti & Bakalli Reference Pesti and Bakalli1998). In addition, increases in Cu concentration at high levels of supplementation are associated with increased Cu excretion into the environment (Leeson Reference Leeson2009).
For milk, evidence that milk Cu can be influenced by diet arises from surveys of the effects of heavy metal exposure (e.g. Patra et al. Reference Patra, Swarup, Kumar, Nandi, Naresh and Ali2008); no data on dietary Cu were available in these studies and the range in milk Cu concentration was small (0·05–0·15 mg/l).
Iron
In contrast to Cu, there is no controlled route for Fe excretion and the main homeostatic mechanism is the control of absorption from the gastro-intestinal tract. This is mediated by hepcidin (Cairo et al. Reference Cairo, Bernuzzi and Recalcati2006), coupled with recycling of Fe from senescent erythrocytes (Fairweather-Tait Reference Fairweather-Tait2004) and storage in the liver as ferritin. Therefore, only a small fraction of dietary Fe is absorbed. Haem Fe is absorbed via a specific carrier protein (Cairo et al. Reference Cairo, Bernuzzi and Recalcati2006) which accounts for its higher bio-availability compared to non-haem Fe: this is relevant, because muscle Fe is mainly haem Fe (c. 0·85) in the form of myoglobin.
Given the tight control of Fe absorption, it is not surprising that tissue Fe concentration is largely unresponsive to manipulation by dietary means. In supplementation studies with cattle (Standish et al. Reference Standish, Ammerman, Simpson, Neal and Palmer1969), sheep (van Ravenswaay et al. Reference Van Ravenswaay, Henry and Ammerman2001) and pigs (Shaw et al. Reference Shaw, Rozeboom, Hill, Booren and Link2002; O'Sullivan et al. Reference O'Sullivan, Byrne, Stagsted, Andersen and Martens2002; Apple et al. Reference Apple, Wallis-Phelps, Maxwell, Rakes, Sawyer, Hutchison and Fakler2007), responses in muscle Fe were reported only when Fe was supplied (7 g FeSO4/kg feed; O'Sullivan et al. Reference O'Sullivan, Byrne, Stagsted, Andersen and Martens2002) above the legal limit for inclusion in feed (750 mg/kg feeding stuff). Seo et al. (Reference Seo, Lee, Lee, Shin and Paik2008), however, reported a significant increase in poultry meat Fe (from 20 to 29 mg/kg muscle) through the use of Fe chelated to methionine (200 mg Fe/kg diet), rather than the FeSO4 used in the above studies.
Differences in effectiveness between Fe supplied as FeSO4 or chelated to methionine or other organic materials may also apply to eggs. While supplementation with 150 mg/kg FeSO4 increased egg Fe by approximately 0·05-fold (Skrivan et al. Reference Skrivan, Skrivanova and Marounek2005), 100 mg/kg organic Fe gave greater (>0·10-fold) increases in egg Fe (Park et al. Reference Park, Namkung, Ahn and Paik2004; Paik et al. Reference Paik, Lee and Park2009).
For milk, the only report (Knowles et al. Reference Knowles, Grace, Knight, Mcnabb and Lee2006) of an increase in milk Fe has been by the subcutaneous injection of supplementary Fe, emphasizing the lack of response to dietary Fe.
Zinc
Zinc homeostasis is controlled at the level of the gastro-intestinal tract by absorption from the tract and by excretion in pancreatic secretions (King et al. Reference King, Shames and Woodhouse2000). Control at the cellular level (Cousins et al. Reference Cousins, Liuzzi and Lichten2006) is achieved through balancing the expression of Zn-transporters which control cellular Zn efflux and influx.
Muscle Zn is refractory to manipulation by dietary means. In depletion studies in pigs (Shaw et al. Reference Shaw, Rozeboom, Hill, Booren and Link2002; Hernández et al. Reference Hernández, Pluske, D'Souza and Mullan2008), muscle Zn concentrations remained unchanged, while liver and kidney Zn were depleted. Supplementation with varying forms of Zn in cattle (Malcolm-Callis et al. Reference Malcolm-Callis, Duff, Gunter, Kegley and Vermeire2000; Kessler et al. Reference Kessler, Morel, Dufey, Gutzwiller, Stern and Geyer2003), sheep (Lee et al. Reference Lee, Treloar and Grace1994; Rojas et al. Reference Rojas, McDowell, Cousins, Martin, Wilkinson, Johnson and Velasquez1995; Henry et al. Reference Henry, Littell and Ammerman1997) and chickens (Bou et al. Reference Bou, Guardiola, Tres, Barroeta and Codony2004, Reference Bou, Guardiola, Barroeta and Codony2005) had little effect. In sheep, one study (Lee et al. Reference Lee, Treloar and Grace1994) found a significant increase in muscle Zn in response to herbage Zn, while in another Henry et al. (Reference Henry, Littell and Ammerman1997) reported a decrease. Similarly, egg (Skrivan et al. Reference Skrivan, Skrivanova and Marounek2005) and milk Zn (Cope et al. Reference Cope, Mackenzie, Wilde and Sinclair2009) were unresponsive to dietary supplementation.
In summary, since normal constituents of animal diets contain adequate amounts of Cu, Zn and Fe, homeostatic mechanisms are set to avoid the accumulation of these potentially toxic elements. Therefore, attempts to increase product concentration by dietary means have been largely unsuccessful. There do appear to be some differences between trace elements, with Zn being completely refractory to manipulation, while egg Cu and Fe could be increased. The fact that chicken muscle and egg Fe were increased by chelated Fe but not FeSO4 suggests that the form of the element may be important.
Iodine and selenium
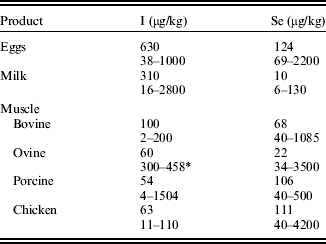
Table 3 summarizes the range of values for I and Se reported for livestock products in comparison with mean values from the Food Standards Agency (2002). The range of concentrations, approximately 100-fold, is greater than for Fe, Cu and Zn (Table 2), but it is not consistent across all livestock products reflecting the homeostatic mechanisms involved.
Mean I and Se concentrations for muscle meats, milk and eggs from the Food Standards Agency (2002) together with the range of values derived from recent literature (see Supplementary Material for details)

* Sheep consuming seaweed (Liu et al. Reference Lu, Suliman, Hansen and Feldmann2006).
Iodine
In contrast to the positively charged Cu, Fe and Zn, the negatively charged iodide ion is efficiently absorbed from the gastro-intestinal tract and the control of body levels is achieved by uptake into the thyroid gland and excretion of excess in urine. The limited evidence suggests that across species, supplementation with I produces moderate increases in muscle I. In cattle (Meyer et al. Reference Meyer, Weigel, Schone, Leiterer and Flachowsky2008), an increase in dietary I (from 0·8 to 8·3 mg/kg) increased muscle I from 24 to 115 μg/kg. Similarly, in several studies (Schone et al. Reference Schone, Zimmermann, Quanz, Richter and Leiterer2006; Franke et al. Reference Franke, Schone, Berk, Leiterer and Flachowsky2008b), pigs which were fed supplements ranging from 3 to 30 mg I/kg, elicited muscle I concentrations from 15 to 150 μg/kg. An extreme case relates to values given in Table 3 for sheep. These were for sheep grazing seaweed in North Ronaldsay, Orkney Isles (Lu et al. Reference Lu, Suliman, Hansen and Feldmann2006), which habitually consumed I at least 1000-fold more (c. 5600 mg/kg dry matter (DM) than the above studies); however, muscle I concentrations in these sheep were 300–450 μg/kg, less than 10-fold greater than the values reported in cattle and pig studies.
In contrast to the modest increases possible with muscle meats, more substantial increases are possible for egg and in particular milk I concentration. Milk is an alternative route of I excretion to urine and I is secreted in milk proportionate to the intake (Underwood & Suttle Reference Underwood and Suttle1999). For example, Schone et al. (Reference Schone, Leiterer, Lebzien, Bemmann, Spolders and Flachowsky2009) increased dietary I from 0·2 to 10·1 mg/kg feed DM and recorded an increase in milk I from 101 to 2762 μg/kg milk.
The I concentration of the hen's egg is relatively easy to manipulate and a number of I-enriched egg products are commercially available, some providing all the Recommended Daily Allowance (RDA) in one egg (Bourre & Galea Reference Bourre and Galea2006). Yalcin et al. (Reference Yalcin, Kahraman, Yalcin, Yalcin and Dedeoglu2004) noted a linear increase in egg I from 160 to 1300 μg/kg in response to increases in dietary I supplementation up to 24 mg/kg.
Selenium
The chemical form of dietary Se has marked effects on its absorption and utilization, with the main difference being between inorganic (selenite or selenate) or organic (principally seleno-methionine, Se-Met) forms. In contrast to Cu, Fe and Zn, there appears to be no homeostatic control of Se absorption, with an absorption coefficient in non-ruminants of about 0·80 for inorganic Se (Rayman et al. Reference Rayman, Infante and Sargent2008), while Se-Met is actively absorbed via the methionine transport system. In ruminants, the availability of Se is lower, probably because of the reduction of selenite and the catabolism of Se-Met within the rumen. Human Se status widely varies with geographical location (Rayman Reference Rayman2008), reflecting the underlying Se concentration of the soil. In the case of livestock, diets are usually supplemented to avoid Se deficiencies and some countries, for example, Finland, mandate the inclusion of Se in fertilizers, with consequent improvements in the Se status of the human population (Reilly Reference Reilly2004).
Most reports of Se supplementation concern the addition of selenite or organic Se in the form of selenized yeast, which contains predominantly Se-Met. In general, there are consistent responses to supplementation in the Se concentration of all livestock products. Supplementation with Se-Met rather than inorganic Se usually results in greater Se deposition, probably via the non-specific incorporation of Se-Met into protein in place of methionine. There are also differences in the Se species that accumulate; supplementation with Se-Met favours the accumulation of Se-Met rather than seleno-cysteine, particularly at higher inclusion rates (Bierla et al. Reference Bierla, Dernovics, Vacchina, Szpunar, Bertin and Lobinski2008; Juniper et al. Reference Juniper, Phipps, Ramos-Morales and Bertin2008).
Selenium supplementation of poultry products has been summarized by Surai (Reference Surai2006). In one study typical of a number of similar experiments (Sevcikova et al. Reference Sevcikova, Skrivan, Dlouha and Koucky2006), poultry fed diets with no added Se had a breast meat Se concentration of 0·05 mg/kg, compared with 0·22 mg/kg from birds fed Se-Met at 0·3 mg/kg diet, a 4-fold increase in Se. Egg and egg products have been enhanced with varying levels of Se, with commercial products now available in many countries in the world. Typical responses to supplementation are those obtained by Payne et al. (Reference Payne, Lavergne and Southern2005), who observed an increase from 0·25 to 0·67 μg Se/kg when 0·6 mg/kg was included in the diet as Se-Met (from yeast), compared to an increase from 0·25 to 0·33 μg/kg for selenite, and by Skrivan et al. (Reference Skrivan, Simane, Dlouha and Doucha2006a) where increases from 0·14 to 0·25 and 0·14 to 0·39 mg Se/kg were recorded for 0·3 mg/kg selenite and Se-Met, respectively.
In pigs, feeding Se-yeast consistently increases Se deposition in muscle to a greater extent than selenite (Mahan & Parrett Reference Mahan and Parrett1996; Mahan et al. Reference Mahan, Cline and Richert1999; Pesut et al. Reference Pesut, Backovic and Sobajic2005; Zhan et al. Reference Zhan, Wang, Zhao, Li and Xu2007). The mean increase was 3·2-fold for Se-Met (to 0·3 mg/kg muscle) compared to 1·6-fold for selenite (to 0·16 mg/kg muscle). Supplementary Se ranged from 0·3 to 0·5 mg/kg diet. The increases in tissue Se were largely through the incorporation of dietary Se-Met.
In cattle, a 2·8-fold increase (from 0·06 to 0·16 mg/kg muscle) in muscle Se was found with 0·5 mg organic Se/kg (Juniper et al. Reference Juniper, Phipps, Ramos-Morales and Bertin2008). When feeding 0·3 mg Se/kg, a consistently greater response was noted to organic than inorganic Se and tissue deposition was again largely in the form of Se-Met. Finally, in sheep, a 2-fold increase in muscle Se (from 0·10 to 0·22 mg/kg; mainly as Se-Met) was found with 0·4 mg Se/kg diet (Bierla et al. Reference Bierla, Dernovics, Vacchina, Szpunar, Bertin and Lobinski2008), with responses to inorganic Se being smaller.
Se levels in milk can similarly be increased by supplementing the ration of dairy cows. In keeping with other livestock products, selenized yeast provided the greatest response. A recent meta-analysis (Ceballos et al. Reference Ceballos, Sanchez, Stryhn, Montgomery, Barkema and Wichtel2009) of all studies involving Se supplementation of dairy cows reported an average increase in milk Se of 13 μg/l; organic Se, in keeping with data from meat and eggs, produced a substantially greater increase of 29 μg/l. In one UK study (Phipps et al. Reference Phipps, Grandison, Jones, Juniper, Ramos-Morales and Bertin2008), increases from 24 to 75 μg/l were observed with Se-yeast.
Thus, across species there is a 2- to 4-fold increase in muscle, milk and egg Se in response to supplementation with 0·3–0·5 mg Se/kg as organic Se. Lower responses are found with inorganic Se. Therefore, consistent nutritionally useful improvements in meat Se can be obtained by supplementing the feed of livestock; there may also be benefits to product oxidative stability as glutathione peroxidase activity increases in parallel with tissue Se.
Vitamins
In contrast to the trace minerals, microbial fermentation in the ruminant fore-stomach has marked effects on the quantities of vitamins entering the small intestine and available for absorption. Dietary water soluble B vitamins (including cobalamin and riboflavin) are degraded within the rumen and contribute only a small proportion to the amounts entering the small intestine (Schwab et al. Reference Schwab, Schwab, Shaver, Girard, Putnam and Whitehouse2006), most of which are derived from microbial synthesis within the rumen. In contrast, fat soluble vitamin supply is derived from the diet as it is either resistant (vitamin E; Weiss et al. Reference Weiss, Smith, Hogan and Steiner1995; Chikunya et al. Reference Chikunya, Demirel, Enser, Wood, Wilkinson and Sinclair2004) or partially resistant (vitamin A; Weiss et al. Reference Weiss, Smith, Hogan and Steiner1995; Ballet et al. Reference Ballet, Robert, Williams, Givens, Owen, Axford and Omed2000) to rumen degradation. Therefore, for water soluble vitamins, it is necessary to separately consider the ruminant from the monogastric animal.
Cobalamin, folate and riboflavin
Since these vitamins are extensively degraded within the rumen (Santschi et al. Reference Santschi, Berthiaume, Matte, Mustafa and Girard2005; Girard et al. Reference Girard, Santschi, Stabler and Allen2009) and the needs of the animal are usually met or exceeded by microbial synthesis within the rumen, dietary supplementation is not normally practised in ruminant nutrition. The exception to this may be the dairy cow in early lactation, in which there is some evidence that B vitamin supply may be sub-optimal (Girard & Matte Reference Girard and Matte2005). For cobalamin, it is necessary to ensure that sufficient cobalt is supplied in the diet to meet the needs for microbial cobalamin synthesis in the rumen. Opportunities to manipulate vitamin supply to the ruminant are limited, since the supply is dependent on microbial synthesis. Therefore, riboflavin supply expressed per unit feed fermented within the rumen is constant (Schwab et al. Reference Schwab, Schwab, Shaver, Girard, Putnam and Whitehouse2006) and the diet composition does not influence riboflavin supply. Cobalamin differs in that supply was negatively related to the starch concentration of the diet (Schwab et al. Reference Schwab, Schwab, Shaver, Girard, Putnam and Whitehouse2006). There is one report of the effect of supplementary cobalamin on milk cobalamin concentration. Graulet et al. (Reference Graulet, Matte, Desrochers, Doepel, Palin and Girard2007) reported an increase in milk cobalamin from 1·7 to 4·8 μg/l, but the efficiency of transfer from diet to milk was very low (c. 0·0002). Similarly, supplementary folate resulted either in no (Morel Reference Morel2007) or modest increases (15–20 μg/l; Girard et al. Reference Girard, Lapierre, Matte and Lobley2005; Graulet et al. Reference Graulet, Matte, Desrochers, Doepel, Palin and Girard2007) in milk folates. Similar to cobalamin, the efficiency of transfer from diet to milk was very low (0·0002–0·0004), probably because of extensive degradation within the rumen, and unlikely to be economic.
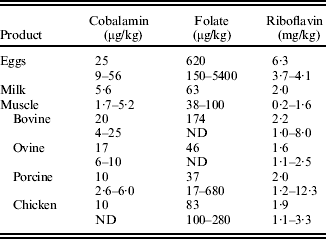
The few reports on muscle vitamin concentrations in the literature are in general agreement with Food Standards Agency (2002) (Table 4), with higher concentrations of cobalamin found in beef and lamb compared to pork and chicken. In cattle (Girard et al. Reference Girard, Berthiaume, Faucitano and Lafreniere2007), the negative effect of dietary starch intake on cobalamin supply was reflected in a reduction in muscle cobalamin concentration (from 11 to 9 μg/kg). Additionally, oxidative muscles (for example, rectus abdominis) had higher cobalamin concentrations (Ortigues-Marty et al. Reference Ortigues-Marty, Micol, Prache, Dozias and Girard2005) than glycolytic muscles (for example, semitendinosus).
Mean cobalamin, folate and riboflavin concentrations for muscle meats, milk and eggs from the Food Standards Agency (2002) together with the range of values derived from recent literature (see Supplementary Material for details)

ND, no data.
Pig diets normally include sufficient supplementary riboflavin, folate and cobalamin to meet the needs of the animal. Recently (Giguere et al. Reference Giguere, Girard and Matte2008), supplementation of pig diets with cobalamin (25 and 150 μg/kg) and folate (10 mg/kg) resulted in modest increases in muscle (longissimus dorsi) cobalamin (2·6–3·8 μg/kg) and folate (18–23 μg/kg). In poultry, McCann et al. (Reference McCann, McCracken, Hoey, Pentieva, McNulty and Scott2004) reported larger increases from 100 to 160 μg/kg in breast meat folate when up to 32 mg folate was added per kg of diet. The basal folate concentration in poultry meat (100–200 μg/kg; McCann et al. Reference McCann, McCracken, Hoey, Pentieva, McNulty and Scott2004) was notably greater than that reported in pig meat (20–30 μg/kg; Giguere et al. Reference Giguere, Girard and Matte2008). For riboflavin, both pig and poultry muscle concentrations appear to be resistant to dietary manipulation (Ang et al. Reference Ang, Jung, Benoff and Charles1984; Bohmer & Roth-Maier Reference Bohmer and Roth-Maier2007).
Similarly, although the cobalamin concentration of eggs can be readily increased nutritionally (4-fold), the responses to riboflavin are modest (Naber & Squires Reference Naber and Squires1993; Leeson & Caston Reference Leeson and Caston2003). There has been more interest in manipulating egg folate concentration. In most studies, maximum response has been to the inclusion of 4 mg folate/kg diet, resulting in an approximate doubling of egg folate concentration (House et al. Reference House, Braun, Ballance, O'Connor and Guenter2002; Hebert et al. Reference Hebert, House and Guenter2005; Roth-Maier & Bohmer Reference Roth-Maier and Bohmer2007; Bunchasek & Kachana Reference Bunchasak and Kachana2009). However, Hoey et al. (Reference Hoey, Mcnulty, McCANN, McCracken, Scott, Marc, Molloy, Graham and Pentieva2009) reported responses up to 16 mg/kg feed (increases from 650 to 1500 μg/kg egg) and attributed part of the difference between studies to whether the total folate or 5-methyltetrahydrofolate was measured.
Vitamins A and E
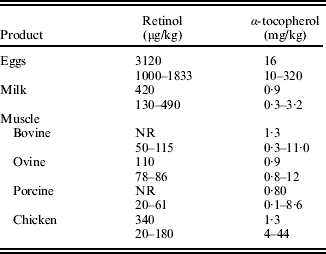
Both vitamins A (retinol) and E (α-tocopherol) are, after luminal hydrolysis of esters, absorbed by facilitated diffusion from the small intestine into the enterocyte (Debier & Larondelle Reference Debier and Larondelle2005). Absorbed retinol is re-esterified, incorporated into chylomicrons and the majority of retinol taken up into the liver and stored therein. Blood retinol concentrations are tightly controlled and there is a well-established relationship between dietary and liver retinol concentrations (see e.g. Arnett et al. Reference Arnett, Dikeman, Daniel, Olson, Jaeger and Perrett2009). Muscle retinol was increased by dietary supplementation in chickens (from 90 to 180 μg/kg; Jensen et al. Reference Jensen, Jensen, Jakobsen, Engberg, Andersen, Lauridsen, Sorensen, Skibsted and Bertelsen1998) and in pigs (from 30 to 60 μg/kg; Olivares et al. Reference Olivares, Rey, Daza and Lopez-Bote2009), but these were 1000-fold less than increases in liver retinol (58–190 mg/kg for chicken and 62–430 mg/kg for pig) in the same experiments. Similarly, the net increase in egg retinol on supplementation was substantially greater (250 μg/kg; Leeson & Caston Reference Leeson and Caston2003) than muscle.
In contrast to retinol, absorbed α-tocopherol is not re-esterified in the enterocyte (Debier & Larondelle Reference Debier and Larondelle2005), does not accumulate in the liver and circulates in plasma, and is associated with lipoproteins from which it is readily available. As a consequence, concentrations of α-tocopherol in livestock products (Table 5) differ less between tissues than vitamin A, although values for chicken meat and eggs tend to be higher. Meat, milk and egg α-tocopherol concentrations all respond to increased dietary vitamin E: (Givens et al. Reference Givens, Allison and Blake2003; Leeson & Caston Reference Leeson and Caston2003; Bou et al. Reference Bou, Grimpa, Baucells, Codony and Guardiola2006; Cho & Ahn Reference Cho and Ahn2006; De La Fuente et al. Reference De La Fuente, Diaz, Alvarez, Lauzurica, Caneque and Perez2007; Morel et al. Reference Morel, Janz, Zou, Purchas, Hendriks and Wilkinson2008).
Mean retinol and α-tocopherol concentrations for muscle meats, milk and eggs from the Food Standards Agency (2002) together with the range of values derived from recent literature (see Supplementary Material for details)

NR, no value reported.
Summary of responses to dietary supplementation
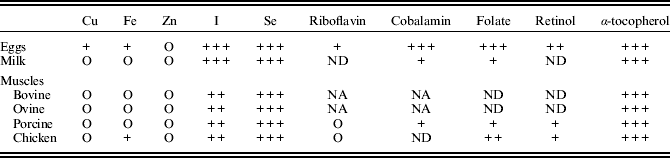
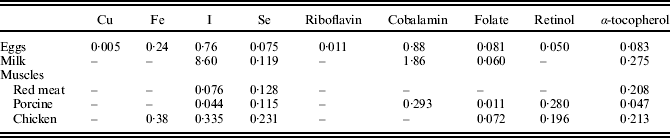
Table 6 summarizes the responsiveness of livestock products to dietary supplementation. General conclusions are, firstly, egg trace element and vitamin concentrations were more responsive than milk or muscle meats. Secondly, the trace elements Cu, Fe and Zn and the vitamins riboflavin and retinol were largely unresponsive, albeit in some cases based on limited evidence. However, the summary in Table 6 is only useful when intakes of livestock products are taken into account. Table 7 gives estimates for the increase in human intakes (expressed as a percentage of the RNI) that could be achieved if the micro-nutrient concentration in livestock products was increased by the average response possible from feed supplementation. Caution should be attached to these estimates as some increases in nutrient concentration were based on one study (for that reason, beef and lamb are combined and reported as red meat in Table 7). From Table 7, it can be seen that either individually or combined, increasing the nutrient concentration of livestock products could supply a substantial proportion of the RNI (<0·5 in most cases) for I, Se and all vitamins except for riboflavin, but would have little or no effect on Fe, Cu and Zn intakes. Therefore, evidence that the concentrations of these micro-nutrients could be selected genetically will now be addressed.
Summary of the responsiveness of livestock product trace element and vitamin concentrations to dietary supplementation

O, no effect; + to +++, increasing response to supplementation; ND, no data; NA, not applicable, ruminant supply is determined by biosynthesis within the rumen rather than feed supply.
Estimates of the increase (expressed as a proportion of RNI for an adult male) that could be achieved if the nutrient concentration in livestock products was increased by the supplementation of animal feeds by the average value reported in the literature

Estimates were made after the calculation of micro-nutrient intakes from Henderson et al. (Reference Henderson, Irving and Gregory2002) and the Food Standards Agency (2002).
GENETICS
Measurements of the heritability of trace element and vitamin concentrations in livestock products are scarce. The myoglobin (and therefore Fe) concentration of porcine longissimus dorsi has a moderate heritability (0·29; Newcom et al. Reference Newcom, Stalder, Baas, Goodwin, Parrish and Wiegand2004) and lamb muscle Fe and Zn, heritabilities of 0·21 and 0·84, respectively (Bennett & Field Reference Bennett and Field1985). Since blood concentrations can be expected to have an influence on tissue uptake, the heritability of blood concentrations could provide evidence of a genetic influence on product composition. A review (Wiener Reference Wiener1979) of early work on the heritability of mineral metabolism concluded that blood Cu concentration in cattle and pigs had a heritability of between 0·2 and 0·4. Subsequently, sheep have been selected on the basis of blood Cu (Woolliams et al. Reference Woolliams, Woolliams, Suttle, Jones and Wiener1986). Similarly, pig plasma Zn and Fe concentrations had heritabilities of 0·3–0·5 (Wiener Reference Wiener1979). One step more remote from product composition than plasma is the heritability of micro-nutrient concentration in other tissues whose effects, for example, on muscle concentrations would be difficult to predict. For example, ovine liver Cu concentration has heritability between 0·6 and 0·85 (Suttle et al. Reference Suttle, Lewis and Small2002).
Further evidence for genetic control of micro-nutrient levels in livestock products arises from differences between breeds, differences in product micro-nutrient concentrations obtained from different geographical backgrounds and diseases with a genetic component.
In relation to breeds, although the Cu concentration of liver in cattle and sheep varies between breeds (Suttle et al. Reference Suttle, Lewis and Small2002; Miranda et al. Reference Miranda, Cruz, Lopez-Alonso and Benedito2006), evidence for between-breed variation in muscle Cu, Fe and Zn concentrations is scarce: Hollo et al. (Reference Hollo, Nuernberg, Hollo, Csapo, Seregi, Repa and Ender2007) found no significant difference between cattle breeds in muscle Cu, Fe and Zn, but Zembayashi et al. (Reference Zembayashi, Lunt and Smith1999) reported differences in the muscle Fe concentration. In sheep (Bennett & Field Reference Bennett and Field1985), differences between breeds in both muscle Zn and Fe have been reported. In pigs, reports are inconsistent. Dannenberger et al. (Reference Dannenberger, Reichardt, Danier, Nuernberg, Nuernberg and Ender2007) and Newcom et al. (Reference Newcom, Stalder, Baas, Goodwin, Parrish and Wiegand2004) reported significant between-breed differences in muscle Fe, while Poto et al. (Reference Poto, Galian and Peinado2007) did not. While both Dannenberger et al. (Reference Dannenberger, Reichardt, Danier, Nuernberg, Nuernberg and Ender2007) and Poto et al. (Reference Poto, Galian and Peinado2007) reported breed effects on muscle Cu, only Poto et al. (Reference Poto, Galian and Peinado2007) found differences in Zn. For vitamins A and E, Irie et al. (Reference Irie, Inno, Ishizuka, Nishioka and Morita2006) and Hogberg et al. (Reference Hogberg, Pickova, Babol, Andersson and Dutta2002) found that between-breed differences in concentrations in fat, muscle concentrations were unaffected (Hogberg et al. Reference Hogberg, Pickova, Babol, Andersson and Dutta2002).
In studies using elemental fingerprinting of meat to differentiate geographical origins (Franke et al. Reference Franke, Haldimann, Reimann, Baumer, Gremaud, Hadorn, Bosset and Kreuzer2007, Reference Franke, Haldimann, Gremaud, Bosset, Hadorn and Kreuzer2008a) although Cu, Fe and Zn in poultry meat did not differ between regions, there was evidence for variation in beef Cu, Fe and Zn which may in part be related to genetic adaptation to differences in the prevailing soil mineral status.
Advances in understanding the molecular basis of inherited diseases related to micro-nutrients have led to the discovery of polymorphisms in the genes involved. Examples are polymorphisms implicated in haemochromatosis (Cairo et al. Reference Cairo, Bernuzzi and Recalcati2006), in Wilson's disease (Folhoffer et al. Reference Folhoffer, Ferenci, Csak, Horvath, Hegedus, Firneisz, Osztovits, Kosa, Willheim-Polli, Szonyi, Abonyi, Lakatos and Szalay2007) and a mutation in a Zn transporter gene (Chowanadisai et al. Reference Chowanadisai, Lonnerdal and Kelleher2006) which results in low-milk Zn in humans.
Thus, evidence exists for a genetic element in the variation in muscle Cu, Zn and Fe. However, it is sparse and has not been used for classical genetic selection. For riboflavin and retinol, there is little or no evidence of genetic variability. The growing literature on relevant polymorphisms implicated in disease susceptibility may provide an alternative strategy for selection. For example, retinol-binding protein polymorphisms (Goncalves et al. Reference Goncalves, Goncalves, Da Silva, Portela, Borges, Oliveira and Lovatto2008) are associated with prolificacy in pigs, but effects on tissue concentrations are unknown.
Finally, increases in all trace elements and vitamin concentrations in livestock products may not be desirable. Two examples can be given. Increases in muscle Fe are likely to result from increases in muscle myoglobin. This may have consequences for meat quality as myoglobin is the main red pigment in muscle and meat discolouration is due to the formation of met-myoglobin. Further, there is concern that red meat consumption is a risk factor for colono-rectal cancer and a recent expert report (Scientific Advisory Committee on Nutrition 2009) advocated that although evidence for a link between meat consumption and cancer risk was not conclusive, a reduced consumption of red meat would probably reduce the risk of colono-rectal cancer.
Because of concerns that excess vitamin A intakes are associated with increased risks of hepatotoxicity, bone fracture and teratogenicity, it has been suggested (Scientific Advisory Committee on Nutrition 2005) that due consideration should be given in the UK for reducing the vitamin A concentrations of poultry and livestock feeds to avoid excess vitamin A intakes through the consumption of liver.