THE PAST, PRESENT AND FUTURE OF ENGLISH DIALECTS
Trudgill (Reference Trudgill1990) made a distinction between Traditional and Mainstream dialects of English. Of the Traditional dialects, he stated (p. 5) that:
They are most easily found, as far as England is concerned, in the more remote and peripheral rural areas of the country, although some urban areas of northern and western England still have many Traditional Dialect speakers. These dialects differ very considerably from Standard English, and from each other.
Concerning the Mainstream dialects, he noted that they are primarily associated, in Britain, with the southeast of England, with urban areas, with areas were English has been introduced relatively recently (e.g., the Scottish Highlands), with younger speakers and “with middle- and upper-class speakers everywhere” (p. 6). Compared with the Traditional dialects of English, he suggested (p. 6) that “the Mainstream Modern Nonstandard Dialects differ much less from Standard English and from each other.” Trudgill (Reference Trudgill1990) defined the differences between dialects of English, Traditional and Mainstream, using carefully chosen, example phonetic and phonological features, and summarized the results of these analyses in two maps (pp. 34, 65), as well as in two trees (pp. 35, 67). Given the introductory nature of Trudgill's account of English dialect differences, this approach is perfectly understandable, but it does raise important questions about how we determine the relationships between varieties of a language. Thus we might question why Trudgill chose the features that he did and consider whether the results would be the same if an entirely different or larger set of features were to be analyzed. And we might also wish to explore other options for visualizing the relations between varieties, because the methods Trudgill used inevitably force divisions in what is essentially a dialect continuum (as Trudgill pointed out [pp. 6–7]) and are incapable of comparing Traditional and Mainstream dialects at the same time.
Trudgill also considered ongoing change and the future of English dialects in Britain. Comparing English in England with English in Australia, Trudgill suggested (p. 10) that there will never be the same dialect diversity in Australia due to the recent formation of the variety and the fact that the world has changed so much since then, in terms of transport and communication. Trudgill suggested that the kind of divergence seen in earlier stages of English and in other Germanic languages is unlikely to be repeated in Australia, and the same could just as easily be said for Mainstream dialects in England too. That is not to say that Trudgill believed varieties of English, in England or elsewhere, are currently converging to the point where regional differences will disappear. Instead, Trudgill envisaged a state of affairs, already apparent in some parts of Britain such as the southeast of England, where there is a “spreading out of urban dialect speech to form new dialect areas” (p. 81). Trudgill projected a possible course of development of English dialects along these lines in a map of “future dialect areas” (p. 83) which are focused on the major urban centers in England. Although Trudgill suggested that this future development may involve a degree of convergence between varieties at the regional level—so that, for example, Tyneside and Middlesbrough English become more similar (if not the same)—he is at pains to point out that this does not mean that everyone will soon end up speaking the same throughout England (p. 84):
It is certain that, whatever the exact form of future developments will be, there will never be total uniformity across the country, because innovations will always continue to spread and recede and thus continue to produce the rich mosaic of regional variation in pronunciation which has characterized England ever since English first became its language.
Trudgill painted a vivid and complex picture of variation and change in varieties of English in Britain. Not surprisingly, his account raises as many questions as it answers, including: How different were Traditional dialects of English compared with Mainstream ones, and what degree of convergence was there in the transition between them? Is this convergence still ongoing, or is something else happening to varieties of British Englishes? Are recent and widespread changes that seem to have their source in southeast England having an effect on the relationships between varieties? And are certain regional varieties remaining more distinct than others?
This paper is an attempt to demonstrate how we might go about answering some of these questions. In particular, it describes a method for the simultaneous comparison of many varieties of English at the phonetic level and for the quantification of differences between them. Before we describe the method, we first discuss a number of studies that have highlighted the complexities of change in British Englishes, the processes and motivations behind those changes, and the interpretations of them by linguists. In so doing, we hope to clarify the patterns that lie behind Trudgill's outline of change and to set the findings of our own analysis in context so that the patterns revealed can be better understood.
VARIATION IN CHANGE IN BRITISH ENGLISHES
Endogenous and exogenous change in Norwich
One locality that has been characterized by significant change throughout the 20th century is Norwich English in East Anglia, as discussed, for example, in Trudgill (Reference Trudgill, Foulkes and Docherty1999). Trudgill identified a wide range of changes in Norwich English in the second half of the 20th century and suggested that these changes have come about as a result of three different forces at work. These forces are:
1. Homogenization toward “a national mainstream,” which Trudgill identified “as the result of the influence of RP and of other varieties of English English generally” (p. 139). This homogenization mostly consists of redistribution of vowel phonemes, such that their lexical distribution more closely matches Received Pronunciation (RP) and London English (p. 137), and perhaps some vocalic phonetic changes (p. 138).
2. Homogenization between (nonstandard) varieties of English which is “bringing Norwich English into line with other regional accents” (p. 140). Changes of this type include H-dropping, TH-fronting, and labiodental pronunciation of /r/.
3. Endogenous change—changes that are absent “from RP and from neighbouring dialects” and which are “spontaneous” and “internally produced” (Trudgill, Reference Trudgill, Foulkes and Docherty1999:134). These changes largely affect the vocalic system (pp. 134–135).
Depending upon their relative importance, these three kinds of change are likely to have different implications for the development of Norwich English and its relations with other varieties of the language. If homogenization toward “a national mainstream” predominates, Norwich English is likely to become less distinctive from other varieties and from RP English. If homogenization of Norwich English with other regional varieties of English predominates, a similar loss of distinctiveness may result, although things may in fact be more complex than this, as the studies discussed in the following sections indicate. If endogenous changes were to predominate, it is possible that Norwich English would diverge from other varieties of English. Much of this paper will involve discussion of how we determine the overall effects of these kinds of change.
Regional dialect leveling
On a wider geographical scale, Kerswill and Williams (Reference Kerswill, Williams, Foulkes and Docherty1999) examined the accents of three localities in England (Milton Keynes, Reading, and Hull), and suggested (p. 149) that the three varieties are, to a certain extent at least, converging “in both inventory and realisations,” while they are, at the same time, retaining features that distinguish them (especially Hull in the north). They call this process dialect leveling, which they define (p. 149) as “a process whereby differences between regional varieties are reduced, features which make varieties distinctive disappear, and new features emerge and are adopted by speakers over a wide geographical area.”
Kerswill (Reference Kerswill, Britain and Cheshire2003:223) suggested that there are two separate processes at work in dialect leveling—the first is geographical diffusion of linguistic features, and the second is leveling of variants as a result of mutual convergence between speakers of different varieties. The result of both of these processes is what Kerswill (Reference Kerswill, Britain and Cheshire2003:223) called, more specifically, regional dialect leveling. An example of geographical diffusion is the rapid spread of TH-fronting throughout Britain in the second half of the 20th century (see Kerswill, Reference Kerswill, Britain and Cheshire2003:230–237, and the discussion of Innovation diffusion in the Fens).
Kerswill (Reference Kerswill, Britain and Cheshire2003) identified change in the pronunciation of the FACE lexical set in the northeast of England as a likely case of leveling. In both Tyneside and Durham, the FACE lexical set may be pronounced with the diphthong [ɪə] or the monophthong [eː] (see also the discussion of Dialect leveling in Tyneside). [ɪə] is highly localized whereas [eː] is characteristic of a much larger geographical area (northern England and Scotland). In both locations, [ɪə] is characteristic of (older) working-class male speech, and Kerswill suggested that this highly localized variant is subject to leveling, leading to the variant [eː], which is shared by other varieties, becoming the predominant variant. Unlike geographical diffusion, Kerswill suggests that one feature of leveling is that leveling changes establish themselves “simultaneously throughout a given region” (p. 224).
An important aspect of regional dialect leveling is that it is, as its name suggests, conceived of as a regional rather than a national (or indeed international) phenomenon. Although regional dialect leveling can, given the right circumstances, happen anywhere, the effects of any one instance of it are likely to be felt in a relatively small geographical area. As an example of this, Kerswill (Reference Kerswill, Britain and Cheshire2003) and Torgersen and Kerswill (Reference Torgersen and Kerswill2004) highlighted the convergence of the entire short vowel system in two varieties of southeastern English (Ashford and Reading) which were formerly characterized by rather different pronunciations of their short vowels.
Nevertheless, many changes implicated in regional dialect leveling, both of the geographical diffusion type (e.g., TH-fronting) and of the leveling type (e.g., replacement of localized vowel pronunciations), are shared by a wide geographical spread of varieties of British English. The effects that some of these changes have when confronted with rather different, regional phonological systems, and the overall consequences of regional dialect leveling and how we might determine this are discussed below.
Dialect leveling in Tyneside
Watt and Milroy (Reference Watt, Milroy, Foulkes and Docherty1999) and Watt (Reference Watt1998, Reference Watt2000, Reference Watt2002) examined changes in the pronunciation of the vowels in the FACE and GOAT lexical sets in Tyneside English in northeast England. They identified three variants of FACE and four of GOAT: traditional variants [ɪə] and [ʊə] (and possibly [ɵː]); variants [eː] and [oː], which are characteristic of much of northern England and Scotland; and [eɪ] and [oʊ], which are really only characteristic of the speech of middle-class speakers. In an “apparent time” analysis of their data (for an overview, see Bailey, Reference Bailey, Chambers, Trudgill and Schilling-Estes2002), Watt and Milroy (Reference Watt, Milroy, Foulkes and Docherty1999:41) identified a “reduction in variability across two generations; localised variants either disappear or are reduced in number and younger speakers prefer mainstream, unmarked variants.” In effect, this means that highly localized [ɪə] and [ʊə] are disappearing, and pan-northern [eː] and [oː] are becoming the default pronunciations of FACE and GOAT in Tyneside English. The picture is somewhat complicated by an increased use of the (seemingly traditional) vowel [ɵː] in GOAT among the younger middle-class males and the introduction of [eɪ] and [oʊ] which are typical of Midland and southern English accents (including RP) in middle-class speech.
Watt and Milroy (Reference Watt, Milroy, Foulkes and Docherty1999:25) ascribed these changes to a process of “dialect leveling” in Tyneside, whereby “variants characteristic of a larger area than the Tyneside region appear to be spreading at the expense of extremely localised variants.” They consider this dialect leveling to be a consequence of the disruption of “close-knit, localised networks which can be shown to maintain highly systematic and complex sets of socially structured linguistic norms” (Watt and Milroy, Reference Watt, Milroy, Foulkes and Docherty1999:26).
The effect of this disruption is the “eradication of socially or locally marked variants” (ibid.). This leveling is not the whole story, however. Watt and Milroy (Reference Watt, Milroy, Foulkes and Docherty1999:42) remarked on how sharp gender differences are still maintained despite the overall reduction in variation, and note that, although these developments in Tyneside English may be part of the establishment of a leveled, koiné variety characteristic of northern England, this does not mean that the variety that has developed is in any sense “pan-English” (p. 43). Furthermore, some young speakers use what look like traditional forms “as a symbolic affirmation of local identity” (p. 37). As Foulkes and Docherty (Reference Foulkes and Docherty1999:13) put it, “there appears to be a tension between speakers' desire to continue signalling loyalty to their local community by using local speech norms, and a concurrent urge to appear outward-looking or more cosmopolitan,” a tension that is summed up very nicely by Watt (Reference Watt1998:7) as a desire to “sound like northerners, but modern northerners.”
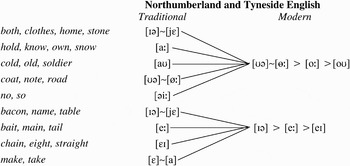
It is worth pointing out at this stage that the developments Watt and Milroy identified in FACE and GOAT are only the latest stages in a long history of change. Examination of traditional dialect data for the northeast of England from the Survey of English Dialects (Orton, Sanderson, & Widdowson, 1962–1971, henceforth SED) and from Rydland (Reference Rydland1998) suggested that both of these lexical sets have been subject to considerable reorganization in terms of the lexical distribution of phonemes—or, in the words of Trudgill (Reference Trudgill, Foulkes and Docherty1999:136–137), “lexical redistribution” or “dedialectalisation.” Figure 1 illustrates the considerable lexical redistribution that fed into the patterns identified by Watt and Milroy.
The development of the FACE and GOAT lexical sets in northeast England.

This radical reorganization of the lexical incidence of phonemes was not random. The highly localized lexical distribution of phonemes in the traditional dialects has been transformed into one which is shared over a much wider part of the English-speaking world and which is much closer to standard varieties of English (see Maguire, Reference Maguire2009). Certainly this looks like an instance of dialect leveling, although it is not clear that this is the same kind of process as the change from [ɪə] to [eː], which does not affect the lexical incidence of phonemes in the variety.
Thus in Tyneside English, we have, for these features at least, a long history of change, involving lexical redistribution of phonemes, reduction in highly localized variants, adoption of pan-regional variants and of (perhaps standard) variants from further afield, combined with reinterpretation of local features for the projection of particular identities. These changes have happened at different periods and need not all have had the same influence on the relationships between Tyneside English and other varieties of English. How we might more fully come to understand the nature of these changing relationships is discussed further in Consequences of Change.
Innovation diffusion in the Fens
Britain (Reference Britain2005) examined the effects of the diffusion of changes from southeast England into the Fenlands of eastern England. Although he suggested (p. 999) that “Within the core of the southeast, it is probably true that regional dialects are losing their distinctiveness as the dialect mixing becomes ever more intense— thanks to very high levels of social and geographical mobility in the area,” he questions whether this loss of distinctiveness is inevitable in peripheral dialect areas such as the Fens. Although a wide range of consonantal and vocalic changes are spreading to this area, Britain suggested that the effects of these changes might be rather different when they are introduced to areas characterized by phonological patterns not found in the southeast of England.
In order to illustrate this difference, Britain examined innovations in four consonantal variables and five vocalic variables in three Fenland locations (Spalding in the west, Terringtons in the east, and Wisbech/March in the central Fens). He found that all of these innovations except STRUT-fronting are found in the Fens, but the three locations typically differ in the extent to which they are present. More strikingly, Britain found that the innovations produce rather different results in the three locations depending upon pre-existing local phonological patterns. For example, L-vocalization is much less advanced in the east where clear /l/ was a traditional feature of the dialect (even though it is not for young speakers today). Similarly, open onset and monophthongal pronunciations of the PRICE vowel, though found everywhere, are only found before voiceless consonants in the central and eastern locations because these areas (but not Spalding in the west) are characterized by a “Canadian Raising” type alternation. The result of this innovation is that in the west [ɑɪ] ~ [ɑː] can occur everywhere, but in the center and east, the difference between the variant before voiceless consonants (typically [əɪ]) and the variant before voiced consonants and morpheme boundaries (where [ɑɪ] ~ [ɑː] is possible) has been accentuated.
But what are the consequences of these changes for relationships between the Fenlands varieties and between all of these and varieties in the southeast of England? Britain observed that changes in the consonantal system such as TH-fronting may well have no overall effect on the similarities of different varieties because they all shared [θ] before the change and all share [f] after it. It might be argued that the varieties in the Fens are becoming more similar to varieties in southeast England as a result, but even these varieties once had [θ] (see Kerswill, Reference Kerswill, Britain and Cheshire2003, for evidence from the SED), so it could be argued that the Fens are simply catching up with a change that does not affect overall relations between varieties in the long term. Although all three Fenland varieties have introduced the same kinds of changes to their vowel systems, these changes have affected each differently, depending upon the pre-existing phonological patterns in the variety. The continued (and increased) distinctions between the prevoiced and prevoiceless variants of PRICE and of the MOWN and MOAN subsets of GOAT in the central and eastern varieties suggest to Britain that “innovations don't just overwhelm and obliterate local varieties, but, engaging in contact with them, often produce compromise outcomes, showing evidence of the interaction of the innovation with the traditional local form” (Britain, Reference Britain2005:1017). Because the varieties (particularly the eastern and western ones) also differ across a whole range of phonological and morphosyntactic variables, it appears to be the case that “at the end of the twentieth century, extensive diffusion coexisted alongside local and regional differentiation” (Britain Reference Britain2005:1017).
Innovation and maintenance in Glasgow
Stuart-Smith (Reference Stuart-Smith, Corbet and Stuart-Smith2003) and Stuart-Smith, Timmins, and Tweedie (Reference Stuart-Smith, Timmins and Tweedie2006, 2007) examined the incorporation of phonological features of nonlocal origin alongside the maintenance of traditional dialect features in the urban dialect of Glasgow in Scotland. Although they identify a number of features that seem to have their origin outside of Glasgow—for example TH-fronting and “Cockney-style” L-vocalization (in words such as feel and milk)—these are used alongside traditional dialect features such as monophthongal /ʉ/ in the MOUTH lexical set and traditional “Scots” L-vocalization (in words such as all and hold).
Stuart-Smith et al. found that younger working-class speakers combine use of features of exogenous origin with continued (and in some cases increased) use of traditional Scots features. In light of this complex pattern of variation and change in Glasgow, Stuart-Smith et al. (Reference Stuart-Smith, Timmins and Tweedie2007:248) commented that:
Taking Glaswegian in the overall U.K. context, we might think that this is dialect levelling in its broadest sense (Kerswill, Reference Kerswill, Britain and Cheshire2003), and in time, this may be the outcome. But there are also important differences, both in the ideological processes involved … and linguistically, for example, in the healthy retention of local non-standard variants … initial analysis of Scots lexical variation as represented by Scots /ʉ/ in the OUT set (oot for out), also reveals strong maintenance of the vernacular in the same speakers … and we suspect that similar results could follow from analysis of further vowels.
A number of issues are identified as important in this mixing of new and traditional features, including projection of a young, local, working-class Glaswegian identity and a rejection of middle-class practices and values. This involves “healthy” retention of localized phonetic and phonological patterns alongside reinterpretation of patterns of (probable) exogenous origin as manifestations of localized speech and is giving rise to an urban variety for which the terms “Scots” and “Scottish Standard English” hardly seem appropriate.
Consequences of change
It is clear from the previous discussion that changes in British English have been far-reaching and complex. But it less clear what effect these changes have had on the relations between varieties of English. Despite these varieties sharing many changes, they have not all become the same. Although there is some evidence of convergence, particularly at the regional level, it remains to be seen whether this is so throughout Britain. As was discussed, the kinds and proportions of different changes will have an important influence on the relations between varieties. If endogenous changes predominate, divergence is likely, assuming that the same changes do not spread to other varieties. If, on the other hand, the same exogenous changes affect different varieties, convergence might be the outcome if those changes predominate. But as the studies discussed indicate, this need not be the case: diffusing changes such as TH-fronting may simply replace one set of patterns with another without any net convergence; the effects of exogenous change may only be at the regional level; and incoming changes may interact with existing phonological patterns to give rather different outcomes in different locations. On the other hand, the leveling of localized patterns at different locations is undoubtedly going to affect the relationships between varieties.
As was discussed, Kerswill (Reference Kerswill, Britain and Cheshire2003) suggested that the exogenous changes involved in regional dialect leveling may lead to convergence between varieties. In particular, he noted (p. 239) that:
The overall picture supports the view that regional dialect levelling is widespread in Britain. Few researchers have been able to demonstrate its opposite— divergence or diversification— in local varieties.
Although Kerswill contrasted regional dialect leveling with divergence, there may be another scenario that Kerswill does not allude to here, one that involves neither convergence nor divergence—to use the language of local government elections, no overall change. Is it possible for there to be neither convergence or divergence, but a maintenance of the status quo? That is, might varieties, through a combination of endogenous and exogenous changes, remain relatively equidistant from each other, even though the details change considerably? The case studies discussed suggest that this might be possible (although we cannot tell for sure). If this is indeed the case, this would be a major factor in the maintenance of dialect distinctiveness in languages without the emergence of distinct new languages. We label this kind of change dynamic equilibrium.
So although exogenous changes may contribute toward convergence, and although endogenous changes may contribute toward divergence, it is the overall effect of a range of changes on a range of varieties which affects the degree of similarity between them. It is possible that various kinds of change may combine and “cancel each other out,” at least in terms of the overall relationships between varieties. A key point that arises from the preceding discussion is that we cannot diagnose divergence, convergence, or dynamic equilibrium through the examination of a small number of changes, because other changes may be of an entirely different sort. It is obviously not possible to identify changes in relationships between varieties without comparing more than one variety. In order to determine the nature and direction of changes in relationship between varieties, we suggest that the following steps are necessary:
1. A wide range of features must be compared at the same time, and these features should not be selected simply because we judge them to be important; in other words, the true significance of particular changes can only be determined in the context of other patterns of variation and change.
2. A wide range of geographical varieties need to be compared with each other so that we can determine whether change is regional, national, or international.
3. Data that allow us to assess change in “real” or “apparent time” should be included, otherwise we will only be able to reveal a synchronic picture of the relationships between varieties.
4. The global similarity of different varieties to each other should be quantified so that an objective assessment of the degree of convergence, divergence, or no overall change can be properly appreciated.
Thus we argue that to determine whether divergence or convergence (or neither) have taken place it is essential that we develop methodologies that look beyond a single geographical location and a particular set of features that may or may not be important for defining overall relationships between varieties. In this way, we suggest, we will be able to assess the extent to which Trudgill's model of change, from Traditional dialects, to Mainstream accents, to urban-focused varieties, is a realistic representation of the development of British Englishes. In the rest of this paper, we outline a method for doing precisely this and examine what it can tell us about changing relationships between varieties.
A METHOD FOR COMPARING PHONETIC SIMILARITY
In Heggarty, McMahon, and McMahon (Reference Heggarty, McMahon, McMahon, Delbecque, van der Auwera and Geeraerts2005), McMahon and McMahon (Reference McMahon and McMahon2005), and McMahon, Heggarty, McMahon, and Maguire (Reference McMahon, Heggarty, McMahon and Maguire2007), a new method for comparing the phonetic similarity of different varieties of the same language and of different languages was introduced. This method shares with other dialectometric methods a concern with quantifying the similarities and differences between varieties in an objective way, but it differs from methods such as that described in Nerbonne, Heeringa, and Kleiweg (Reference Nerbonne, Heeringa, Kleiweg, Sankoff and Kruskal1999) and Nerbonne and Heeringa (Reference Nerbonne and Heeringa2001) in that it prioritizes linguistic accountability over computational simplicity. This method measures the similarity of (segmental) phonetic transcriptions of a list of cognate words. A full description of this method can be found elsewhere;Footnote 1 in summary, this approach has four steps:
1. Phonetic transcription of a list of cognate words in the varieties being compared.
2. Comparison via a slot-matching mechanism that uses a node form to inform us as to which parts of each transcription should be compared with which.
3. Application of a phonetic similarity algorithm, which compares the phonetic transcriptions for each variety with each other and computes their similarity based on an assessment of the relative distance between segments in multidimensional phonetic space.
4. Representation of the resultant distance matrix using trees and networks, in particular the phylogenetic software program NeighborNet (see Huson & Bryant, Reference Huson and Bryant2006; for applications to linguistic data, see Heggarty et al., Reference Heggarty, McMahon, McMahon, Delbecque, van der Auwera and Geeraerts2005; McMahon & McMahon, Reference McMahon and McMahon2005; McMahon et al., Reference McMahon, Heggarty, McMahon and Maguire2007; and Investigating multidimensional relationships below).
This method is particularly well suited to analyses of the sort desired here because it is capable of comparing numerous varieties of a language at the same time (e.g., RP with Tyneside, RP with Liverpool, RP with Glasgow, Tyneside with Liverpool, Tyneside with Glasgow, Liverpool with Glasgow). The resulting distance matrix (expressed in percentage terms for each possible pairwise comparison between the varieties) can be interrogated in various ways to reveal the (changing) relationships between varieties. In the following sections, we discuss a number of issues that were not covered in the previous papers, because they are the result of further developments to the method, developments which should help us to answer the questions posed at the beginning of this article.
The word list
As the preceding discussion indicates, it has been our aim to collect data from a wide range of geographical locations throughout the British Isles (and beyond, although we do not report on that here) to determine the relationships between varieties of English (and its Germanic relatives). As was noted in in the introduction to this article, it is essential that such a comparison avoids preselection of features, because this would give us at best a limited insight into the relationships between the varieties, and at worst leads us into a kind of self-fulfilling prophecy whereby we find that the features selected for analysis are exactly those that appear to be important.
Because the method requires the analysis of strictly comparable data, and because strictly comparable data are all too often hard to come by for modern varieties of English,Footnote 2 it was decided to collect these data from scratch. Given that we hoped to cover a wide range of varieties of English and other Germanic languages, and given that our method requires the comparison of (Germanic) cognates, the most straightforward and feasible way of getting the data we required was by using a word list. A representative phonetic transcription of this word list was required for each geographical data location.
The word list wish list
In using a word list for comparative purposes, it is essential that the words on that list have not been selected to give us the “best” results because, prior to analysis, we cannot be sure which features or, more likely, combinations of features are most significant in determining the overall relationships between varieties (cf. the discussion of Trudgill's analysis of English dialects).
This does not mean, however, that the members of the word list were selected at random. Two (related) aspects of our methodology demand that only certain kinds of words may be compared in the first instance:
1. The comparison mechanism requires that all of the words compared are cognates in all of the varieties analyzed.
2. As it is our intention to develop a method that is applicable beyond varieties of English—so that, for example, (varieties of) English can be compared to (varieties of) German—these cognates must be shared by English and its Germanic relatives (see McMahon & McMahon, Reference McMahon and McMahon2005, and McMahon et al., Reference McMahon, Heggarty, McMahon and Maguire2007, for further details).
Therefore, it follows that all words in our cognate list stem from the inherited Germanic lexicon; indeed their original Proto-Germanic forms stand as a “node-form” through which we can match up their modern phonetic reflexes precisely, to ensure that we are comparing “like with like” between all the present-day varieties (see McMahon et al., Reference McMahon, Heggarty, McMahon and Maguire2007:120).
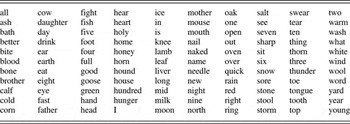
Because our method depends crucially on the comparison of cognates across a wide range of Germanic varieties (including regional dialects of many languages), this considerably restricts the number of possible cognates, because not all are attested in every variety. Additionally, because we seek to measure the phonetic similarity of these cognates in different Germanic varieties, we have sought to avoid cases where differences have arisen as a result of morphophonemic or morphological differences, in Proto-Germanic or subsequently. Thus a word such as water is excluded because the Scandinavian languages reflect the Proto-Germanic stem *watnan whereas the West Germanic languages reflect the Proto-Germanic stem *watar (Orel, Reference Orel2003:451). The result is a reduced population of cognates that may be sampled for our word list. The full word list is reproduced in Table 1.
The word list

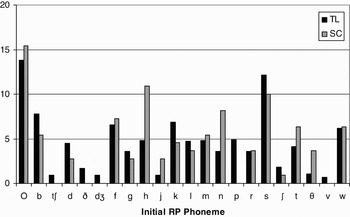
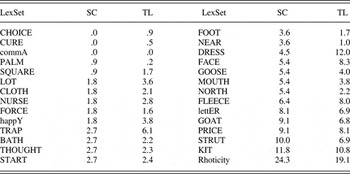
This desire for the widest possible applicability of the method across Germanic cognates was an important determiner of the choice of words for our word list, and one that acted without reference or bias toward features traditionally favored for categorizing varieties of English (and other Germanic languages), so that preselection of features was not an issue. Within the constraint of needing to compare cognates, we adjusted the particular selection in order to try to bring the frequency of particular phonological features in our word list close to being representative of the English lexicon. This was done by comparing the frequency of selected phonological features (in particular initial consonants and stressed vowel phonemes) in our word list with a standard word list—the Thorndike and Lorge (Reference Thorndike and Lorge1944) list of the 1,000 most frequent words in a range of English texts from both sides of the Atlantic. This word list was chosen for comparison because it is entirely independent from our own and contains a wide selection of fairly basic (often Germanic) vocabulary. The frequency of particular features in our word list and in the Thorndike and Lorge word list are compared in Table 2 and Figure 2.
Comparison of the frequency of RP initial phonemes in the Sound Comparisons (SC) and Thorndike and Lorge (TL) word lists.

The percentage of Wells' lexical sets in the two word lists

SC = Sound Comparisons; TL = Thorndike and Lorge.
The comparison of the percentages of each of Wells' lexical sets (Wells, Reference Wells1982) reveals that the two word lists match well.Footnote 3 The discrepancies that do exist may well be attributable largely to the etymological restrictions placed on our word list (entirely Germanic in origin, with no French loans). Similarly, Figure 2 reveals that the frequency of initial consonant phonemes in the two word lists is roughly comparable, with some obvious differences (e.g., /p/ and /h/) being the result of our word list containing only words of Germanic origin.
Thus despite their different origins and intentions, these two word lists are very similar in terms of the frequency of stressed vowel and initial consonant phonemes, which suggests that our word list is a reasonable representation of the sound patterns of English. Furthermore, the quid pro quo for any minor discrepancies is the major boon of being able to extend our comparisons across all Germanic languages and dialects (see Heggarty, McMahon, & Maguire, forthcoming).
Data collection and transcription
Following considerable success, albeit with a much smaller sample, in the pilot project reported in McMahon and McMahon (Reference McMahon and McMahon2005) and McMahon et al. (Reference McMahon, Heggarty, McMahon and Maguire2007), it was initially felt that the best way to get data for a range of varieties of English was to approach experts in particular dialects and ask them to provide us with transcriptions that would be representative of the working-class accents found at particular locations. This approach provided us with data for London, Norwich/Norfolk, Sheffield, Liverpool, Glasgow, Shetland, and Dublin.Footnote 4 Although these data were very much what we required, and are included in our analysis, there were a number of issues with this approach to data collection that meant that we moved away from it in favor of collection of primary data ourselves. Firstly, and perhaps most importantly, it proved difficult to find experts in a wide enough range of varieties of English to give us a sizable sample. In many cases, much was known about particular features in a given accent but, pending further research, it proved difficult to find experts who were confident in providing accurate transcriptions of our full word list in particular accents. This was even more of a problem in out of the way areas where research on modern accents (as opposed to traditional dialect research from the middle of the 20th century) has still to be done in any form. Secondly, the transcriptions received in this way were, despite the best efforts of the contributors, rather diverse in their interpretation of our transcription requirements, such that some transcriptions were more detailed and others were more normalized. The result of this was that all of these transcriptions had to be given a second pass by our research team to iron out “transcriber isoglosses” and to standardize details and methods of transcription. This was not always easy, despite being done in discussion with the contributors, and it was felt that this process added an extra level of subjectivity which might be avoided were other methods of data collection to be employed.
Because of these issues, it was decided that data should be collected directly (although the data we had received from intermediary experts were not rejected). Audio recordings were made of native speakers of varieties of interest reading the word list. Although it was intended that these speakers should be representative of their respective varieties, lack of research in some areas meant that their representativeness or otherwise had to be gauged by the fieldworker.
Once the data had been collected, a narrow segmental phonetic transcription was made by a single specialist in English dialectology and phonetics (the lead author of this paper) to avoid transcriber isoglosses.Footnote 5 Details of the transcription procedure and example transcriptions can be found on the Sound Comparisons website.Footnote 6
It is clear that readings of word lists are never going to be the same as vernacular speech, but by the same token, nor are they a necessarily inaccurate reflection of (a subset of) the linguistic patterns present in the speech community. Some examples from our data indicate the kinds of vernacular patterns that, perhaps unexpectedly, surfaced in readings of word lists by working-class native speakers. With reference to H-dropping, for example, speaker JB (F, born 1962) from North Devon dropped [h] twice in the 12 H-initial words, whereas speaker SA (M, born 1968) from Rossendale in Lancashire dropped [h] in all H-initial words. Speaker SW (M, born 1988) from Tyneside likewise produced a high number of highly vernacular forms in his reading of the word list, including seven tokens (out of nine) with [f] for historical /θ/, [ä] in all and father, and [øə] in snow and toe. Many other speakers produced equally localized pronunciations, suggesting that for many speakers reading need not necessarily suppress the vernacular—see Stuart-Smith et al. (Reference Stuart-Smith, Timmins and Tweedie2007:241–242, 247) for discussion of a similar finding. In any case, because we are comparing like with like, any effect of reading on the kind of speech produced should not affect the overall results.
Incorporating social variation—the subvarieties
Much sociolinguistic research makes it clear that an analysis of the structured variation in the speech community is necessary to identify change in “apparent time” (see any of the studies referred to in the introductory section of this article, for example). Given that we wished to cover a wide range of geographical varieties of English in the most economical way possible (using a word list), it is also clear that the same depth of analysis of social variation in each speech community would not be possible. Nevertheless, we wished to capture diachronic variation to a certain extent, because it is precisely this kind of variation that gives us insights into the changing relationships between varieties. We therefore decided to gather, in many of our regional locations, not just one but multiple recordings, categorized in broad subvarieties, to provide some insight into apparent time change in modern English. We have labeled these subvarieties “Typical,” “Traditional,” and “Emergent,” each of which is defined in turn.
The Typical subvariety
Although there is undoubtedly considerable variation among speakers at any given location, it was assumed that relative to other locations it is possible to find speakers who are typical, in terms of their speech patterns, of their speech community. For our purposes, we defined such speakers as locally born and resident, working-class, and aged between 30 and 55 years. Where only one representative speaker was recorded in the locality, a phonetic transcription of that speaker's word list reading was used in our comparison; when more than one speaker was recorded at a location, a single representative speaker was transcribed or, in cases where there was noticeable variation between speakers, a composite transcription was made that included the most typical pronunciation form of each word. We consider our Typical subvarieties to be roughly equivalent to Trudgill's Mainstream dialects.
The Traditional subvariety
The first author of this paper grew up in rural County Tyrone in Northern Ireland, has lived most of his adult life in Newcastle Upon Tyne in northeast England, and currently works in the University of Edinburgh in Scotland's capital city. In all three of these (rather different) locations, he has regularly encountered (and continues to encounter) traditional dialect pronunciations of a sort familiar from traditional dialect surveys but which are often peripheral to modern sociolinguistic studies. These are, as might be expected, most typical of (and sometimes exclusive to) working-class, (older) male speech. Obvious examples include [ɜʉl] ‘old’ and [ët] ‘eat’ in Tyrone, [niˑt] ‘night’ and [uˑt] ‘out’ in Newcastle, and [ɡïd] ‘good’ and [meˑəɾ] ‘more’ in Edinburgh.Footnote 7 But these are precisely the kinds of pronunciations that are so deeply embedded in the vernacular that they (almost) never surface in word list readings. Nevertheless, it is clear that these kinds of pronunciations form a part of the speech of speakers in many locations across the British Isles, and indeed are particularly salient. In addition, it may be assumed, given that these kind of forms have a long and consistent recorded history, that they represent survivals of older speech patterns which were once more typical of local working-class populations. As such, and because the data available to us from traditional dialect surveys such as the SED are not compatible with our word list or transcription methods, it was decided that an attempt would be made to gather, where possible, traditional dialect pronunciations of this sort at many of the locations surveyed in this project. However, because traditional dialect pronunciations are typically suppressed in the reading of word lists (see, for example, Harris, Reference Harris1985:243), alternative means of elicitation were required in order to gather these data. To overcome this problem, the following approach was adopted:
1. Speakers who were likely to have good fluency in traditional dialect pronunciations were sought out (usually older working-class males).
2. These speakers were engaged in general conversation to set them at ease and to gauge how “traditional” their speech was.
3. They were asked to read the word list without any prompting as to what was required—most did so in a “nontraditional” accent (but see the following discussion).
4. Speakers were then asked if they had “broader” pronunciations for these words, and an obvious test example was used (e.g., “Do you have a ‘broader’ pronunciation of the word ‘old’?”); most of these speakers responded well to this approach.
5. Assuming that the nature of the task was understood, the speakers were asked to read the word list again, but using these broad, local alternative pronunciations.
6. If speakers missed anything obvious, the interviewer returned to these words and asked if any other pronunciations were known; this usually was met with replies such as “Oh aye, ….”Footnote 8
7. In a few instances, traditional pronunciations known to the interviewer from previous descriptions were not elicited, and the speaker was asked directly (after the preceding methods had been exhausted), “Have you ever heard anything like …?”. It was usually immediately obvious whether or not the speaker was familiar with the pronunciation in mind.
This approach is similar in many respects to methods used in traditional dialect studies (e.g., Mather & Speitel, Reference Mather and Speitel1986; Rydland, Reference Rydland1982), but note also the adherence to this pattern of questioning (but see the following), designed to avoid unnecessary priming of the speakers.
The confidence some speakers had in identifying their “broader,” “local” pronunciations was often striking. One speaker from northern County Antrim produced, without prompting, doublets of many words, exemplifying his more standard Ulster English pronunciations and his traditional Ulster Scots forms, despite denying that he spoke “Ulster Scots.” Pairs produced included [bɹʌðɚ] ~ [bɹ ðɚ] ‘brother’, [kʰɐʏ] ~ [kʰʉː] ‘cow’, [f
 ðɚ] ~ [fɛˑðɚ] ‘father’, [fʏt] ~ [f
 t] ‘foot’, [hɛːd] ~ [hid] ‘head’, [hoˑm] ~ [heˑm] ‘home’, [hɐʏs] ~ [hʏs] ‘house’, [hʌndɹət] ~ [hʌnɚ] ‘hundred’, [wʌn] ~ [j
 n] ‘one’, [j
 ːɹd] ~ [jɚːd] ‘yard’. Another speaker, from Hawick in the Scottish Borders, read the word list only in her broadest Scots and seemed reluctant to read it any other way. Perhaps most instructive of all, and typical of many speakers who have comfortable command of traditional dialect pronunciations alongside more standard ones, was an older male speaker from the West End of Newcastle Upon Tyne, who, when asked to read the word list, said the following:
[Speaker]: Well I'll say them what I … you know, I'm not being broad or nowt, I'll not say them me eh … I'll just say the way I talk [tʰäːk].
[Interviewer]: Just the way you, just the way you
[Speaker]: The way I would talk [tʰäːk] to me mates. I mean to talk [tʰɔːk] to you, I would say all this [ɔːl  ɪs]. If I was talking
 to me mates I would say all [äːl].
[Interviewer]: OK.
[Speaker]: You know what I mean? Footnote 9
This speaker then proceeded to produce a range of traditional Tyneside dialect pronunciations and engaged in a running commentary on what was possible and what was not (e.g., Now, sometimes I would say …), blurring the line between reading the word list as he might read aloud generally and reading it as he might pronounce the words in more informal circumstances.
Thanks to this method it was possible to compile a word list that represented the traditional dialect end of the spectrum for many locations. We consider this Traditional subvariety to be equivalent to Trudgill's Traditional dialect type. Note that these pronunciations are best thought of as “potential” rather than actual (see Mather & Speitel, Reference Mather and Speitel1986:xii, for a discussion of this issue), for although it was the intention to collect forms still used by the speakers, no attempt was made to gauge how frequent these variants were in any particular individual's speech. Nor is it our assumption that this version of the word list in some sense represents the “actual” way these speakers talk; rather it represents one part of a continuum of variation in the speech community, a part which may well represent the final stages of the move away from traditional dialect in Britain and elsewhere.
The Emergent subvariety
As one of the aims of this research is to determine whether recent changes in British English have affected the relationships between varieties, it was deemed necessary to sample the speech of younger speakers at our locations where this proved possible. These younger speakers, either male or female, were working-class, local in birth and residence, and aged between 16 and 25 years. Note that these speakers were not chosen on linguistic grounds, so that in some cases (e.g., Berwick) their speech did not differ dramatically from their older counterparts, whereas in others (e.g., Edinburgh) they did. The subvariety sampled from these younger speakers has been labeled Emergent, even if in practice it transpired to be fairly similar to the Typical subvariety for the same location, precisely so the two can then be compared. We consider our Emergent subvarieties to be roughly equivalent to Trudgill's urban-focused incipient varieties of English.
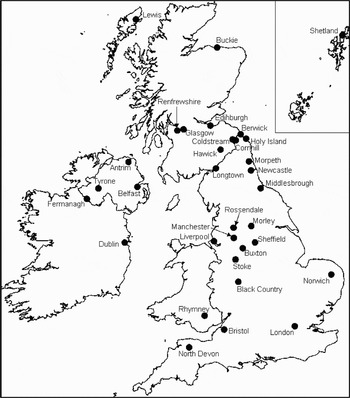
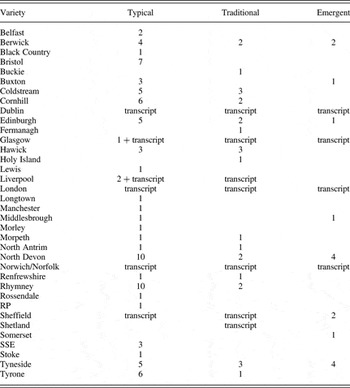
Table 3 summarizes the number of speakers recorded for each subvariety at each location in the British Isles. Note that in some instances, especially where informants were few in number, a single speaker may have provided both Typical and Traditional versions of the word list. The geographical locations of these data points are indicated in Figure 3.
Localities surveyed in the British Isles.

Speakers and subvarieties per location

“Transcript” refers to phonetic transcriptions provided by experts in the dialects concerned; see text for details.
In the following section, we examine the results of the comparison of these varieties. The inclusion of more than one subvariety for many locations means that it is possible to examine the differential relationships between them and, in so doing, to begin to assess whether the relationships between varieties of English are changing in apparent time.
RESULTS
The result of the comparison between these varieties of English is a matrix expressing the percentage similarity (or conversely, difference) between each pairwise comparison. These similarity matrices (see McMahon et al., Reference McMahon, Heggarty, McMahon and Maguire2007:126, for an example) require further interrogation and manipulation for the patterns within them to be revealed. In Similarity of varieties to RP, we analyze one dimension of the data—the similarity of the Typical, Traditional, and Emergent varieties to RP. In Investigating multidimensional relationships, we analyze the multidimensional relationships that hold between the varieties more fully. As was discussed in McMahon et al. (Reference McMahon, Heggarty, McMahon and Maguire2007:130–133 in particular), one method of representing the complexities in such matrices in a visually interpretable way without oversimplifying the data is to use network-type phylogenetic analysis programs, which draw trees where the relationships in the data are treelike, but draw networks when the relationships between varieties are more complex. In particular, the NeighborNet algorithm, part of the phylogenetic software suite Splitstree 4 (Huson & Bryant, Reference Huson and Bryant2006) has proven especially suited to displaying the complex relationships between dialects and languages as encoded in similarity matrices. In Investigating multidimensional relationships, we again use NeighborNet, in conjunction with statistical testing, to assess the relationships between the Typical, Traditional, and Emergent subvarieties as a whole.
Similarity of varieties to RP
The mean differences, along with standard deviations, between all the Traditionals, all the Typicals, and all the Emergents in our sample from RP are given in Table 4. The most striking feature of this comparison is that the Typicals and Emergents are identical, on average, in distance from RP. Thus our data, in an apparent time interpretation, suggest that there has been no movement toward RP English in regional varieties of English in recent decades. There is, however, a significant difference between the similarity of the Typicals and Emergents to RP on the one hand and the similarity of the Traditionals to RP on the other, with RP being considerably less similar to the Traditionals than the other subvarieties.Footnote 10 We discuss the import of these findings in Convergence, divergence or dynamic equilibrium? below.
The distance of the subvarieties from RP

Investigating multidimensional relationships
In this section, we compare the similarity of all the Traditionals, Typicals, and Emergents with each other. We visualize the relationships between the varieties in two NeighborNet networks, which allow us to overcome the difficulties inherent in the comparison of Traditional and Mainstream dialects in Trudgill (Reference Trudgill1990). The first of these networks illustrates the relationships between the Typical and Traditional subvarieties, whereas the second illustrates the relationships between the Typical and Emergent subvarieties. It is possible to combine all of the subvarieties in one network, but separating them out in this way makes the patterns in the data easier to discern because networks become harder to read when they contain many data points.
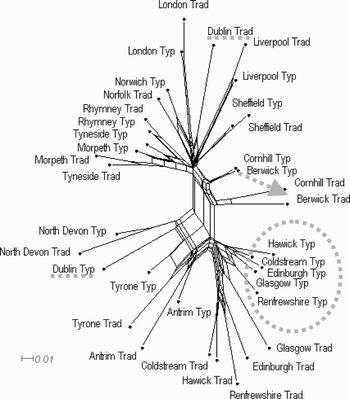
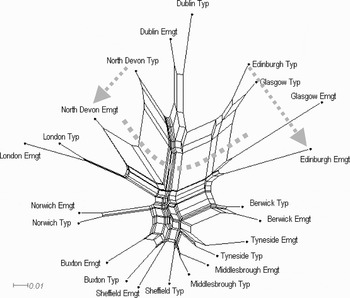
Figure 4 illustrates the relationships between the Typical and Traditional subvarieties at those locations where both of these subvarieties were sampled in the British Isles. It is important in interpreting these networks to remember that they are phenograms, which depict distance between varieties, as encoded in the similarity matrices, regardless of whether this is the result of common ancestry, contact, or parallel developments. The distance between any pair of varieties is represented by the shortest distance along the lines between them—thus this network reveals, for example, that the distance between Typical Hawick and Typical Coldstream is rather small (as we might expect, given their geographical proximity), but the difference between Traditional London and Traditional Antrim is relatively big (again not surprising given their geographical locations). Where there are “boxes” in the network (created by “reticulations” that join separate “branches”), these reflect conflicting signals in the data, because they are the result of varieties that are quite similar to each other nevertheless having different relationships with other varieties. A good example of this is the different behavior of Typical Devon and Emergent Devon in Figure 5. In this network, Typical Devon groups with Dublin, and, regardless of the reticulations in the network, is not particularly close to London. Emergent Devon, on the other hand, groups with London and is not particularly close to Dublin, again regardless of the reticulations in the network. The fact that Typical Devon and Emergent Devon are, despite their different relationships with other varieties, rather close to each other, is indicated by the reticulation that joins them; but this reticulation does not change the relationship between Dublin and London. Note also that we can identify “splits” in the networks—a clear example can be seen in the middle of Figure 4—which suggest that the varieties on one side of the split share a significant feature or combination of features with each other but not with the varieties on the other side of the split.
Network illustrating the relationships between the Typical and Traditional subvarieties.

Network illustrating the relationships between the Typical and Emergent subvarieties.

Looking in detail at the network in Figure 4, it is clear that there is a major split between, on the one hand, a set of varieties made up of Typical and Traditional Devon, Typical and Traditional Scottish, Typical and Traditional Northern Irish, and Typical Dublin, and, on the other hand, all other Typical and Traditional English varieties along with Traditional Dublin. Cornhill and Berwick (both Typical and Traditional) lie in an intermediate position. We suggest that this split is the result, at least in part, of the presence versus absence of rhoticity—the inclusion of Devon Typical and Traditional on the (otherwise) Scottish/Irish side of the split may well be a result of these subvarieties being rhotic, whereas the other English varieties are nonrhotic. The intermediate positions of Berwick and Cornhill suggest that these (fairly close) varieties share features with varieties on either side of the split, which is not surprising given their geographical position on the Scottish/English border and the fact that speakers in Cornhill (though not Berwick) were variably rhotic.
As might be expected, geographically proximal varieties tend to be closer together in the network than geographically distant ones (cf. Trudgill's comments about the artificiality of discrete division of dialects; see also Séguy, Reference Séguy1971). Of particular interest, given the questions raised throughout this paper, are the relationships between the Typical and Traditional subvarieties for each location. In some cases (e.g., Liverpool, London, Rhymney, and Sheffield) there is not a great deal of difference between the subvarieties, at least relative to other localities, although it is noteworthy that in each case the Traditional subvarieties are further away from other varieties than the Typical subvarieties are. In other cases there is a clear difference between the positions of the Typicals and Traditionals. For example, there is a clear distinction between the rather homogeneous Scottish Typicals, which we might term “Scottish Englishes,” and the more diffuse Scottish Traditionals, which we might term varieties of Scots (see Corbett, McClure, & Stuart-Smith, Reference Stuart-Smith, Corbet and Stuart-Smith2003:2–4, for a discussion of this distinction). In the case of the border English varieties, Cornhill and Berwick, the Traditionals appear, given their position in the network, to share more in common with Scottish varieties than the Typical subvarieties do (cf. the findings in Glauser, Reference Glauser1974, on the crystallization of the Scottish/English linguistic border). Most striking of all is the difference between the positions of Dublin Typical and Dublin Traditional. Dublin Typical finds itself between the Northern Irish varieties and Devon on the rhotic side of the split, whereas Dublin Traditional lies between London and Liverpool, but is not particularly close to either of them (or anything else). An analysis of the linguistic features that lie behind these relations would be necessary to fully understand these distributions (see Figure 6 for an example of how this might be done). In this case, the position of Dublin Traditional is very likely explicable in terms of features (such as lack of rhoticity, glottal replacement, lenition) which it shares to varying degrees with Liverpool and London (see Hickey, Reference Hickey2005). It is precisely these features that distinguish Dublin Traditional from Dublin Typical, explaining why the two subvarieties are so dissimilar (again see Hickey, Reference Hickey2005).
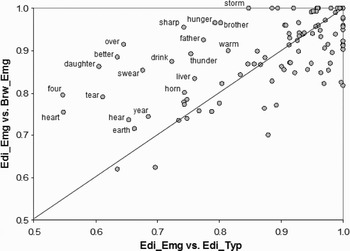
Emergent Edinburgh compared with Typical Edinburgh and Emergent Berwick.

In sum, then, the network which illustrates the relationships between the Typical and Traditional subvarieties shows a strong signal for rhoticity and reveals that the Typicals are, by and large, closer to each other than the Traditionals (see Table 5 for details).
Average distances within the groups of subvarieties

Figure 5 illustrates the relationships between the Typical and Emergent subvarieties for those location where both were sampled. In most cases, the paired Typicals and Emergents are found close together in the same part of the network, and it does not appear to be the case that the Emergents are any closer together than the Typicals (in fact in some cases, e.g., London and Berwick, they are slightly further apart). As with the network showing the relationships of the Typicals and Traditionals, this network has a noticeable split which separates the Dublin subvarieties and the Typicals from Devon, Glasgow, and Edinburgh on the one hand, from the remaining English subvarieties and the Glasgow and Edinburgh Emergents on the other. It seems likely that this rather striking pattern also reflects (at least in part) rhoticity, because the varieties on the top side of the split are consistently rhotic, whereas those below the split are nonrhotic, or are only variably so—see Romaine (Reference Romaine and Trudgill1978) and Stuart-Smith (Reference Stuart-Smith, Corbet and Stuart-Smith2003) for the loss of rhoticity among younger speakers in (urban) Scotland. We suggest that it is largely this change in the status of rhoticity in the southwest of England and in Scotland that accounts for the realignment of the southwest English and urban Scottish Emergent subvarieties, although an analysis of other possible contributing linguistic features is necessary to confirm this.
One simple way of assessing this is to examine the similarity relationships that hold between varieties for each word entered into the comparison. Figure 6 compares the similarity of each word in the comparisons of Typical Edinburgh and Emergent Edinburgh on the one hand, with Emergent Edinburgh and Emergent Berwick on the other. Comparing Emergent Edinburgh in this way, with two varieties from each side of the major split in the network, allows us to assess which words are involved in the apparent time movement of Emergent Edinburgh toward the English varieties. In this comparison, words that are more similar in the comparison of Emergent Edinburgh with Emergent Berwick than in the comparison of Emergent Edinburgh with Typical Edinburgh appear above the diagonal line, and vice versa. Higher scores on the x and y axes indicate higher similarity for the words concerned.
Although not all words are identified, an obvious pattern emerges. In many of the words where Emergent Edinburgh and Emergent Berwick are more similar, historical postvocalic /r/ was, but no longer is, present in these two Emergent subvarieties (whereas it is present in Typical Edinburgh). If we removed these words from the comparison, most words in Emergent Edinburgh would be more similar to Typical Edinburgh than to Emergent Berwick. This suggests that the “move” of the Scottish urban Emergents is a consequence of one major structural change: the loss of rhoticity in these varieties. We discuss this issue further in Convergence, divergence or dynamic equilibrium? below.
Table 5 summarizes the average distances between all the Traditionals, between all of the Typicals, and between all of the Emergents. This summary brings us to a crucial consideration for determining whether our data offer evidence of change in the relationships between varieties of English and Scots. Although the networks give us a very useful visual interpretation of the (changing) relationships between the varieties, they do not (and are not intended to) tell us what exactly constitutes a statistically significant difference between varieties. As described earlier, our data consist of distances between speech varieties S 1, S 2, …, S m, and the general type of hypothesis we wish to test is of the form “varieties S 1, S 2, …, Sn are more similar/more different than varieties S n+1, …, S m.” Therefore, we need to compare the distances between the first set of varieties, d(S i, S j), 1 ≤ i,j ≤ n, against the distances between the second set of varieties, d(S k,S l), n + 1 ≤ k,l ≤ m. This is usually done using an independent samples t test (or, when more than two sets are involved, using analysis of variance [ANOVA]).
To be more explicit, we will consider in detail one of the cases described later, namely the differences between Traditionals and Typicals in the LAX case (i.e., only for those locations where at least two types of variety were recorded). To this end, we computed the distances between all 18 Traditional varieties, resulting in a matrix of 324 (= 18 × 18) distances, one distance for each pair of varieties, with a mean distance of .22 and a standard deviation of .053. We did the same for the 20 Typical varieties, resulting in 400 (= 20 × 20) distances between all pairs of such varieties, with a mean of .14 and a standard deviation of .046 (see also Figure 8). We could compare these distances using an independent samples t test, which would result in t(610.78) = 19.25, p < 2.2·10−16, but the resulting p value would be too liberal because our data violate the assumption of independence of observations. This is because each Traditional variety is used to compute 17 distances (to all the other Traditionals), so that the matrix with 324 distances does not contain 324 independent data points, which artificially decreases p values computed by parametric tests such as the t test.
A way to address this issue is to use randomization tests (Edgington, 1987), which are robust to the independence assumption being violated, and to the data not being normally distributed.Footnote 11 For example, comparing the Traditional and Typical LAX varieties, a randomization t test (Edgington, 1987) confirms the very highly significant difference between Traditionals and Typicals, with the latter much more similar to each other than the former.
We report results for two broad cases, depending on the number of speech varieties collected at each location:
1. The STRICT case, limited to only those locations for which have recordings of all three subvarieties.
2. The LAX case, covering all locations for which have at least two subvarieties.
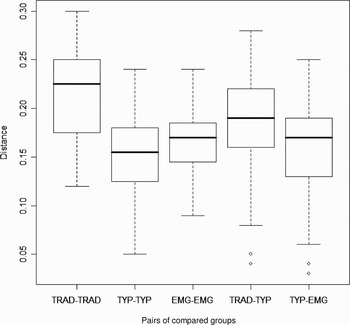
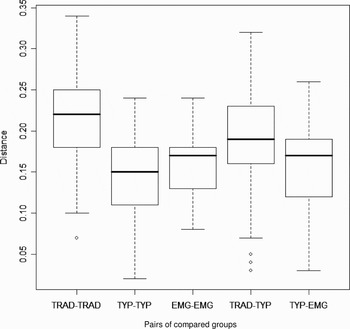
Using the one-way randomization ANOVA and t tests described previously, we can assess the significance of various groupings of speech varieties, and of the differences between them. The box plots in Figures 7 and 8 show the distances for all pairwise comparisons within each of five relevant groupings of speech varieties. For the STRICT case, Figure 7 plots, from left to right, the distances between all pairs of Traditionals, all pairs of Typicals, all pairs of Emergents, all pairs made up of one Traditional and one Typical and, finally, all pairs composed of one Typical and one Emergent. Likewise, Figure 8 plots the same distances, but for the LAX case.Footnote 12
Distances between all pairs of varieties from each group (the STRICT case). TRAD = Traditional; TYP = Typical; EMG = Emergent.

Distances between all pairs of varieties from each group (the LAX case). TRAD = Traditional; TYP = Typical; EMG = Emergent.

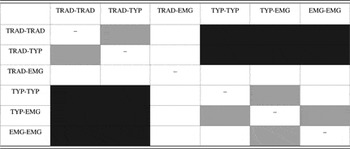
The five distance groups described, and presented visually in Figures 7 and 8, were compared using randomization independent sample ANOVAs. We have also used randomization independent sample t tests (see note 11) to compare these distance groups with each other (e.g., the distances between all Typicals against the distances between all Traditionals). This allowed us to test which intergroup distances are significantly different from each other. Table 6 shows the pairs of distances that are significantly different (after multiple testing correction)Footnote 13 in the LAX and STRICT cases. White cells represent comparisons that are not significant comparisons, light gray cells those which are significant only in the LAX condition, and dark gray cells those significant in both the LAX and STRICT conditions (there are no cases of comparisons significant only in the STRICT but not in the LAX condition). The significance level used is .05, all p values are corrected using Holm's (Reference Holm1979) procedure, and the number of random permutations were generated was 10,000.
Significant corrected comparisons between pairs of varieties

TRAD = Traditional; TYP = Typical; EMG = Emergent
As can be seen, in both the LAX and STRICT conditions the difference between the Typicals (TYP-TYP) and Emergents (EMG-EMG) was not significant. This means that, as the networks and box plots indicate, the Emergents are not significantly more or less similar to each other than are the Typicals are, whereas the Typicals and Emergents are significantly more similar to each other than are the Traditionals.
In the next section, we discuss the significance of our findings in light of the models of variation and change discussed in the introductory section of this article.
CONVERGENCE, DIVERGENCE, OR DYNAMIC EQUILIBRIUM?
This paper examines the changing relationships between varieties of English in the British Isles as a result of endogenous and exogenous changes. We have suggested that although certain developments may be indicative of change in a particular direction, we cannot tell whether they are, in fact, leading to overall change in relationships between varieties if we only look at them in isolation (either changes in individual linguistic features or changes in individual varieties). Rather, we have argued, we must use methods that examine not individual features or individual varieties in isolation but the behavior of a wide range of linguistic features in a wide range of different varieties at the same time. One such method has been introduced here. Our method first rates the similarity of phonetic transcriptions of a standard word list in pairwise comparisons of varieties from across the British Isles. This produces a similarity matrix that captures the complex relationships that exist between these varieties. Using up to three subvarieties from many locations, this method has revealed five key patterns:
1. Rhoticity is a very important feature for defining the relationships between varieties of English (whereas it only counts as but one feature among many in Trudgill's analysis, for example).
2. There has been a highly significant convergence in the transition from traditional dialects to modern accents of English (as Trudgill hypothesizes).
3. This is mirrored in the relationship of the Traditionals to RP, although the effect is less marked.
4. There has been no corresponding (nor indeed significant) convergence between modern working-class varieties of English as used by middle-aged speakers (Typicals) and those used by younger speakers (Emergents).
5. Likewise, there is no evidence that the Emergents are more (or less) similar to RP than the Typicals.
Thus our methodology gives us different answers, depending upon which period of development (in apparent time) we look at in the history of English. Items 2 and 3 involve definite convergence. Items 4 and 5, on the other hand, do not.
Lack of divergence
Perhaps not surprisingly, our data and methods reveal little evidence for divergence among varieties of English in Britain and Ireland. This finding accords with the comment by Kerswill (Reference Kerswill, Britain and Cheshire2003:239) that few researchers have been able to demonstrate divergence in dialects of English in the British Isles. Although the Emergent subvarieties are very slightly less similar to each other than the Typical subvarieties, this difference is not significant, and it is likely that it has other causes. It is possible, for example, that it is a consequence of the analysis containing fewer Emergent subvarieties from a wide range of geographical locations and more Typical subvarieties from a denser geographical network; or it might be that our younger speakers were less likely to suppress the vernacular when reading, in a similar fashion to the younger speakers analyzed in Stuart-Smith et al. (Reference Stuart-Smith, Timmins and Tweedie2007).
The transition from Traditional to Typical
Our data reveal that the Traditional subvarieties are significantly more heterogeneous than the Typical and Emergent subvarieties, and that the Traditionals are much further from RP than the other subvarieties. An apparent time interpretation of this situation suggests that there has been a marked convergence of varieties of English at some point in the past, in the transition from traditional English and Scots dialects to modern accents of English. This accords with the analysis of English dialects in Trudgill (Reference Trudgill1990). Two processes that might explain this change were identified earlier: geographical (innovation) diffusion and leveling. Leveling in particular seems likely to lead to convergence between varieties because it involves the reduction in precisely those features that make them most distinctive. Furthermore, as Trudgill (Reference Trudgill, Foulkes and Docherty1999) pointed out, exogenous changes can have different sources, such that some changes have the effect of making varieties more similar to the “national mainstream” (including RP), whereas others bring varieties into line with other regional accents. However, the results of these two processes can look rather similar (and this is perhaps why Trudgill does not use the term “standardization”). This is particularly so with leveling changes, which eradicate highly localized variants (by their nature nonstandard), leaving features that are shared by a range of varieties (which may ultimately be of standard origin). So, for example, the word old may be pronounced as [ɑɫ] and [oɫd] in northeast Scotland, as [aːd] and [old] in Tyneside English, and as [ɐʉl] and [old] in Tyrone English. Clearly [ɑɫ], [aːd], and [ɐʉl] are highly localized and hence may be subject to leveling, leaving [oɫd], [old], and [old], which, not coincidentally, are nearer to RP English [əʊɫd] phonetically and phonologically. Even if the leveling change happens without any (further) input directly from the standard variety itself, the result may look like standardization because divergent regional varieties are already likely to share forms that have their origin in more standard patterns of speech. This may well explain why our Traditional subvarieties are further from RP than the Typicals and Emergents, and this difference need not indicate that speakers have moved toward RP English directly.
Despite this complication, it is clear that here we are dealing with a process like that described by Kerswill and Williams (Reference Kerswill, Williams, Foulkes and Docherty1999). The differences between varieties are being reduced (cf. Figure 4), and markedly local linguistic patterns are being replaced by patterns found in wider geographical areas. Although the term “regional dialect leveling” seems suitable for this change, an alternative term, “dialect death” (see Britain, Reference Britain, Britain, Vandekerckhove and Jongenburger2009), might be more appropriate, given the wholesale restructuring of the lexical incidence of phonemes and change at all linguistic levels that underlies this convergence. The term “regional dialect leveling” typically applies to changes in regional accents of English in the second half of the 20th century, whereas the abandonment of traditional dialect by the vast majority of the population was a change that was already well under way in the second half of the 19th century, if the evidence in Ellis (Reference Ellis1889), Wright (Reference Wright1905), and the SED is anything to go by. Although traditional dialect pronunciations do still survive, for some speakers at least (see The ‘Traditional’ sub-variety), a number of factors suggest that the transition from traditional dialect to modern varieties of English is not really an ongoing change for the vast majority of the population and has not been for some time. First, only a small percentage of the population appears to have much command of traditional dialect pronunciations, and this was true even in the middle of the 20th century and before, given the length that surveys such as the SED went to identify suitable informants (see Orton, Reference Orton1962, for details). Second, our own methods for eliciting traditional dialect pronunciations make no claim as to how commonly used these pronunciations are, and this is also the case with traditional dialect surveys such as the SED or Ellis (Reference Ellis1889). It could well be that these traditional dialect pronunciations are (and were) a minor (if salient) part of the repertoire of even these specially selected speakers, so that the differences between them and more “typical” speakers of modern varieties of English represent a considerable difference in apparent time.
Comparing Typical and Emergent subvarieties
When we compare the Typical and Emergent subvarieties, we find that there is no significant evidence for overall convergence or divergence. This is despite the fact that most of our Emergent varieties are characterized, to one degree or another, by many exogenous changes suspected of originating in the southeast of England. That the introduction of patterns of exogenous origin is possible without convergence was discussed in above. The fact that there seems to be no evidence of convergence might suggest that leveling has not been a major factor in their development in recent years, even if it was an important factor in the transition from traditional dialects to modern varieties of English. This is not to say that our Emergent subvarieties are the same as the equivalent Typical ones. Although they are obviously quite similar, they are different, for all of the reasons discussed in the first part of this article. Things have not stood still in recent decades. Thus we find evidence for continued change without overall change in similarity or difference—precisely the situation that we introduced the term “dynamic equilibrium” to describe.
But might it be the case that the overall similarity of the Typicals and the Emergents is obscuring changes in the relationships between varieties at the regional level? After all, the process of regional dialect leveling, as defined by Kerswill (Reference Kerswill, Britain and Cheshire2003), assumes this as part of its definition, and Trudgill (Reference Trudgill1990) suggested that it is at the regional level that focusing on urban varieties is occurring. In order to answer this question fully, a much larger sample of (sub)varieties would be needed from a variety of British regions. Nevertheless, some insight can be gained by examining the changing behavior of varieties in two regions in England—the northeast and the south. If we compare the three varieties in the northeast of England for which we have both Typical and Emergent data (see Table 7), there is still no evidence for convergence between them (cf. the comments in Trudgill, Reference Trudgill1990:81–82). If anything, the Emergents are less similar than the Typicals, although the small number of varieties involved means that the significance of this pattern is impossible to gauge—see Lack of divergence above for some suggested reasons for this difference.
The similarities of northeastern varieties

A somewhat different pattern emerges when we compare the varieties from the south (admittedly a much larger “region”). Table 8 indicates that although the London and Norwich Emergents are somewhat less similar than the London and Norwich Typicals, Devon Emergent is rather more similar to both the London and Norwich Emergents than Devon Typical is to the London and Norwich Typicals.
The similarities of southern varieties

Although it is again difficult to gauge the significance of these results given the small number of varieties being compared, the fact that Devon Emergent seems to be acting in a different way from the others is intriguing. One of the features that Devon Emergent shares with London and Norwich but which Devon Typical does not is that it is a largely nonrhotic variety. It seems, on further analysis, that it is this loss of rhoticity that is responsible for the increased similarity of the variety to other southern varieties. In Table 9, the similarity of the southern varieties to each other is calculated without including those words which contained historical coda /r/, hence factoring rhoticity out of the equation. As can be seen, there is absolutely no difference in the similarity of Devon Typical and Devon Emergent with the other southern varieties once this is done.
The effect of loss of rhoticity

Thus like Edinburgh, the apparent change in similarity between Devon and other varieties appears to be a symptom of one major phonological change—the loss of rhoticity. Whether or not this should be interpreted as a case convergence is debatable—it may, like the spread of TH-fronting, simply represent an example of varieties “falling into step” with others in the diffusion of a change, resulting in a re-establishment of the equilibrium.
Thus there is no evidence in our data (which is admittedly limited in this respect) for convergence at the regional level. Further data will need to be analyzed to determine whether this holds true for English in Britain more generally and to evaluate the reality of Trudgill's future dialect areas.
AND THE FUTURE
We began this paper by examining the change in English dialects described in Trudgill (Reference Trudgill1990). The data we have analyzed here support Trudgill's scenario, at least to an extent—there has been a significant convergence in the transition from traditional dialects to modern varieties of English. But as Trudgill, Kerswill, Watt and Milroy, Britain, and Stuart-Smith et al. demonstrated, change, both endogenous and exogenous, is complex and can have unexpected results. Varieties that share exogenous changes may converge, but they need not, depending upon the type of change, the pre-existing system that the changes interact with, and the geographical relations of the varieties involved. The result is that varieties change, often in similar ways, but can remain just as distinct as they ever were—that is, they are in a state of dynamic equilibrium.
So what does the future hold for British Englishes? It seems unlikely to us that differences of the order seen between the traditional dialects will arise in the foreseeable future (cf. Trudgill's comments about Australian English). Further data and analysis are required to determine whether varieties at the regional level will remain distinct or are destined to converge to a degree, perhaps focusing on the varieties of major urban areas, as suggested by Trudgill (Reference Trudgill1990). This paper is only a first attempt to address this complex issue in a quantitative fashion. We have begun by analyzing similarities in segmental phonology but, as Meyerhoff and Niedzielski (Reference Meyerhoff and Niedzielski2003) demonstrated, it is desirable to analyze similarity across multiple linguistic levels (which may or may not act in similar ways). Likewise, we have only analyzed a rather limited range of speakers which, we hope, gives us some insight into change (or lack of it) in apparent time. It is equally desirable that this analysis should be broadened to include strictly comparable samples of speakers at each location, something which we have begun to do at two urban locations, Newcastle and Edinburgh. Nevertheless, quantitative methods of this sort have much to tell us about language variation and change, and it is only through holistic quantification between varieties in both social and geographical space that we can hope to determine whether varieties are converging, diverging, or coexisting in a state of dynamic equilibrium.
 to him too, however!