1. INTRODUCTION
A salient phenomenon of consumer behavior is a hump-shaped age-consumption profile with consumption peaking at around age 45 at a level of about 1.1 relative to consumption when entering the workforce [e.g. Gourinchas and Parker (Reference Gourinchas and Parker2002)].Footnote 1 The hump could be regarded as a puzzle for mainstream economics since standard life-cycle theory, based on consumption smoothing, predicts a monotonous (constant, increasing, or declining) age-consumption profile [Attanasio and Weber (Reference Attanasio and Weber2010)]. Meanwhile, the literature has proposed several (complementing) mechanisms explaining the consumption puzzle, based on precautionary savings [Carroll and Summers (Reference Carroll, Summers, Bernheim and Shoven1991)], changing preferences [Attanasio et al. (Reference Attanasio, Banks, Meghir and Weber1999)], or cost of rearing children and changing household size [Browning and Ejrnaes (Reference Browning and Ejrnaes2009)], consumption and labor supply complementarity [Heckman (Reference Heckman1974), Bullard and Feigenbaum (Reference Bullard and Feigenbaum2007)], durable goods consumption [Fernandez-Villaverde and Krueger (Reference Fernandez-Villaverde and Krueger2007)], short-term planning [Caliendo and Huang (Reference Caliendo and Huang2008)], and overconfidence [Caliendo and Aadland (Reference Caliendo and Aadland2007)]. The mechanism proposed in the present paper is distinct from the existing mechanisms because it is based on human aging (accumulation of health deficits) and the interaction of health and consumption in the utility function. Since the health channel complements the available mechanisms, it should not be expected to explain the hump completely, in a quantitative sense. It is, however, interesting to investigate how much of hump-shaped consumption can be rationalized by human aging.
A necessary assumption for the health hump to occur is that deteriorating health has a negative influence on utility. This is supported by a recent study by Finkelstein et al. (Reference Finkelstein, Luttmer and Notowidigdo2013) who estimate that the marginal utility from consumption declines by 11% when the number of health deficits increases by one standard deviation. However, there are also earlier studies that estimate a higher or lower effect [see Finkelstein et al. (Reference Finkelstein, Luttmer and Notowidigdo2013), for an overview].
As a stylized fact, humans develop about 3 to 4% more health deficits from one birthday to the next. This insight is made evident by a series of studies based on an index of health deficits, called the frailty index [e.g. Mitnitski et al. (Reference Mitnitski, Mogilner and Rockwood2001), (Reference Mitnitski, Mogilner, MacKnight and Rockwood2002a,Reference Mitnitski, Mogilner, MacKnight and Rockwoodb), (2005), Rockwood and Mitnitski (Reference Rockwood and Mitnitski2007)]. The frailty index measures the proportion of the actual to the total potential deficits that an individual has, at a given age. The list of potential deficits ranges from mild nuisances (e.g. reduced vision) to serious ones such as strokes. According to Rockwood and Mitnitski (Reference Rockwood and Mitnitski2007), the exact choice of deficits does not a affect the results, provided that sufficiently many indicators (40 or more) are present in the index. Mitnitski et al. (Reference Mitnitski, Mogilner, MacKnight and Rockwood2002a) show that the relative number of health deficits D(t) increases exponentially with age t in the following quasi-exponential way:
 $$\begin{equation}
D(t)=E+B e^{\mu t}.
\end{equation}$$
This “law of deficit accumulation” explains around 95% of the variation in the data, and its parameters are estimated with great precision. Mitnitski et al., using a data set of 19 to 79 years old Canadians, estimate that for men, E = 0.02 (0.001), log (B) = −5.77 (0.06), and μ = 0.043 (0.001), with standard errors in parenthesis. Rockwood and Mitnitski (Reference Rockwood and Mitnitski2007) show that Australians, Swedes, and U.S. Americans accumulate deficits in an exponential way very similar to Canadians. Harttgen et al. (Reference Harttgen, Kowal, Strulik, Chatterji and Vollmer2013) find similar results for European countries. For most nations, the force of aging μ is found to be around 3 to 4%.
Conceptually, the index of health deficits is very useful for economists since it provides the state of health as one number, which is easy to observe and estimate. Compared to health capital [Grossman (Reference Grossman1972)], which is a latent variable and hard to capture empirically [see e.g. Wagstaff (Reference Wagstaff1986)], the health deficit index allows for an easy transfer of knowledge from medicine and gerontology to economics (and vice versa) and facilitates a straightforward calibration of economic models with health data. It has recently been applied to shed new light on the Preston curve [Dalgaard and Strulik (Reference Dalgaard and Strulik2014)], the education gradient [Strulik (Reference Strulik2016)], and the long-run evolution of retirement [Dalgaard and Strulik (Reference Dalgaard and Strulik2017)]. Here, I use it to show that a life-cycle theory of consumption and health deficit accumulation can account for an empirically plausible hump-shaped age-consumption profile. In Sections 2 and 3, I present the simplest model that conveys the mechanism. In Section 4, I show the robustness of the results with respect to endogenous health investments and uncertain death, and I investigate the comparative dynamics of the health hump with respect to education levels.
2. THE MODEL
Individuals derive instantaneous utility from consumption c and from their health. The state of a person’s health is assumed to shift the “ordinary” isoelastic utility function for consumption. It is measured by the index of accumulated health deficits D such that the utility function reads
 $$\begin{equation}
u(c,D)= \left({D_0 \over D} \right)^{\alpha } \cdot \tilde{u}(c), \qquad \mbox{with } \tilde{u}(c) = \left\lbrace \begin{array}{@{}l@{\quad }l@{}}c^{1-\sigma } - 1 \over 1-\sigma &\text{for $\sigma \ne 1$}\\
\log (c)&\text{for $\sigma =1$}.\end{array}\right.
\end{equation}$$
As in Finkelstein et al. (Reference Finkelstein, Luttmer and Notowidigdo2013), additional health deficits reduce the marginal utility of consumption. The constant D 0 denotes initial health deficits. It is used (without loss of generality) to normalize the utility function such that it coincides with the canonical model at the initial state of best health (when D = D 0). The flow-form of the law of health deficit accumulation (1) is given byFootnote 2
 $$\begin{equation}
\dot{D} = \mu (D-E) {\qquad \Rightarrow \qquad }{\dot{D} \over D} = \mu \left(1-{E \over D} \right), \qquad D>E.
\end{equation}$$
Individuals may save for consumption later in life and face a given wage w and a given interest rate r such that their budget constraint reads
 $$\begin{equation}
\dot{k} = r k +w - c.
\end{equation}$$
We could have alternatively assumed that individuals retire at some age and that labor income is first increasing and then declining with age. Since individuals base their decisions on life-time income, these extensions would not change any of the results. In order to demonstrate that the theory does not essentially depend on these features – in contrast to some of the studies cited in the Introduction – we consider a constant stream of labor income.
Let ρ denote the time preference rate and let the initial age be normalized to zero (later, in the calibration, this will be an actual age of 20). Individuals maximize their life-time utility ∫
T
0
e
−ρt
u(c, D)dt, given initial health deficits and initial capital, D(0) = D
0, k(0) = k
0, and terminal health deficits and terminal capital
 $D(T)=\bar{D}$
,
 $k(T)=\bar{k}$
. The individual dies at age T when
 $\bar{D}$
health deficits have been accumulated.
The current-value Hamiltonian of this maximization problem is
 $$\begin{equation}
H=D^{-\alpha } \tilde{u}(c,D) + \lambda _k (w+rk-c)- \lambda _D \mu (D-E),
\end{equation}$$
in which λ k and λ D denote the co-states. The first-order condition for consumption and the co-state equation for capital are
 $$\begin{equation}
&& D^{-\alpha } c^{-\sigma }-\lambda _k =0, \quad \mbox{and}
\end{equation}$$\\
 $$\begin{equation}
&&\lambda _k = \lambda _k \rho - \dot{\lambda }_k .
\end{equation}$$
For the full solution, we would also need to evaluate the costate equation for D and the Hamiltonian at the time of death H(T). Here, we are only interested in consumption relative to initial consumption, which can be obtained independently from the full solution of the model.
3. RESULTS
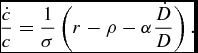
Differentiating (6) with respect to age and inserting
 $\dot{\lambda }_k$
and λ
k
provides the health-modified Ramsey rule for optimal consumption:
 $$\begin{equation}
{\dot{c} \over c} = {1 \over \sigma } \left(r-\rho - \alpha {\dot{D} \over D} \right).
\end{equation}$$
The solution is very intuitive. For α = 0, we obtain the standard solution. When α > 0, individuals take their aging into account. Since they derive less pleasure from an extra unit of consumption in poor health, i.e. when health deficits D are large, consumption growth is declining in the speed of health deficit accumulation
 $\dot{D}/D$
weighted by the importance of health for utility (α).
From inspection of (8), we see that the condition r > ρ, which is standard in models of economic growth, is necessary but not sufficient for an initially positive and then negative rate of consumption growth, i.e. for a hump. Inspection of (3) shows that the rate of health deficit accumulation is initially close to zero (when D is close to E) and increasing with age, i.e. it is higher when many health deficits have been accumulated. This means that the health term dominates when D becomes sufficiently large, and the growth rate becomes negative. Sufficient for the presence of a hump is thus that the health term becomes dominating before the individual dies (in conjunction with r > ρ).
If it exists, the age of peak consumption is straightforward to compute in closed form. Setting
 $\dot{c} =0$
in (8) and using (3), we obtain health deficits at the age of peak consumption:
 $$\begin{equation}
D=D^* \equiv {\alpha \mu E \over \alpha \mu - (r-\rho )},
\end{equation}$$
which are independent from the curvature of consumption utility (σ). Inserting D* into (1) and solving for t provides the age of peak consumption:
 $$\begin{equation}
t=t^* \equiv {1\over \mu } \log \left( (r-\rho ) E \over \alpha \mu - (r-\rho ) B \right).
\end{equation}$$
The age of peak consumption is increasing in the interest rate r and declining in the time preference rate ρ as well as in the rate of aging μ. Peak consumption is also reached earlier if health is important for utility (if α is large).
In order to obtain the level of peak consumption, we solve the differential equation (8) for given initial consumption c 0:
 $$\begin{equation}
c(t) = c_0 {\rm e}^{1/\sigma \int _{0}^{t} r- \rho - \alpha \mu [1- E/D(\tau )] {\rm d}\tau } = c_0 {\rm e}^{1/\sigma \left[(r-\rho ) t - \alpha \log (E+ B \exp (\mu t) + \alpha \log (E+B) \right] }.
\end{equation}$$
The right-hand side of (11) follows from inserting D(τ) from (1) and solving the integral. Finally, inserting t* from (10) into (11) and dividing by c 0 provides peak consumption relative to initial consumption. Peak consumption is increasing in the interest rate and declining in the time preference rate, the curvature parameter σ, the rate of aging μ, and the weight of health in utility α.
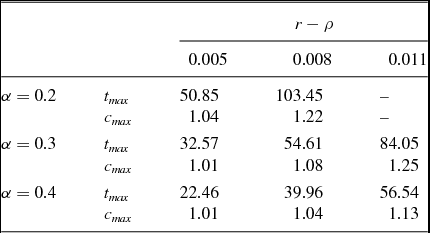
Since the biological parameters are estimated with high precision, there are relatively few degrees of freedom. Given the estimates of Mitnitski et al. (Reference Mitnitski, Mogilner, MacKnight and Rockwood2002a), cited in the Introduction, the age of peak consumption is solely determined by the difference r − ρ and the weight of health in utility α. The size of the hump depends also on σ. Figure 1 shows the age-consumption profile for σ = 1, α = 0.3, and r − ρ = 0.008, assuming an initial age of 20 years. Table 1 shows the results for σ = 1 and alternative values for r − ρ and α. Recent estimates of the elasticity of intertemporal substitution suggest that the “true” value of σ is probably close to unity [Chetty (Reference Chetty2006)]. For values of α around 0.3 and an interest rate differential of 0.8%, the age of peak consumption is in the neighborhood of the empirical estimates and the size of the hump is somewhat smaller than suggested by the literature, leaving room for alternative channels.
The health hump. The figure shows the solution (11) for r − ρ = 0.008, α = 0.3, and σ = 1; consumption is expressed relative to initial consumption at age 20.

Health hump – sensitivity analysis
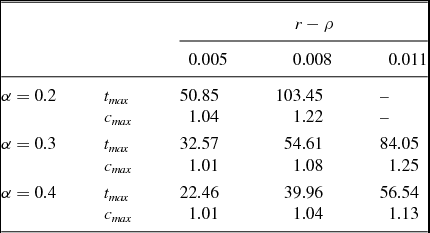
Note: tmax is the age of maximum consumption; cmax is the level of maximum consumption relative to consumption at age 20. Numbers are rounded.
As shown in Table 1, a bigger hump is formed for larger values of α and μ. A value of α much larger than 0.3, however, is hard to defend against the empirical observation of Finkelstein et al. (Reference Finkelstein, Luttmer and Notowidigdo2013). This study estimates that an increase of one standard deviation of health deficits reduces marginal utility from consumption by about 11%. According to Mitnitski et al. (Reference Mitnitski, Mogilner and Rockwood2001), the standard deviation of most health deficits in the frailty index is around 0.4/
 $\tilde{\mu }$
, in which
 $\tilde{\mu }$
is the mean of the particular deficit. The mean frailty index from (1) for individuals between 19 and 79 years is about 0.05 with a standard deviation of about 0.02. The estimate of Finkelstein et al. then suggests that
 $$\begin{equation*}
{(0.05+0.02)^{-\alpha } \over (0.05)^{-\alpha } }= 1-0.11 {\qquad \Rightarrow \qquad }\alpha = {\log (0.89) \over \log \left(5/7 \right)} = 0.34.
\end{equation*}$$
However, as acknowledged in the Introduction, earlier studies using other methods estimated different effects of health on marginal utility. It should also be noted that Finkelstein et al. use a different concept of health deficits, comprising only seven chronic diseases, i.e. considerably less than what is included in the frailty index, which may cause measurement error in the estimation of α. A value of around 0.34 should thus not be taken at face value but as an initial reference point. It implies that an empirically plausible consumption hump is observed when the interest rate exceeds the time preference rate by about 0.8 to 1.1% (i.e. in an environment that supports a steady-state rate of economic growth of about 1% per year).
4. EXTENSIONS: HEALTH INVESTMENTS, EDUCATION, AND UNCERTAIN DEATH
4.1. Health Investments and Endogenous Longevity
In this section, I show the robustness of the results with respect to an extension of the model to deliberate health spending and endogenous longevity. This section could also be considered as an extension of Dalgaard and Strulik (Reference Dalgaard and Strulik2014) with respect to health in the utility function. Together, this means that health expenditure is driven by two motives: the desire for a long life [as in Dalgaard and Strulik (Reference Dalgaard and Strulik2014)] and the direct impact of good health on instantaneous utility. Specifically, the equation of motion for health deficits (3) is modified to
 $$\begin{equation}
\dot{D}=\mu (D-Ah^\gamma -a),
\end{equation}$$
in which h is health expenditure and A and γ are parameters controlling for the power of medical technology. In other words, the constant E of (3), the factor that slows down the exponential decay of the human body, is partly explained by health expenditure. The concave functional form is taken from Dalgaard and Strulik (Reference Dalgaard and Strulik2014) where it is explained in greater detail. The parameters A and γ will be calibrated to match the actual evolution of health deficits over the life cycle. With p denoting the price of health investments, the budget constraint (4) is modified to
 $$\begin{equation}
\dot{k} = rk +w - c -ph.
\end{equation}$$
Everything else is taken from the simple model of Section 2. In particular, individuals continue to die when
 $\bar{D}$
health deficits have been accumulated. In the new context, this means that they (partly) control the time of death through health expenditure.
The Hamiltonian for maximizing life-time utility becomes
 $$\begin{equation}
H= u(c,D) + \lambda _k (w+rk-c-ph)- \lambda _D \mu (D-Ah^\gamma -a),
\end{equation}$$
with u(c, D) as in (2). The first-order condition for consumption and the co-state equation for capital remain the same as in (6) and (7). Additionally, we have a first-order condition for optimal health spending (15) and a co-state equation for health deficit accumulation (16):
 $$\begin{equation}
&& -\lambda _D \mu \gamma Ah^{\gamma -1} -\lambda _k p=0,
\end{equation}$$\\
 $$\begin{equation}
&&-\alpha \left({D_0 \over D} \right)^\alpha {u(c,D) \over D} +\lambda _D \mu = \lambda _D \rho -\dot{\lambda }_D.
\end{equation}$$
Since (6) and (7) remain the same as in the simple model, we obtain again the modified Ramsey rule (8). There will thus be a hump-shaped consumption profile when the growth rate of health deficit accumulation falls short of (r − δ)/α at young ages and exceeds (r − δ)/α at old ages. The structure of the age-consumption profile is preserved in the extended model.
The rest of the extended model can only be assessed numerically. For that purpose, I solve the dynamic system (2), (6), (8), (12), (13), (15), and (16), given the initial and boundary conditions and the optimality condition for this free terminal time problem, namely that the Hamiltonian at the time of death assumes the value of zero. This means that the life-time trajectories are uniquely identified. I use the solution algorithm of Trimborn et al. (Reference Trimborn, Koch and Steger2008).
As in Dalgaard and Strulik (Reference Dalgaard and Strulik2014), I calibrate the model in order to capture a 20-year-old U.S. American male in the year 2000. Specifically, I require that the individual has a life expectancy of 55.5 years [dies at age 75.5; NVSS (2012)]; earns an annual labor income of $ 35,320 [BLS (2011)]; and that he spends about 13% of his life-time income on health [the health expenditure share of GDP in the U.S. in the year 2000; World Bank (2015)]. I take from Mitnitski et al. (Reference Mitnitski, Mogilner, MacKnight and Rockwood2002a) the estimate μ = 0.043 and D(0) = 0.0274 as well as
 $\bar{D}=0.1$
at the age of death (age 75.5). I normalize p = 1, set γ = 0.2 as estimated by Dalgaard and Strulik (Reference Dalgaard and Strulik2014), and identify a by assuming that the role of technology in the repair of health deficits of adults was virtually zero in the year 1900, when the life expectancy of a 20-year-old U.S. American was 42 years [NCHS (1980)].
For the benchmark run, I set α = 0.3 and an interest differential r − ρ of 0.8%, as in the simple model from Section 3. The calibrated parameters are provided in the text below (Figure 2). Most values are close to the estimates in Dalgaard and Strulik (Reference Dalgaard and Strulik2014) and I refer to that paper for a discussion. Here, it is important to note that the model with health spending and endogenous longevity generates about the same health hump as the simple model (compare the right-hand side of Figure 2 with Figure 1). The explanation is straightforward. The model with endogenous health investments approximates the actual evolution of health deficits quite well. This is shown on the left-hand side of Figure 2 where the solid line is the prediction of the model and stars indicate the estimates of Mitnitski et al. (Reference Mitnitski, Mogilner, MacKnight and Rockwood2002a). Notice that the initial and terminal values are pre-specified by the calibration but that the trajectory in between is a prediction based on individual health expenditure. Because of the good approximation of the actual health deficit accumulation, the trajectory of
 $\dot{D}/D$
imposed on the simple model and the trajectory of
 $\dot{D}/D$
generated by the extended model virtually coincide such that – given the same interest differential – the age consumption profile coincides as well (cf. the Euler equation (8)).
Endogenous health deficit accumulation and age consumption profile. Stars in the panel of the left-hand side indicate estimates by Mitnitski et al. (Reference Mitnitski, Mogilner, MacKnight and Rockwood2002a). Solid lines represent the prediction of the model. Parameters: a = 0.013; A = 0.0013, α = 0.3; γ = 0.2; μ = 0.043; w = 35, 320;
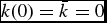 $k(0)=\bar{k}=0$
; r = 0.07; ρ = 0.062; σ = 1.09; p = 1.

4.2. Education and the Health Hump
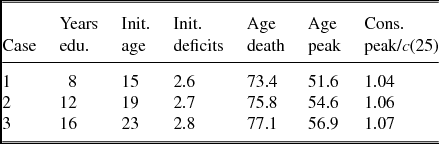
A stylized fact from the literature is that the age consumption profile varies across social strata. In particular, better education leads to a larger hump at a later age [e.g. Attanasio et al. (Reference Attanasio, Banks, Meghir and Weber1999)]. The offered explanation is that preferences vary with education [Attanasio et al. (Reference Attanasio, Banks, Meghir and Weber1999), Gourinchas and Parker (Reference Gourinchas and Parker2002)]. The present model is capable to produce educational differences in the hump as well albeit without relying on varying preferences across educational strata. In order to show this straightforwardly, I introduce education in “reduced-form”, as in Dalgaard and Strulik (Reference Dalgaard and Strulik2017; Section 6) by varying wage income and varying age of entry into the labor market (the initial age of our analysis). As an example, we consider the outcome for 8, 12, and 16 years of education. Assuming that individuals start to attend school at age 7, this means that individuals begin their working life at age 15, 19, and 26, respectively (see Table 2). Furthermore, I assume that annual wages for 12 years of schooling are about 30% higher than annual wages for 8 years of schooling and about 30% lower than annual wages for 16 years of schooling [i.e. the return to education is about 0.07; Card (Reference Card1999)]. By inserting the initial age into the health deficit equation from Mitnitski et al. (Reference Mitnitski, Mogilner, MacKnight and Rockwood2002a), I obtain initial health deficits for the three education groups. I keep all model parameters as calibrated in the previous section.
Results: Education strata
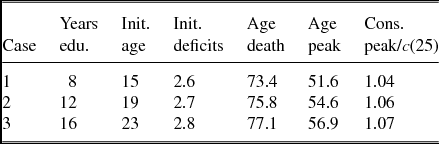
Note: Age peak is the age at peak consumption; cons. peak/c(25) is consumption at the peak relative to consumption at age 25; init. age is the age at which individuals receive their first income (and the maximization of life-time utility commences).
Figure 3 and Table 2 present the results. Less-educated individuals are slightly healthier when they enter the work force (due to their young age) and they earn labor income earlier. The dominating effect, however, is that they earn less life-time income such that they spend less on health and accumulate health deficits faster, as shown in the panel on the left-hand side of Figure 3. A larger rate
 $\dot{D}/D$
, in turn, means not only that less educated individuals are predicted to die earlier [cf. Table 2 and the discussion in Strulik (Reference Strulik2016)] but also that their consumption peaks earlier in life at a lower level (cf. the Euler equation (8)), as shown in the panel on the right-hand side of Figure 3.
Education strata: Health deficit accumulation and consumption profiles. Solid lines: 8-years education; dashed lines: 12-years education; dash-dotted lines: 16-years education. Right-hand side: consumption is expressed relative to consumption at age 25.

4.3. Uncertain Survival
We next consider the robustness of the results with respect to extend the model to uncertain survival. In so doing, we utilize the fraction of health deficits accumulated by a person in order to predict his or her survival probability. This procedure captures the biological approach to aging, which aspires to replace age as a proximate determinant of death by the loss of bodily function as a deep determinant. As in Strulik (Reference Strulik2015), we assume that the unconditional survival probability at age t, denoted by S(t), depends on the accumulated health deficits at that age, we then impose a particular parameterization of this function, feed in the estimates from Mitnitski et al. (Reference Mitnitski, Mogilner, MacKnight and Rockwood2002a) on the association between age and health deficits, and predict the association of age and survival, which is confronted with estimates of S(t) from life tables.
A parsimonious representation of the survival function is given by the logistic function:
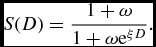 $$\begin{equation}
S(D) = {1+\omega \over 1+\omega {\rm e}^{\xi D}} .
\end{equation}$$
The survival probability is unity without health deficits (D = 0) and declines with first increasing and then decreasing rate as more health deficits are accumulated. The panel on the left-hand side of Figure 4 shows the association between D and S implied by (17) for ω = 0.02 and ξ = 40. The middle panel shows the association between age and accumulated deficits estimated by Mitnitski et al. (Reference Mitnitski, Mogilner, MacKnight and Rockwood2002a). When we feed these data into the S(D(t)) function, we get the “reduced form”, S(t), which shows survival as a function of age. The implied functional relationship is shown on the right-hand side of Figure 4. Stars in the panel on the right-hand side indicate the survival probability estimated from life tables for U.S. American men between 1975 and 1999, taken from Strulik and Vollmer (Reference Strulik and Vollmer2013). The model’s prediction fits the data reasonably well. The model predicts a life expectancy of 55.43 years for a 20-year-old person (death at 75.43) while it was actually 55.5 years for our reference American in the year 2000.
Health-dependent survival and survival by age. S(t) is the unconditional probability of surviving until age t. Left: Assumed function S(D). Middle: Estimated association D(t) [Mitnitski et al. (Reference Mitnitski, Mogilner, MacKnight and Rockwood2002a)]. Right: Predicted (line) and estimated (stars) association between age and survival probability.

Facing uncertain death, rational individuals calculate the expected utility from life-time consumption by multiplying the instantaneous utility experienced at age t with the probability of surviving until age t. Following Kamien and Schwartz (Reference Kamien and Schwartz1980, Section 9, Part I), the present value of expected utility experienced over the life cycle can be expressed as ∫
T
0
S(D)e
−ρt
u(c, D)dt. Finally, we assume perfect annuities such that the cohort-specific interest rate is given by the sum of the rate of return on capital r plus the instantaneous mortality rate
 $m = -\dot{S}/S$
. Capital left over at death is distributed among the survivors by the annuity supplier. We thus implicitly assume that the “Reference-American” is surrounded by sufficiently many other individuals of the same age. The adjusted budget constraint is given by
 $$\begin{equation}
\dot{k} = w + (r+m) k - c - p h.
\end{equation}$$
Everything else is carried over from the model in Section 4.1 such that the Hamiltonian associated with the maximization problem is
 $$\begin{equation*}
H = S(D) u(c,D) + \lambda _k [w+(r+m) k-c-ph] + \lambda _D \mu (D-Ah^\gamma -a).
\end{equation*}$$
The solution of the associated maximization problem leads to the modified Ramsey rule (8) and the following equations of motion:
 $$\begin{equation}
{\dot{h} \over h} &=& {1 \over 1-\gamma } \left({r + m -\rho + {\dot{\lambda }_D \over \lambda _D} } \right),
\end{equation}$$\\
 $$\begin{equation}
{\dot{\lambda }_D \over \lambda _D } &=& \rho -\mu - {\mu \gamma A h^{\gamma -1} c^{\sigma } \over p S(D)} \left(\alpha {S(D) \over D} - {\partial S(D) \over \partial D } \right) {\tilde{u}(c)} ,
\end{equation}$$
 $\tilde{u}(c)$
from (2) and S(D) from (17). Notice that the modified Ramsey rule is preserved from the simple model of Section 2. With the intuition developed in Section 4.1, we thus expect that the model with uncertain death supports the same hump in consumption, given that it approximates the same accumulation of health deficits over the life time.
Calibrating the model for a 20-year-old U.S. American man, as described in Section 4.1, leads to mild adjustments of the power of medical technology (now A = 0.00126) and the curvature of the utility function (now σ = 1.03). All other parameters are carried over from Section 4.1. Additionally, we have ω = 0.02 and ξ = 40, as estimated with the help of Figure 4.
Figure 5 shows the resulting life-time trajectories for health deficits and consumption (relative to initial consumption). These trajectories show health deficits and relative consumption by age, conditional on surviving to that specific age. While individuals expect to die at age 75.5, some individuals live substantially shorter or longer. Due to the latter fact, the trajectories do not end at age 75.5. Aside from this generalization, the hump in consumption virtually coincides with the hump of the simple model (Figure 1). The reason is that the model predicts the actual accumulation of health deficits quite well. Since the explained rate
 $\dot{D}/D$
virtually coincides with the rate imposed in the simple model and since the modified Ramsey is preserved from the simple model, the health hump of the simple model is robust to the extension with respect to endogenous health investments and uncertain death.
Uncertain death and the age consumption profile. Stars in the panel of the left-hand side indicate estimates by Mitnitski et al. (Reference Mitnitski, Mogilner, MacKnight and Rockwood2002a). Solid lines represent the prediction of the model. Parameters: a = 0.013; A = 0.00126, α = 0.3; γ = 0.2; μ = 0.043; w = 35, 320;
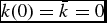 $k(0)=\bar{k}=0$
; r = 0.07; ρ = 0.062; σ = 1.03; p = 1.

5. FINAL REMARKS
This study has suggested a novel motivation of the hump-shaped age-consumption profile based on a standard life-cycle model extended by health-dependent utility and human aging. When calibrated with the estimated law of health deficit accumulation, the model produces an empirically plausible hump. These results are robust against extensions toward uncertain survival and individual health investments. With respect to the impact of health deficits on marginal utility, the model could benefit from future studies corroborating the available estimates. However, compared to health capital, a latent variable, the use of health deficits constitutes one step forward in quantitative life-cycle economics.