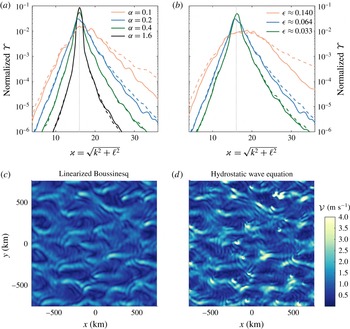
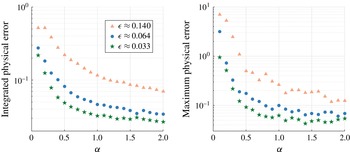
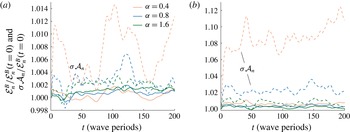
1 Introduction
Oceanic internal tides are inertia–gravity waves with tidal frequencies generated when tides slosh the rotating and stratified ocean over underwater hills and mountains. While tides are planetary-scale surface waves forced by the gravitational pull of the Sun and Moon (Balmforth et al. Reference Balmforth, Llewellyn-Smith, Hendershott and Garrett2005), internal tides are freely propagating, subsurface internal waves that have smaller 100 km horizontal scales and are strongly modulated by ever-changing oceanic eddies and currents (Rainville & Pinkel Reference Rainville and Pinkel2006; Zaron & Egbert Reference Zaron and Egbert2014).
Internal tides are an energetic component of motion almost everywhere in the Earth’s ocean. Their strength, unpredictability and rapid fluctuation means internal tides regularly contaminate temporally sparse data intended to observe more persistent flows (Munk Reference Munk, Warren and Wunsch1981; Ponte & Klein Reference Ponte and Klein2015). Their strength betrays intrinsic importance, as well: the terawatt or so that internal tides draw from surface tides (Egbert & Ray Reference Egbert and Ray2000) slows the spinning of the Earth, contributes to the outward drift of the Moon and may drive the mixing and lifting of abyssal water that determines the ocean’s density stratification.
The explicit connection between internal tides and the evolution of oceanic stratification is obscure. According to a small number of observational (St Laurent & Nash Reference St Laurent and Nash2004; Klymak et al. Reference Klymak, Moum, Nash, Kunze, Girton, Carter, Lee, Sanford and Gregg2006; Alford et al. Reference Alford, MacKinnon, Nash, Simmons, Pickering, Klymak, Pinkel, Sun, Rainville and Musgrave2011) and model-based (Carter et al. Reference Carter, Merrifield, Becker, Katsumata, Gregg, Luther, Levine, Boyd and Firing2008) estimates, somewhere between 8 %–40 % of the total energy transferred to internal tides dissipates locally and drives mixing at generation sites. The rest escapes into low-mode waves that propagate across ocean basins toward fates unknown. Because oceanic stratification and circulation are sensitive to the horizontal and vertical distribution of tide-driven turbulent mixing (Melet, Legg & Hallberg Reference Melet, Legg and Hallberg2016), the long-range propagation, eventual dissipation and total contribution to interior diapycnal mixing of internal tides should be understood to ensure accurate prediction of the evolution of Earth’s climate.
The characterization of long-range internal tide propagation and dissipation is confused by the non-stationary component of the internal tide, which Ray & Zaron (Reference Ray and Zaron2011) estimate contributes 25 % of the total internal tide sea surface height signal at mode one and 50 % or more at higher modes. Both this space–time variability and the transfer of internal tide energy to small vertical and horizontal scales are driven by interactions between internal tides and shifting currents and eddies (Zaron & Egbert Reference Zaron and Egbert2014; Ponte & Klein Reference Ponte and Klein2015; Dunphy et al. Reference Dunphy, Ponte, Klein and Le Gentil2017). For example, Zaron & Egbert (Reference Zaron and Egbert2014) use realistic simulations to conclude that horizontal density gradients associated with quasi-geostrophic flows are primarily responsible for scattering internal tides propagating away from the Hawaiian ridge.
Scattering processes may in turn extract energy from quasi-geostrophic eddies and currents. Energy transfer between general-frequency internal waves and quasi-geostrophic flow is suggested by the thought experiment by Bühler & McIntyre (Reference Bühler and McIntyre2005) and the Polzin (Reference Polzin2010) analysis of data taken during the 1978–1979 POLYMODE Local Dynamics experiment. For near-inertial waves, energy transfer with quasi-geostrophic flow is implied by asymptotic energy conservation laws derived by Xie & Vanneste (Reference Xie and Vanneste2015) and Wagner & Young (Reference Wagner and Young2016), and is explicitly demonstrated by the wave-mediated enhancement of dissipation observed in simulations by Taylor & Straub (Reference Taylor and Straub2016) and Barkan, Winters & McWilliams (Reference Barkan, Winters and McWilliams2017) and by the direct interior transfer observed via Lagrangian filtering in a simulation by Shakespeare & Hogg (Reference Shakespeare and Hogg2017). The analogous transfer of energy between non-inertial internal tides and quasi-geostrophic flows is less explored, and has implications both for large-scale dynamics as well as the energy available for wave-driven ocean mixing.
Motivated by the need to better understand interactions between internal tides and quasi-geostrophic flow, we derive the time-averaged ‘hydrostatic wave equation’, exhibited in (1.5), which describes the propagation of three-dimensional, hydrostatic internal waves through arbitrary density stratification and time-varying quasi-geostrophic mean flow. We use a multiple time scale asymptotic method to reduce hydrostatic Boussinesq dynamics to the slow evolution of the wave field over time scales much longer than a wave period. The hydrostatic wave equation does not restrict the relative spatial scales of waves and flow and thus, like the near-inertial equation derived by Young & Ben Jelloul (Reference Young and Ben Jelloul1997), is applicable to oceanic scenarios where internal waves and quasi-geostrophic flows coevolve on horizontal scales of 50–200 km (Chelton, Schlax & Samelson Reference Chelton, Schlax and Samelson2011; Ray & Zaron Reference Ray and Zaron2016; Rocha et al. Reference Rocha, Chereskin, Gille and Menemenlis2016). The hydrostatic wave equation facilitates analysis of wave–mean interactions by distilling the wave dynamics into a single time-averaged equation and comprises a first step toward a model for the coupled evolution of internal tides and quasi-geostrophic flow.
The approximations used to derive the hydrostatic wave equation are intermediate between the more severe reductions of geometric optics that permit ray tracing and the more mild assumptions required to linearize wave dynamics around arbitrary mean flows. The ray tracing employed by Rainville & Pinkel (Reference Rainville and Pinkel2006) and wave evolution equations derived in § 4 and the beginning of § 7 in Salmon (Reference Salmon2016), for example, require mean flows that vary on spatial scales much larger than a single wavelength. This approximation is usually inappropriate for the low-mode oceanic internal tide. On the other end of the spectrum of approximations is the ‘coupled-mode shallow water’ model developed by Kelly et al. (Reference Kelly, Lermusiaux, Duda and Haley2017), in which the hydrostatic Boussinesq equations are linearized around a mean flow of arbitrary scale and strength. The coupled-mode model is more general than the hydrostatic wave equation, but consists of three equations and resolves rapid oscillations on tidal frequencies. In contrast, the hydrostatic wave equation is a single equation that filters tidal-frequency oscillations by restricting attention to quasi-geostrophic mean flows.
The asymptotic models that most resemble the hydrostatic wave equation are the spectral models derived by Bartello (Reference Bartello1995) from the Boussinesq equations and by Warn (Reference Warn1986) and Ward & Dewar (Reference Ward and Dewar2010) from the shallow water equations. Like the hydrostatic wave equation, these models assume weak nonlinearity so that first-order terms describe linear wave propagation and second-order terms describe wave advection and refraction by quasi-geostrophic flow. Unlike the hydrostatic wave equation, however, the spectral models apply a projection onto wave modes and a resonance condition to obtain a set of ordinary differential equations for the evolution of discrete wave modes that exactly satisfy the linear dispersion relation. The hydrostatic wave equation instead is formulated in physical space and, crucially, describes parts of the wave field that deviate from the linear dispersion relation.
In the hydrostatic wave equation, the ocean’s dynamic pressure field
 $p$
is decomposed into a quasi-geostrophic component and a wave component with the single frequency
 $\unicode[STIX]{x1D70E}$
, so that
 $$\begin{eqnarray}p=f(\unicode[STIX]{x1D713}+\text{e}^{-\text{i}\unicode[STIX]{x1D70E}t}A+\text{e}^{\text{i}\unicode[STIX]{x1D70E}t}A^{\ast }),\end{eqnarray}$$
where
 $\unicode[STIX]{x1D713}(x,y,z,t)$
is the quasi-geostrophic streamfunction,
 $A(x,y,z,t)$
is the complex amplitude of the wavy pressure field oscillating with frequency
 $\unicode[STIX]{x1D70E}$
and
 $f=4\unicode[STIX]{x03C0}\sin \unicode[STIX]{x1D719}/\text{(sidereal day)}$
is the constant local inertial frequency at latitude
 $\unicode[STIX]{x1D719}$
. The pressure field in (1.1) is a special solution to the rotating, hydrostatic Boussinesq equations justified when initial conditions or forcing excite a combination of
 $\unicode[STIX]{x1D70E}$
-frequency and quasi-geostrophic motion. For the semidiurnal lunar tide, for example,
 $\unicode[STIX]{x1D70E}\approx 2\unicode[STIX]{x03C0}(12.42~\text{h})^{-1}\approx 1.405\times 10^{-4}~\text{s}^{-1}$
.
The hydrostatic wave equation is derived by assuming that weak nonlinear interactions drive the slow evolution of
 $\unicode[STIX]{x1D713}$
and
 $A$
over time scales much longer than
 $f^{-1}$
. In consequence, the dominant linear terms in the hydrostatic Boussinesq equations (2.1)–(2.5) imply that
 $A$
in (1.1) satisfies the approximate constraint
 $$\begin{eqnarray}\text{D}A\approx 0,\end{eqnarray}$$
where the ‘dispersion operator’
 $\text{D}$
is
 $$\begin{eqnarray}\text{D}\stackrel{\text{def}}{=}\underbrace{\unicode[STIX]{x2202}_{x}^{2}+\unicode[STIX]{x2202}_{y}^{2}}_{\stackrel{\text{def}}{=}\unicode[STIX]{x0394}}\,-\,\unicode[STIX]{x1D6FC}\,\underbrace{\unicode[STIX]{x2202}_{z}\frac{f^{2}}{N^{2}}\unicode[STIX]{x2202}_{z}}_{\stackrel{\text{def}}{=}\text{L}}.\end{eqnarray}$$
In (1.3)
 $N(z)$
is the buoyancy frequency at depth
 $z$
associated with an arbitrary background density stratification and we have defined the horizontal Laplacian
 $\unicode[STIX]{x0394}$
and vertical derivative operator
 $\text{L}$
. The non-dimensional parameter
 $$\begin{eqnarray}\unicode[STIX]{x1D6FC}\stackrel{\text{def}}{=}\frac{\unicode[STIX]{x1D70E}^{2}-f^{2}}{f^{2}}\end{eqnarray}$$
is the wave Burger number.
The dispersion constraint in (1.2) is tantamount to a statement that
 $A$
approximately obeys the hydrostatic dispersion relation. For example, for a plane wave in constant density stratification with horizontal and vertical wavenumbers
 $k$
and
 $m$
, the constraint
 $\text{D}A=0$
implies that
 $\unicode[STIX]{x1D6FC}=(Nk/fm)^{2}$
gives the scaled and squared aspect ratio of the wave field, so that through (1.4) its frequency satisfies the hydrostatic dispersion relation
 $\unicode[STIX]{x1D70E}^{2}=f^{2}(1+\unicode[STIX]{x1D6FC})=f^{2}+(Nk/m)^{2}$
. Equation (1.2) additionally implies that
 $A$
has negligible available potential vorticity, or ‘APV’, defined for small Rossby number flows by
 $Q=N^{-2}[v_{y}-u_{x}+\unicode[STIX]{x2202}_{z}(fb/N^{2})]$
, where
 $u$
and
 $v$
are horizontal velocities and
 $b$
is buoyancy. Equation (1.2) thus maintains the distinction between waves and flow that Wagner & Young (Reference Wagner and Young2015) show is a fundamental property of APV.
A distinctive feature of the hydrostatic wave equation is that the equality in (1.2) is approximate rather than exact, which means the hydrostatic wave equation describes the near-resonant dynamics of parts of the wave field that does not exactly satisfy the linear dispersion relation. After introducing the hydrostatic Boussinesq equations in § 2 and developing up the asymptotic and multiple time expansion in the beginning of § 3, our derivation takes the key step toward this description in § 3.3 by ‘reconstituting’ (Roberts Reference Roberts1985) the leading-order equation,
 $\text{D}A=0$
, with the first-order equation that describes the nonlinear interaction of
 $\unicode[STIX]{x1D713}$
and
 $A$
. Additional heuristic but well-motivated modifications described in § 4 then lead to the final form the of the hydrostatic wave equation,
 $$\begin{eqnarray}\displaystyle & & \displaystyle \text{E}A_{t}+\text{J}(\unicode[STIX]{x1D713},\text{E}A)+\text{i}\unicode[STIX]{x1D6FC}\unicode[STIX]{x1D70E}\text{D}A+\text{J}(A,\text{D}\unicode[STIX]{x1D713})-\frac{2\text{i}\unicode[STIX]{x1D70E}}{f^{2}}[\text{J}(\unicode[STIX]{x1D713}_{x},\text{i}\unicode[STIX]{x1D70E}A_{x}-fA_{y})+\text{J}(\unicode[STIX]{x1D713}_{y},\text{i}\unicode[STIX]{x1D70E}A_{y}+fA_{x})]\nonumber\\ \displaystyle & & \displaystyle \quad +\,\frac{\text{i}\unicode[STIX]{x1D70E}}{f}\left[\unicode[STIX]{x1D735}_{h}\boldsymbol{\cdot }(\text{D}\unicode[STIX]{x1D713}\unicode[STIX]{x1D735}_{h}A)-\text{D}\left(\frac{\unicode[STIX]{x1D6FC}f^{2}}{N^{2}}\unicode[STIX]{x1D713}_{z}A_{z}\right)+\unicode[STIX]{x2202}_{z}\left(\frac{\unicode[STIX]{x1D6FC}f^{2}}{N^{2}}\unicode[STIX]{x1D713}_{z}\text{D}A\right)\right]=0,\end{eqnarray}$$
where
 $\unicode[STIX]{x1D735}_{h}\stackrel{\text{def}}{=}\unicode[STIX]{x2202}_{x}\hat{\boldsymbol{x}}+\unicode[STIX]{x2202}_{y}\hat{\boldsymbol{y}}$
is the horizontal gradient, the Jacobian is
 $\text{J}(a,b)=a_{x}b_{y}-a_{y}b_{x}$
and the operator
 $\text{E}$
is
 $$\begin{eqnarray}\text{E}\stackrel{\text{def}}{=}\frac{\unicode[STIX]{x1D6FC}}{2}[\unicode[STIX]{x0394}+(4+3\unicode[STIX]{x1D6FC})\text{L}].\end{eqnarray}$$
The hydrostatic wave equation (1.5) describes the slow evolution of hydrostatic internal waves with a pressure field given by (1.1), in three-dimensional quasi-geostrophic flow with streamfunction
 $\unicode[STIX]{x1D713}(x,y,z,t)$
of arbitrary spatial scale and non-uniform background stratification with buoyancy frequency
 $N(z)$
.
A peculiar aspect of the hydrostatic wave equation in (1.5) is that it does not conserve either energy or the wave action defined by Bretherton & Garrett (Reference Bretherton and Garrett1968), which contrasts with the analogous ‘YBJ’ equation developed by Young & Ben Jelloul (Reference Young and Ben Jelloul1997) describing the linearized propagation of near-inertial waves through quasi-geostrophic flow. We demonstrate and discuss this non-conservation law of (1.5) in § 5.
We address both the correctness of the derivation and the applicability of (1.5) to oceanic flows in § 6 by comparing 60 numerical solutions to (1.5) with solutions to the hydrostatic Boussinesq equations linearized around decaying two-dimensional barotropic turbulence. The comparison reveals the accuracy of (1.5) for reasonable parameters and also illustrates how the model fails when the wave frequency is near inertial or when the mean flow is too strong. We conclude by discussing the physical implications and potential applications of the hydrostatic wave equation and its relatives in § 7.
2 The hydrostatic Boussinesq equations and ‘wave operator form’
The hydrostatic, rotating Boussinesq equations with constant inertial frequency
 $f$
are
 $$\begin{eqnarray}\displaystyle & u_{t}+\boldsymbol{u}\boldsymbol{\cdot }\unicode[STIX]{x1D735}u-fv+p_{x}=0, & \displaystyle\end{eqnarray}$$
 $$\begin{eqnarray}\displaystyle & v_{t}+\boldsymbol{u}\boldsymbol{\cdot }\unicode[STIX]{x1D735}v+fu+p_{y}=0, & \displaystyle\end{eqnarray}$$
 $$\begin{eqnarray}\displaystyle & p_{z}=b, & \displaystyle\end{eqnarray}$$
 $$\begin{eqnarray}\displaystyle & b_{t}+\boldsymbol{u}\boldsymbol{\cdot }\unicode[STIX]{x1D735}b+wN^{2}=0, & \displaystyle\end{eqnarray}$$
 $$\begin{eqnarray}\displaystyle & u_{x}+v_{y}+w_{z}=0. & \displaystyle\end{eqnarray}$$
The hydrostatic approximation made in (2.3) is sensible for motions with large horizontal scales and small vertical scales, which implies that vertical velocities and vertical accelerations are relatively small. For motions of frequency
 $\unicode[STIX]{x1D70E}$
, the continuity equation (2.5) and linear terms in the buoyancy equation (2.4) imply that
 $$\begin{eqnarray}w\sim \frac{H}{L}u\quad \text{and}\quad b\sim \frac{N_{0}^{2}}{\unicode[STIX]{x1D70E}}w\sim \frac{N_{0}^{2}H}{\unicode[STIX]{x1D70E}L}u,\end{eqnarray}$$
where
 $H$
and
 $L$
are the characteristic vertical and horizontal scales of the
 $\unicode[STIX]{x1D70E}$
-frequency motion and
 $N_{0}$
is the characteristic magnitude of the buoyancy frequency profile
 $N(z)$
. In consequence, the assumption that
 $w_{t}/b\ll 1$
that underlies the hydrostatic approximation is valid for motions with frequency
 $\unicode[STIX]{x1D70E}$
when
 $$\begin{eqnarray}\frac{w_{t}}{b}\sim \left(\frac{\unicode[STIX]{x1D70E}}{N_{0}}\right)^{2}\ll 1.\end{eqnarray}$$
In appendix A the hydrostatic Boussinesq equations (2.1)–(2.5) are manipulated into ‘wave operator form’,
 $$\begin{eqnarray}\displaystyle \unicode[STIX]{x2202}_{t}[\unicode[STIX]{x2202}_{t}^{2}\text{L}+f^{2}(\unicode[STIX]{x0394}+\text{L})]p & = & \displaystyle -f^{2}(\unicode[STIX]{x2202}_{t}\unicode[STIX]{x1D735}_{h}+f\unicode[STIX]{x1D735}_{\bot })\boldsymbol{\cdot }(\boldsymbol{u}\boldsymbol{\cdot }\unicode[STIX]{x1D735})\boldsymbol{u}\nonumber\\ \displaystyle & & \displaystyle -\,\unicode[STIX]{x2202}_{z}\frac{f^{2}}{N^{2}}(\unicode[STIX]{x2202}_{t}^{2}+f^{2})(\boldsymbol{u}\boldsymbol{\cdot }\unicode[STIX]{x1D735}p_{z}).\end{eqnarray}$$
In (2.8), the operators
 $\unicode[STIX]{x0394}$
and
 $\text{L}$
are defined in (1.3), while
 $$\begin{eqnarray}\unicode[STIX]{x1D735}_{h}=\unicode[STIX]{x2202}_{x}\hat{\boldsymbol{x}}+\unicode[STIX]{x2202}_{y}\hat{\boldsymbol{y}}\quad \text{and}\quad \unicode[STIX]{x1D735}_{\bot }\stackrel{\text{def}}{=}-\unicode[STIX]{x2202}_{y}\hat{\boldsymbol{x}}+\unicode[STIX]{x2202}_{x}\hat{\boldsymbol{y}}.\end{eqnarray}$$
The left-hand side of (2.8) is the hydrostatic internal wave operator acting on
 $p$
, while the right-hand side collects nonlinear terms. Equation (2.8) proves useful for the asymptotic development that follows, in which the nonlinear right-hand side terms are assumed small so that the left-hand side linear terms that dominate the dynamics over short time scales provide a complete description of the dynamics of the linear wave field.
3 The hydrostatic wave equation
We perform an asymptotic reduction of the hydrostatic Boussinesq equations (2.1)–(2.5) assuming that the solution is a weakly nonlinear combination of
 $\unicode[STIX]{x1D70E}$
-frequency and slowly evolving quasi-geostrophic motion. The relative magnitude of nonlinear terms in (2.1)–(2.5) is measured by
 $$\begin{eqnarray}\unicode[STIX]{x1D716}\stackrel{\text{def}}{=}\frac{U}{fL}\sim \frac{\boldsymbol{u}\boldsymbol{\cdot }\unicode[STIX]{x1D735}u}{fv}\ll 1,\end{eqnarray}$$
where
 $U$
is a typical velocity scale and
 $L$
is a typical length scale. We use the same length scale
 $L$
to characterize the wave field and the quasi-geostrophic flow. This prescription both ensures that our description holds when waves and quasi-geostrophic flow have comparable spatial scales, and permits further reduction for fixed
 $\unicode[STIX]{x1D716}$
under the assumption that waves or quasi-geostrophic flow have widely differing spatial scales. Note that when
 $U$
and
 $L$
characterize quasi-geostrophic flow
 $\unicode[STIX]{x1D716}$
is the Rossby number, whereas when
 $U$
and
 $L$
characterize the wave field
 $\unicode[STIX]{x1D716}$
is a measure of wave nonlinearity.
With
 $\unicode[STIX]{x1D716}\ll 1$
, the weak nonlinear advection of momentum and buoyancy described by (2.1)–(2.5) drives dynamics on slow time scales much longer than
 $f^{-1}$
. To capture this we propose the two-time expansion
 $$\begin{eqnarray}\unicode[STIX]{x2202}_{t}\mapsto \unicode[STIX]{x2202}_{\tilde{t}}+\unicode[STIX]{x1D716}\unicode[STIX]{x2202}_{\unicode[STIX]{x1D70F}},\end{eqnarray}$$
where
 $\tilde{t}\sim f^{-1}$
is the fast time scale of wave oscillations and
 $\unicode[STIX]{x1D70F}\sim L/U=(\unicode[STIX]{x1D716}f)^{-1}$
is the time scale of slow nonlinear wave evolution. The two-time expansion in (3.2) transforms the wave operator that acts on
 $p$
in (2.8) into
 $$\begin{eqnarray}\displaystyle & & \displaystyle (\unicode[STIX]{x2202}_{\tilde{t}}+\unicode[STIX]{x1D716}\unicode[STIX]{x2202}_{\unicode[STIX]{x1D70F}})[(\unicode[STIX]{x2202}_{\tilde{t}}^{2}+2\unicode[STIX]{x1D716}\unicode[STIX]{x2202}_{\tilde{t}}\unicode[STIX]{x2202}_{\unicode[STIX]{x1D70F}}+\unicode[STIX]{x1D716}^{2}\unicode[STIX]{x2202}_{\unicode[STIX]{x1D70F}}^{2})\text{L}+f^{2}(\unicode[STIX]{x0394}+\text{L})]\nonumber\\ \displaystyle & & \displaystyle \quad =\unicode[STIX]{x2202}_{\tilde{t}}[\unicode[STIX]{x2202}_{\tilde{t}}^{2}\text{L}+f^{2}(\unicode[STIX]{x0394}+\text{L})]+\unicode[STIX]{x1D716}\unicode[STIX]{x2202}_{\unicode[STIX]{x1D70F}}[3\unicode[STIX]{x2202}_{\tilde{t}}^{2}\text{L}+f^{2}(\unicode[STIX]{x0394}+\text{L})]+O(\unicode[STIX]{x1D716}^{2}).\end{eqnarray}$$
We isolate the slow evolution of hydrostatic internal waves over the long time scales of
 $\unicode[STIX]{x1D70F}$
by expanding
 $\boldsymbol{u}$
,
 $b$
and
 $p$
in
 $\unicode[STIX]{x1D716}$
, so that
 $p$
becomes, for example,
 $$\begin{eqnarray}p=\unicode[STIX]{x1D716}\,p_{1}+\unicode[STIX]{x1D716}^{2}p_{2}+\cdots .\end{eqnarray}$$
We develop the expansion by examining the hydrostatic Boussinesq equations (2.1)–(2.5) order by order in
 $\unicode[STIX]{x1D716}$
.
3.1 At leading order: linear dispersion and geostrophic balance
The leading-order terms in the hydrostatic Boussinesq equations in (2.1)–(2.5) are
 $$\begin{eqnarray}\displaystyle & u_{1\tilde{t}}-fv_{1}+p_{1x}=0, & \displaystyle\end{eqnarray}$$
 $$\begin{eqnarray}\displaystyle & v_{1\tilde{t}}+fu_{1}+p_{1y}=0, & \displaystyle\end{eqnarray}$$
 $$\begin{eqnarray}\displaystyle & p_{1z}=b_{1}, & \displaystyle\end{eqnarray}$$
 $$\begin{eqnarray}\displaystyle & b_{1\tilde{t}}+w_{1}N^{2}=0, & \displaystyle\end{eqnarray}$$
 $$\begin{eqnarray}\displaystyle & u_{1x}+v_{1y}+w_{1z}=0, & \displaystyle\end{eqnarray}$$
while the leading-order terms from the wave operator equation (2.8) are
 $$\begin{eqnarray}\unicode[STIX]{x2202}_{\tilde{t}}[\unicode[STIX]{x2202}_{\tilde{t}}^{2}\text{L}+f^{2}(\unicode[STIX]{x0394}+\text{L})]p_{1}=0.\end{eqnarray}$$
We assume the leading-order solution to (3.10) can be written as the sum of a quasi-geostrophic streamfunction and a wave field with frequency
 $\unicode[STIX]{x1D70E}$
, so that
 $$\begin{eqnarray}p_{1}=f(\unicode[STIX]{x1D713}+\text{e}^{-\text{i}\unicode[STIX]{x1D70E}\tilde{t}}A_{1}+\text{e}^{\text{i}\unicode[STIX]{x1D70E}\tilde{t}}A_{1}^{\ast }).\end{eqnarray}$$
Both
 $A_{1}$
and
 $\unicode[STIX]{x1D713}$
depend on
 $\boldsymbol{x}$
and the slow time
 $\unicode[STIX]{x1D70F}$
and have streamfunction units, so that
 $\unicode[STIX]{x1D735}_{\bot }A_{1}$
and
 $\unicode[STIX]{x1D735}_{\bot }\unicode[STIX]{x1D713}$
have units of velocity. Equations (3.5) and (3.6) imply that
 $\unicode[STIX]{x1D713}$
obeys geostrophic balance.
Equation (3.10) implies that
 $A_{1}$
obeys the linear
 $\unicode[STIX]{x1D70E}$
-frequency dispersion constraint:
 $$\begin{eqnarray}-\text{i}\unicode[STIX]{x1D70E}f^{3}[\underbrace{\unicode[STIX]{x0394}-\unicode[STIX]{x1D6FC}\text{L}}_{=\text{D}}]A_{1}=0,\end{eqnarray}$$
where
 $\unicode[STIX]{x1D6FC}=\unicode[STIX]{x1D70E}^{2}/f^{2}-1$
is the wave Burger number and
 $\text{D}=\unicode[STIX]{x0394}-\unicode[STIX]{x1D6FC}\text{L}$
is the dispersion operator defined in (1.3). When
 $\unicode[STIX]{x1D70E}=2f$
,
 $\text{D}=\unicode[STIX]{x0394}-3\text{L}$
is the operator that appears conspicuously in the
 $2f$
equation of Wagner & Young (Reference Wagner and Young2016).
Equation (3.7) implies that
 $$\begin{eqnarray}b_{1}=f(\unicode[STIX]{x1D713}_{z}+\text{e}^{-\text{i}\unicode[STIX]{x1D70E}\tilde{t}}A_{1z}+\text{e}^{\text{i}\unicode[STIX]{x1D70E}\tilde{t}}A_{1z}^{\ast }),\end{eqnarray}$$
and (3.8) subsequently yields
 $$\begin{eqnarray}w_{1}=\frac{\text{i}\unicode[STIX]{x1D70E}f}{N^{2}}(\text{e}^{-\text{i}\unicode[STIX]{x1D70E}\tilde{t}}A_{1z}-\text{e}^{\text{i}\unicode[STIX]{x1D70E}\tilde{t}}A_{1z}^{\ast }).\end{eqnarray}$$
By merging
 $\unicode[STIX]{x2202}_{\tilde{t}}(3.5)+f(3.6)$
with
 $\unicode[STIX]{x2202}_{\tilde{t}}(3.6)-f(3.5)$
we obtain a single vector equation for horizontal velocity
 $\boldsymbol{u}_{1h}=u_{1}\hat{\boldsymbol{x}}+v_{1}\hat{\boldsymbol{y}}$
,
 $$\begin{eqnarray}(\unicode[STIX]{x2202}_{\tilde{t}}^{2}+f^{2})\boldsymbol{u}_{1h}=-(\unicode[STIX]{x2202}_{\tilde{t}}\unicode[STIX]{x1D735}_{h}-f\unicode[STIX]{x1D735}_{\bot })p_{1},\end{eqnarray}$$
which we solve given
 $p_{1}$
in (3.11). The leading-order velocity field is thus related to
 $\unicode[STIX]{x1D713}$
and
 $A_{1}$
through
 $$\begin{eqnarray}\displaystyle \left(\begin{array}{@{}c@{}}u_{1}\\ v_{1}\\ w_{1}\end{array}\right)=\left(\begin{array}{@{}c@{}}-\unicode[STIX]{x2202}_{y}\\ \unicode[STIX]{x2202}_{x}\\ 0\end{array}\right)\unicode[STIX]{x1D713}-\frac{1}{\unicode[STIX]{x1D6FC}f}\left(\begin{array}{@{}c@{}}\text{i}\unicode[STIX]{x1D70E}\unicode[STIX]{x2202}_{x}-f\unicode[STIX]{x2202}_{y}\\ \text{i}\unicode[STIX]{x1D70E}\unicode[STIX]{x2202}_{y}+f\unicode[STIX]{x2202}_{x}\\ -{\displaystyle \frac{\text{i}\unicode[STIX]{x1D70E}\unicode[STIX]{x1D6FC}f^{2}}{N^{2}}}\unicode[STIX]{x2202}_{z}\end{array}\right)\text{e}^{-\text{i}\unicode[STIX]{x1D70E}\tilde{t}}A_{1}+\frac{1}{\unicode[STIX]{x1D6FC}f}\left(\begin{array}{@{}c@{}}\text{i}\unicode[STIX]{x1D70E}\unicode[STIX]{x2202}_{x}+f\unicode[STIX]{x2202}_{y}\\ \text{i}\unicode[STIX]{x1D70E}\unicode[STIX]{x2202}_{y}-f\unicode[STIX]{x2202}_{x}\\ -{\displaystyle \frac{\text{i}\unicode[STIX]{x1D70E}\unicode[STIX]{x1D6FC}f^{2}}{N^{2}}}\unicode[STIX]{x2202}_{z}\end{array}\right)\text{e}^{\text{i}\unicode[STIX]{x1D70E}\tilde{t}}A_{1}^{\ast },\qquad & & \displaystyle\end{eqnarray}$$
where we have used
 $\unicode[STIX]{x1D70E}^{2}-f^{2}=\unicode[STIX]{x1D6FC}f^{2}$
. More properties of the leading-order solution to (3.5)–(3.9) are given in § B.1.
3.2 At second order: slow wave evolution
The
 $O(\unicode[STIX]{x1D716}^{2})$
terms in the wave operator equation (2.8) are
 $$\begin{eqnarray}\displaystyle & & \displaystyle f^{3}(\unicode[STIX]{x0394}+\text{L})\unicode[STIX]{x1D713}_{\unicode[STIX]{x1D70F}}+f[f^{2}\unicode[STIX]{x0394}-(3\unicode[STIX]{x1D70E}^{2}-f^{2})\text{L}][\text{e}^{-\text{i}\unicode[STIX]{x1D70E}\tilde{t}}A_{1\unicode[STIX]{x1D70F}}+\text{e}^{\text{i}\unicode[STIX]{x1D70E}\tilde{t}}A_{1\unicode[STIX]{x1D70F}}^{\ast }]\nonumber\\ \displaystyle & & \displaystyle \quad +\,[\unicode[STIX]{x2202}_{\tilde{t}}^{2}\text{L}+f^{2}(\unicode[STIX]{x0394}+\text{L})]p_{2\tilde{t}}=\text{RHS}(\unicode[STIX]{x1D713},A_{1}).\end{eqnarray}$$
In (3.17),
 $\text{RHS}(\unicode[STIX]{x1D713},A_{1})$
is short for the
 $O(\unicode[STIX]{x1D716}^{2})$
nonlinear terms in (2.8) evaluated using the leading-order solution and defined by
 $$\begin{eqnarray}\text{RHS}(\unicode[STIX]{x1D713},A_{1})\stackrel{\text{def}}{=}-f^{2}(\unicode[STIX]{x2202}_{\tilde{t}}\unicode[STIX]{x1D735}_{h}+f\unicode[STIX]{x1D735}_{\bot })\boldsymbol{\cdot }(\boldsymbol{u}_{1}\boldsymbol{\cdot }\unicode[STIX]{x1D735})\boldsymbol{u}_{1}-\unicode[STIX]{x2202}_{z}\frac{f^{2}}{N^{2}}(\unicode[STIX]{x2202}_{\tilde{t}}^{2}+f^{2})(\boldsymbol{u}_{1}\boldsymbol{\cdot }\unicode[STIX]{x1D735}b_{1}).\end{eqnarray}$$
Equation (3.17) describes the slow evolution and propagation of
 $A_{1}$
, quasi-geostrophic evolution and nonlinear wave dynamics that generate both quasi-steady mean flows and wave harmonics with frequency
 $2\unicode[STIX]{x1D70E}$
.
The quasi-geostrophic streamfunction
 $\unicode[STIX]{x1D713}$
evolves due to its advection of quasi-geostrophic potential vorticity,
 $q$
according to the ordinary quasi-geostrophic equation,
 $$\begin{eqnarray}q_{\unicode[STIX]{x1D70F}}+\text{J}(\unicode[STIX]{x1D713},q)=0,\quad \text{where }q\stackrel{\text{def}}{=}(\unicode[STIX]{x0394}+\text{L})\unicode[STIX]{x1D713}.\end{eqnarray}$$
The independence of
 $q$
from
 $A_{1}$
in (3.19) requires the assumption that waves and flow share common velocity and length scales, and thus have similar ‘amplitudes’ as measured by the single parameter
 $\unicode[STIX]{x1D716}$
. A simple derivation of equation (3.19) is given in Wagner (Reference Wagner2016, chap. 1.2) under the same assumption that waves and flow have similar amplitudes, using available potential vorticity and a two-time expansion.
We focus on the slow evolution of
 $\unicode[STIX]{x1D70E}$
-frequency motions by multiplying (3.17) with
 $\text{e}^{\text{i}\unicode[STIX]{x1D70E}\tilde{t}}$
and averaging the result in
 $\tilde{t}$
over a wave period
 $2\unicode[STIX]{x03C0}/\unicode[STIX]{x1D70E}$
. The average is denoted with an overbar and defined by
 $$\begin{eqnarray}\bar{\unicode[STIX]{x1D719}}(\unicode[STIX]{x1D70F})=\frac{\unicode[STIX]{x1D70E}}{2\unicode[STIX]{x03C0}}\int _{\unicode[STIX]{x1D70F}-(\unicode[STIX]{x03C0}/\unicode[STIX]{x1D70E})}^{\unicode[STIX]{x1D70F}+(\unicode[STIX]{x03C0}/\unicode[STIX]{x1D70E})}\unicode[STIX]{x1D719}(\unicode[STIX]{x1D70F},\tilde{t})\,\,\text{d}\tilde{t},\end{eqnarray}$$
for any quantity
 $\unicode[STIX]{x1D719}(\unicode[STIX]{x1D70F},\tilde{t})$
. This average has the property that
 $\overline{\text{e}^{2\text{i}\unicode[STIX]{x1D70E}\tilde{t}}A_{1}^{\ast }}=0$
and
 $\bar{A_{1}}=A_{1}$
, for example, because
 $A_{1}$
does not depend on the fast time
 $\tilde{t}$
. In consequence, the operation
 $\overline{\text{e}^{\text{i}\unicode[STIX]{x1D70E}\tilde{t}}(3.17)}$
isolates terms in (3.17) proportional to
 $\text{e}^{-\text{i}\unicode[STIX]{x1D70E}\tilde{t}}$
, yielding
 $$\begin{eqnarray}f[f^{2}\unicode[STIX]{x0394}-(3\unicode[STIX]{x1D70E}^{2}-f^{2})\text{L}]A_{1\unicode[STIX]{x1D70F}}-\text{i}\unicode[STIX]{x1D70E}f^{3}\text{D}A_{2}=\overline{\text{e}^{\text{i}\unicode[STIX]{x1D70E}\tilde{t}}\text{RHS}}.\end{eqnarray}$$
In forming (3.21) we assume that
 $p_{2}$
takes the form
 $$\begin{eqnarray}p_{2}=f(\text{e}^{-\text{i}\unicode[STIX]{x1D70E}\tilde{t}}A_{2}+\text{e}^{\text{i}\unicode[STIX]{x1D70E}\tilde{t}}A_{2}^{\ast })+\cdots ,\end{eqnarray}$$
where the dots represent unimportant steady and
 $2\unicode[STIX]{x1D70E}$
-frequency parts of
 $p_{2}$
, and
 $A_{2}=f^{-1}\overline{\text{e}^{\text{i}\unicode[STIX]{x1D70E}\tilde{t}}p_{2}}$
is the
 $O(\unicode[STIX]{x1D716})$
correction to
 $A_{1}$
.
The bookkeeping required to parse RHS for terms proportional to
 $\text{e}^{-\text{i}\unicode[STIX]{x1D70E}\tilde{t}}$
and thus identify the right-hand side of (3.21) is detailed in appendix B. After multiplying by
 $\unicode[STIX]{x1D6FC}/f$
, the result is
 $$\begin{eqnarray}\displaystyle \frac{\unicode[STIX]{x1D6FC}}{f}\overline{\text{e}^{\text{i}\unicode[STIX]{x1D70E}\tilde{t}}\text{RHS}} & = & \displaystyle (\unicode[STIX]{x1D70E}^{2}+f^{2})\text{J}(\unicode[STIX]{x1D713},\unicode[STIX]{x0394}A_{1})+(\unicode[STIX]{x1D6FC}f)^{2}\text{J}(\unicode[STIX]{x1D713},\text{L}A_{1})+f^{2}\text{J}(A_{1},\text{D}\unicode[STIX]{x1D713})\nonumber\\ \displaystyle & & \displaystyle -\,2\text{i}\unicode[STIX]{x1D70E}[\text{J}(\unicode[STIX]{x1D713}_{x},\text{i}\unicode[STIX]{x1D70E}A_{1x}-fA_{1y})+\text{J}(\unicode[STIX]{x1D713}_{y},\text{i}\unicode[STIX]{x1D70E}A_{1y}+fA_{1x})]\nonumber\\ \displaystyle & & \displaystyle +\,\text{i}\unicode[STIX]{x1D70E}f\left[\unicode[STIX]{x1D735}_{h}\boldsymbol{\cdot }\left(\text{D}\unicode[STIX]{x1D713}\unicode[STIX]{x1D735}_{h}A_{1}\right)-\text{D}\left(\frac{\unicode[STIX]{x1D6FC}f^{2}}{N^{2}}\unicode[STIX]{x1D713}_{z}A_{1z}\right)+\unicode[STIX]{x2202}_{z}\left(\frac{\unicode[STIX]{x1D6FC}f^{2}}{N^{2}}\unicode[STIX]{x1D713}_{z}\text{D}A_{1}\right)\right].\qquad\end{eqnarray}$$
With (3.23) the major algebraic challenge in deriving the hydrostatic wave equation is behind us.
Two different approaches may now be used to develop a wave evolution model from the leading-order equation (3.12) and first-order equation (3.21). One approach is to move into the spectral space associated with eigenfunctions or ‘wave modes’ of the operator
 $\text{D}$
. In this approach the first step is then to project the leading-order equation (3.12) onto wave modes, which defines the spectral components of
 $A_{1}$
and solves (3.12) exactly. Next, projecting the first-order equation (3.21) onto wave modes eliminates
 $\text{D}A_{2}$
and isolates the slow evolution of those spectral components of
 $A_{1}$
. This strategy was employed, for example, by Warn (Reference Warn1986), Bartello (Reference Bartello1995) and Ward & Dewar (Reference Ward and Dewar2010). We take a different approach, however: reconstitution.
3.3 Reconstitution
Rather than solve the leading-order equation (3.12) exactly, we instead reconstitute the asymptotic expansion by adding (3.12) to the first-order equation (3.21) to obtain a single equation for the total wave amplitude
 $A=\unicode[STIX]{x1D716}\,A_{1}+\unicode[STIX]{x1D716}^{2}A_{2}$
. After multiplying by
 $\unicode[STIX]{x1D6FC}/\unicode[STIX]{x1D716}f$
and rearranging terms, the result is
 $$\begin{eqnarray}\displaystyle & & \displaystyle -\unicode[STIX]{x1D6FC}[f^{2}\unicode[STIX]{x0394}-(3\unicode[STIX]{x1D70E}^{2}-f^{2})\text{L}]A_{\unicode[STIX]{x1D70F}}+\text{i}\unicode[STIX]{x1D6FC}\unicode[STIX]{x1D70E}f^{2}\text{D}A\nonumber\\ \displaystyle & & \displaystyle \quad +\,(\unicode[STIX]{x1D70E}^{2}+f^{2})\text{J}(\unicode[STIX]{x1D713},\unicode[STIX]{x0394}A)+(\unicode[STIX]{x1D6FC}f)^{2}\text{J}(\unicode[STIX]{x1D713},\text{L}A)+f^{2}\text{J}(A,\text{D}\unicode[STIX]{x1D713})\nonumber\\ \displaystyle & & \displaystyle \quad -\,2\text{i}\unicode[STIX]{x1D70E}[\text{J}(\unicode[STIX]{x1D713}_{x},\text{i}\unicode[STIX]{x1D70E}A_{x}-fA_{y})+\text{J}(\unicode[STIX]{x1D713}_{y},\text{i}\unicode[STIX]{x1D70E}A_{y}+fA_{x})]\nonumber\\ \displaystyle & & \displaystyle \quad +\,\text{i}\unicode[STIX]{x1D70E}f\left[\unicode[STIX]{x1D735}_{h}\boldsymbol{\cdot }(\text{D}\unicode[STIX]{x1D713}\unicode[STIX]{x1D735}_{h}A)-\text{D}\left(\frac{\unicode[STIX]{x1D6FC}f^{2}}{N^{2}}\unicode[STIX]{x1D713}_{z}A_{z}\right)+\unicode[STIX]{x2202}_{z}\left(\frac{\unicode[STIX]{x1D6FC}f^{2}}{N^{2}}\unicode[STIX]{x1D713}_{z}\text{D}A\right)\right]=O(\unicode[STIX]{x1D716}^{3}f^{4}).\qquad\end{eqnarray}$$
Excepting the two terms that involve
 $\text{D}A$
, all terms on the left-hand side of (3.24) scale with
 $\unicode[STIX]{x1D6FC}f^{2}\unicode[STIX]{x0394}A_{\unicode[STIX]{x1D70F}}\sim \unicode[STIX]{x1D716}^{2}f^{4}$
. The residual on the right-hand side of (3.24) thus implies the error incurred during reconstitution is
 $O(\unicode[STIX]{x1D716})$
and of same magnitude as terms already neglected by the perturbation expansion. In this sense, (3.24) is asymptotically equivalent to the original hydrostatic Boussinesq equations.
Here, the consequence of reconstitution is that the leading-order equation (3.12) is not exactly satisfied, so that
 $\text{D}A\neq 0$
in general. As a result, equation (3.24) describes the evolution of wave modes with frequencies slightly different than
 $\unicode[STIX]{x1D70E}$
; or in other words, equation (3.24) describes both resonant and near-resonant interactions between
 $\unicode[STIX]{x1D713}$
and
 $A$
. This expansion of the descriptive power of (3.24) is an advantage of the method of reconstitution and is analogous, as explained by Roberts (Reference Roberts1985), to the improvements bestowed by reconstitution on other asymptotic models such as the nonlinear Schrödinger equation for surface waves and the Navier–Stokes equations. Because the dispersion terms
 $\text{i}\unicode[STIX]{x1D6FC}f^{2}\unicode[STIX]{x0394}A$
and
 $\text{i}\unicode[STIX]{x1D6FC}^{2}f^{2}\text{L}A$
in
 $\text{i}\unicode[STIX]{x1D6FC}f^{2}\text{D}A$
are the largest in (3.24) by
 $\unicode[STIX]{x1D716}^{-1}$
, solutions to (3.24) still approximately satisfy
 $\text{D}A\approx 0$
so that
 $A$
remains tethered to the
 $\unicode[STIX]{x1D70E}$
-frequency hydrostatic dispersion relation when
 $\unicode[STIX]{x1D716}\ll 1$
and
 $\unicode[STIX]{x1D6FC}=O(1)$
.
4 Remodelling
Equation (3.24) achieves the goal of this paper and provides a valid description of the propagation of hydrostatic waves through quasi-geostrophic flows. Yet several shortcomings either limit the range of its validity or prevent its practical implementation. Its principal shortcoming is that the operator acting on
 $A_{\unicode[STIX]{x1D70F}}$
on the first line of (3.24) cannot be inverted in general. The second shortcoming is that (3.24) is not Galilean invariant: its form is not preserved under translation by a uniform velocity implied by the two transformations
 $\unicode[STIX]{x1D713}\mapsto -Uy+Vx+\unicode[STIX]{x1D713}$
and
 $\unicode[STIX]{x2202}_{\unicode[STIX]{x1D70F}}+U\unicode[STIX]{x2202}_{x}+V\unicode[STIX]{x2202}_{y}\mapsto \unicode[STIX]{x2202}_{\unicode[STIX]{x1D70F}}$
. The lack of Galilean invariance hampers the description of Doppler shifting of wave field frequency by relatively uniform quasi-geostrophic flow by (3.24).
We address these issues by modifying the model by adding two small
 $O(\unicode[STIX]{x1D716}^{3}f^{4})$
terms proportional to
 $\text{D}A_{\unicode[STIX]{x1D70F}}$
and
 $\text{J}\left(\unicode[STIX]{x1D713},\text{D}A\right)$
to (3.24). While this addition does not change our estimated magnitude of the residual on the right of (3.24), it generates a worrisome side effect: we are now confronted with a ‘plethora of permissible forms’ for the hydrostatic wave equation, in the words of Roberts (Reference Roberts1985), which correspond to different and seemingly equally valid choices for the two additional
 $O(\unicode[STIX]{x1D716}^{3}f^{4})$
terms.
We resolve this ambiguity by adding a third physically motivated constraint that the additional terms must improve the approximate dispersion relation of the hydrostatic wave equation. We satisfy the dispersion improvement criterion by selecting the small additional terms so that a Taylor expansion of the hydrostatic wave equation’s dispersion relation matches a Taylor expansion of the hydrostatic Boussinesq dispersion relation to as high an order as possible. Dispersion improvement is sought by Trulsen & Dysthe (Reference Trulsen and Dysthe1996) and Thomas, Smith & Bühler (Reference Thomas, Smith and Bühler2017) using slightly different methods to increase the accuracy of reduced equations for surface gravity waves and near-inertial waves, respectively, and Thomas (Reference Thomas2017) show that a directly analogous modification improves an asymptotic model for acoustic waves. We posit that this improvement of the hydrostatic wave equation follows the advice of Roberts (Reference Roberts1985) to choose a reconstituted equation with ‘the most direct connection to the original full equations’.
4.1 An improved approximation to linear dispersion
We first modify (3.24) by adding the linear term
 $c\unicode[STIX]{x1D6FC}f^{2}\text{D}A_{\unicode[STIX]{x1D70F}}$
, where
 $c$
is a constant determined by fitting the dispersion relation of the resulting equation to the exact dispersion relation implied by the hydrostatic Boussinesq system. This improvement to (3.24) produces an equation that more faithfully describes exact linear dispersion when
 $\text{D}A\neq 0$
.
After dividing by
 $\unicode[STIX]{x1D6FC}$
, the linear terms in the modified equation
 $(3.24)+c\unicode[STIX]{x1D6FC}f^{2}\text{D}A_{\unicode[STIX]{x1D70F}}$
that remain when
 $\unicode[STIX]{x1D713}=0$
are
 $$\begin{eqnarray}[f^{2}(c+1)\text{D}-2\unicode[STIX]{x1D70E}^{2}\text{L}]A_{\unicode[STIX]{x1D70F}}-\text{i}\unicode[STIX]{x1D70E}f^{2}(\unicode[STIX]{x0394}-\unicode[STIX]{x1D6FC}\text{L})A=0.\end{eqnarray}$$
Assuming the spectral representation
 $A\sim \text{e}^{\text{i}kx-\text{i}\unicode[STIX]{x1D70D}\unicode[STIX]{x1D70F}}h_{nz}(z)$
, where
 $k$
is a horizontal wavenumber,
 $\unicode[STIX]{x1D70D}$
is the deviation in wave frequency from
 $\unicode[STIX]{x1D70E}$
, and
 $h_{n}$
are the hydrostatic vertical modes that solve the eigenproblem
 $$\begin{eqnarray}\frac{f^{2}}{N^{2}}h_{nzz}+\unicode[STIX]{x1D705}_{n}^{2}h_{n}=0,\quad \text{with}\;h_{n}=0\text{ at }z=-H,0,\end{eqnarray}$$
leads to the linear dispersion relation implied by (4.1),
 $$\begin{eqnarray}\unicode[STIX]{x1D70E}+\unicode[STIX]{x1D70D}=\unicode[STIX]{x1D70E}+\frac{\unicode[STIX]{x1D70E}f^{2}(k^{2}-\unicode[STIX]{x1D6FC}\unicode[STIX]{x1D705}_{n}^{2})}{2(\unicode[STIX]{x1D70E}\unicode[STIX]{x1D705}_{n})^{2}-f^{2}(c+1)(k^{2}-\unicode[STIX]{x1D6FC}\unicode[STIX]{x1D705}_{n}^{2})}.\end{eqnarray}$$
The dispersion relation in (4.3) is an expansion of the exact vertical mode-
 $n$
hydrostatic dispersion relation,
 $$\begin{eqnarray}\unicode[STIX]{x1D6F4}=\pm f\sqrt{1+\frac{k^{2}}{\unicode[STIX]{x1D705}_{n}^{2}}},\end{eqnarray}$$
around the wavenumber combinations
 $k=\unicode[STIX]{x1D705}_{n}\sqrt{\unicode[STIX]{x1D6FC}}$
that correspond to
 $\unicode[STIX]{x1D6F4}=\unicode[STIX]{x1D70E}$
.
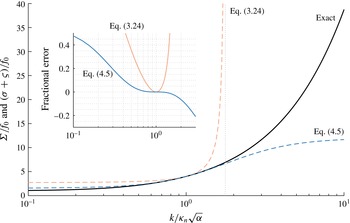
Comparison of the exact hydrostatic mode-
 $n$
Boussinesq dispersion relation
 $\unicode[STIX]{x1D6F4}/f$
with the dispersion relations
 $(\unicode[STIX]{x1D70E}+\unicode[STIX]{x1D70D})/f$
implied by (3.24) and (4.5).
 $\unicode[STIX]{x1D6F4}/f$
is given in (4.4) while
 $(\unicode[STIX]{x1D70E}+\unicode[STIX]{x1D70D})/f$
for (3.24) and (4.5) is given by (4.3) with
 $c=0$
and
 $c=-3/2$
, respectively. All three are plotted in the main figure versus
 $k/\unicode[STIX]{x1D705}_{n}\sqrt{\unicode[STIX]{x1D6FC}}$
on a logarithmic
 $x$
-axis. A grey dotted line shows the asymptote at
 $k/\unicode[STIX]{x1D705}_{n}\sqrt{\unicode[STIX]{x1D6FC}}=\sqrt{2(1+\unicode[STIX]{x1D6FC}^{-1})}$
where the dispersion relation implied by (3.24) is undefined. The inset shows the fractional error
 $(\unicode[STIX]{x1D70E}+\unicode[STIX]{x1D70D}-\unicode[STIX]{x1D6F4})/\unicode[STIX]{x1D6F4}$
versus
 $k/\unicode[STIX]{x1D705}_{n}\sqrt{\unicode[STIX]{x1D6FC}}$
.

Taking one derivative of (4.3) and (4.4) with respect to
 $k$
while holding
 $\unicode[STIX]{x1D705}_{n}$
constant reveals that
 $\unicode[STIX]{x1D6F4}_{k}=\unicode[STIX]{x1D70D}_{k}$
at
 $k=\unicode[STIX]{x1D705}_{n}\sqrt{\unicode[STIX]{x1D6FC}}$
. This means that (4.1) correctly captures the group velocity of waves with frequency
 $\unicode[STIX]{x1D70E}$
regardless of the value of
 $c$
. We choose
 $c=-3/2$
, therefore, to match the second derivatives
 $\unicode[STIX]{x1D70D}_{kk}$
and
 $\unicode[STIX]{x1D6F4}_{kk}$
so that the approximate dispersion relation
 $\unicode[STIX]{x1D70E}+\unicode[STIX]{x1D70D}$
osculates the exact dispersion relation
 $\unicode[STIX]{x1D6F4}$
. The choice
 $c=-3/2$
also fixes the non-invertability of the operator that acts on
 $A_{\unicode[STIX]{x1D70F}}$
in (3.24). The linear terms in the improved equation
 $f^{-2}(3.24)-3\unicode[STIX]{x1D6FC}\text{D}A_{\unicode[STIX]{x1D70F}}/2$
that remain when
 $\unicode[STIX]{x1D713}=0$
are then
 $$\begin{eqnarray}\frac{\unicode[STIX]{x1D6FC}}{2}[\unicode[STIX]{x0394}+(4+3\unicode[STIX]{x1D6FC})\text{L}]A_{\unicode[STIX]{x1D70F}}+\text{i}\unicode[STIX]{x1D6FC}\unicode[STIX]{x1D70E}\text{D}A=0.\end{eqnarray}$$
Figure 1 compares the raw dispersion relation implied by (3.24) and the improved dispersion relation implied by (4.5) with the exact dispersion relation of the hydrostatic Boussinesq system.
4.2 Restoration of Galilean invariance
The advection terms in (3.24) have the form
 $\text{J}(\unicode[STIX]{x1D713},\bullet )$
. These
 $\unicode[STIX]{x1D713}$
-dependent terms remain when the mean flow
 $U\hat{\boldsymbol{x}}+V\hat{\boldsymbol{y}}$
is horizontal and uniform with streamfunction
 $\unicode[STIX]{x1D713}=-Uy+Vx$
. Using
 $\unicode[STIX]{x1D70E}^{2}/f^{2}=\unicode[STIX]{x1D6FC}+1$
, the advection terms in the improved equation
 $f^{-2}(3.24)-3\unicode[STIX]{x1D6FC}\text{D}A_{\unicode[STIX]{x1D70F}}/2$
become
 $$\begin{eqnarray}\frac{\unicode[STIX]{x1D6FC}}{2}[\unicode[STIX]{x0394}+(4+3\unicode[STIX]{x1D6FC})\text{L}]A_{\unicode[STIX]{x1D70F}}+\text{J}(\unicode[STIX]{x1D713},[\unicode[STIX]{x1D6FC}+2]\unicode[STIX]{x0394}A+\unicode[STIX]{x1D6FC}^{2}\text{L}A).\end{eqnarray}$$
Adding the small term
 $$\begin{eqnarray}-\left(\frac{1}{2}+\frac{2}{\unicode[STIX]{x1D6FC}}\right)\text{J}(\unicode[STIX]{x1D713},\text{D}A)\end{eqnarray}$$
to (4.6) produces
 $$\begin{eqnarray}\text{E}A_{\unicode[STIX]{x1D70F}}+\text{J}(\unicode[STIX]{x1D713},\text{E}A),\end{eqnarray}$$
where
 $$\begin{eqnarray}\text{E}\stackrel{\text{def}}{=}\frac{\unicode[STIX]{x1D6FC}}{2}[\unicode[STIX]{x0394}+(4+3\unicode[STIX]{x1D6FC})\text{L}].\end{eqnarray}$$
The terms in (4.8) describe the advection of the wave quantity
 $\text{E}A$
by a velocity field associated with
 $\unicode[STIX]{x1D713}$
. Galilean invariance follows from the preservation of form under the simultaneous transformations
 $\unicode[STIX]{x1D713}\mapsto -Uy+Vx+\unicode[STIX]{x1D713}$
and
 $\unicode[STIX]{x2202}_{\unicode[STIX]{x1D70F}}\mapsto \unicode[STIX]{x2202}_{\unicode[STIX]{x1D70F}}-U\unicode[STIX]{x2202}_{x}-V\unicode[STIX]{x2202}_{y}$
.
The two remodelling steps produce the much improved equation
 $$\begin{eqnarray}f^{-2}(3.24)-\frac{3\unicode[STIX]{x1D6FC}}{2}\text{D}A_{\unicode[STIX]{x1D70F}}-\left(\frac{1}{2}+\frac{2}{\unicode[STIX]{x1D6FC}}\right)\text{J}(\unicode[STIX]{x1D713},\text{D}A),\end{eqnarray}$$
which rearranges into
 $$\begin{eqnarray}\displaystyle & & \displaystyle \text{E}A_{\unicode[STIX]{x1D70F}}+\text{J}(\unicode[STIX]{x1D713},\text{E}A)+\text{i}\unicode[STIX]{x1D6FC}\unicode[STIX]{x1D70E}\text{D}A+\text{J}(A,\text{D}\unicode[STIX]{x1D713})-\frac{2\text{i}\unicode[STIX]{x1D70E}}{f^{2}}[\text{J}(\unicode[STIX]{x1D713}_{x},\text{i}\unicode[STIX]{x1D70E}A_{x}-fA_{y})+\text{J}(\unicode[STIX]{x1D713}_{y},\text{i}\unicode[STIX]{x1D70E}A_{y}+fA_{x})]\nonumber\\ \displaystyle & & \displaystyle \quad +\,\frac{\text{i}\unicode[STIX]{x1D70E}}{f}\left[\unicode[STIX]{x1D735}_{h}\boldsymbol{\cdot }(\text{D}\unicode[STIX]{x1D713}\unicode[STIX]{x1D735}_{h}A)-\text{D}\left(\frac{\unicode[STIX]{x1D6FC}f^{2}}{N^{2}}\unicode[STIX]{x1D713}_{z}A_{z}\right)+\unicode[STIX]{x2202}_{z}\left(\frac{\unicode[STIX]{x1D6FC}f^{2}}{N^{2}}\unicode[STIX]{x1D713}_{z}\text{D}A\right)\right]=0.\end{eqnarray}$$
For the final remodelling step, we reconsolidate the slow and fast time scale to write (4.11) in terms of the single time scale
 $t$
. The result is (1.5).
4.3 Quasi-geostrophic perturbation of the mean stratification
In §§ 4.1 and 4.2 we added small terms to (3.24) to produce the much improved equation (4.11). Note, however, that (3.24) already contains one small term,
 $$\begin{eqnarray}\unicode[STIX]{x2202}_{z}\left(\frac{\unicode[STIX]{x1D6FC}f^{2}}{N^{2}}\unicode[STIX]{x1D713}_{z}\text{D}A\right),\end{eqnarray}$$
which has the same magnitude as the terms neglected in constructing (3.24). We retain the small term (4.12) because it means the remodelled equation (4.11) more faithfully encodes the dynamics associated with a quasi-geostrophic perturbation to the background density stratification.
This physical process is isolated by considering the case where
 $\unicode[STIX]{x1D713}(z)$
depends only on
 $z$
, so that
 $\unicode[STIX]{x1D713}$
has no associated flow and acts only to perturb the buoyancy frequency from
 $N^{2}$
to
 $N^{2}+f\unicode[STIX]{x1D713}_{zz}$
. In this case, the familiar vertical differential operator
 $\text{L}$
defined in (1.3) is correspondingly perturbed into
 $$\begin{eqnarray}\unicode[STIX]{x2202}_{z}\frac{f^{2}}{N^{2}+f\unicode[STIX]{x1D713}_{zz}}\unicode[STIX]{x2202}_{z}=\text{L}\underbrace{-\unicode[STIX]{x2202}_{z}\frac{f^{4}}{N^{4}}\frac{\unicode[STIX]{x1D713}_{zz}}{f}\unicode[STIX]{x2202}_{z}}_{\stackrel{\text{def}}{=}\text{M}}+O(\unicode[STIX]{x1D716}^{2}\text{L}),\end{eqnarray}$$
where
 $\text{M}$
is the
 $O(\unicode[STIX]{x1D716})$
perturbation to
 $\text{L}$
. Similar to the principle that our model should retain the Boussinesq property of Galilean invariance in the case of uniform flow, an acceptable approximation must capture the
 $O(\unicode[STIX]{x1D716})$
perturbation to the density stratification and dispersion relation induced by
 $f\unicode[STIX]{x1D713}_{z}$
and
 $\text{M}$
.
Now consider the simplification of (4.11) when
 $\unicode[STIX]{x1D713}=\unicode[STIX]{x1D713}(z)$
. First, the Jacobians on the first and second lines of (4.11) all reduce to zero. Next, some intricate simplifications of the third line of (4.11), aided by the non-obvious identity
 $$\begin{eqnarray}\unicode[STIX]{x2202}_{z}\left(\frac{f^{2}}{N^{2}}\unicode[STIX]{x1D713}_{z}\text{L}A\right)-\text{L}\left(\frac{f^{2}}{N^{2}}\unicode[STIX]{x1D713}_{z}A_{z}\right)=f\text{M}A,\end{eqnarray}$$
eventually reduce (4.11) to
 $$\begin{eqnarray}\text{E}A_{\unicode[STIX]{x1D70F}}+\text{i}\unicode[STIX]{x1D6FC}\unicode[STIX]{x1D70E}[\unicode[STIX]{x0394}-\unicode[STIX]{x1D6FC}(\text{L}+\text{M})]A=0.\end{eqnarray}$$
The effect of the static streamfunction
 $\unicode[STIX]{x1D713}(z)$
is reduced to a transformation of the dispersion operator
 $\text{D}$
from
 $\unicode[STIX]{x0394}-\unicode[STIX]{x1D6FC}\text{L}$
to
 $\unicode[STIX]{x0394}-\unicode[STIX]{x1D6FC}\left(\text{L}+\text{M}\right)$
. The formation of the proper perturbed operator
 $\text{L}+\text{M}$
in (4.15) requires the participation of the small term (4.12). The inclusion of (4.12) thus gives (4.11) a more faithful description of the modification of internal wave dispersion by quasi-geostrophic perturbations to the density stratification.
5 The non-conservation of wave action
Bretherton & Garrett (Reference Bretherton and Garrett1968) show that the amplitudes of slowly varying waves in inhomogeneous moving media are determined by the conservation of an adiabatic invariant called ‘wave action’. Wave action is defined as wave energy divided by intrinsic frequency, or the frequency of the wave field measured by an observer moving with the local velocity of the medium. Wave action conservation shows explicitly that wave field spatial distortions and associated shifts in frequency and spectral content are attended by transfers of energy with the inhomogeneous medium through which the waves propagate.
We ask whether a form of wave action is conserved by the hydrostatic wave equation (1.5), in which case the medium is a quasi-geostrophic flow that evolves slowly in time but varies rapidly in space. For example, when the quasi-geostrophic flow varies slowly in both time and space, wave action is conserved (Salmon Reference Salmon2016) and is used by Bühler & McIntyre (Reference Bühler and McIntyre2005) to demonstrate that wave capture transfers quasi-geostrophic energy to the ocean’s internal wave field. Also, the near-inertial equation derived by Young & Ben Jelloul (Reference Young and Ben Jelloul1997), which is similar to (1.5) above, conserves a form of wave action equal to the volume-integrated wave field kinetic energy divided by the local inertial frequency.
In this section we show that (1.5) does not conserve wave action. Instead, the version of wave action implied by equation (1.5), which is similar but not equivalent to wave energy divided by its near-constant frequency
 $\unicode[STIX]{x1D70E}$
, evolves as a direct consequence of wave field’s non-satisfaction of the linear equations and associated non-adherence to a linear dispersion relation. The inhomogeneity that forces wave action evolution originates from the term describing wave field advection by the non-uniform quasi-geostrophic flow.
An evolution equation for wave action in the hydrostatic wave equation emerges from the combination
 $$\begin{eqnarray}\frac{1}{\unicode[STIX]{x1D6FC}^{2}\unicode[STIX]{x1D70E}}\int A^{\ast }\times (1.5)+A\times (1.5)^{\ast }\,\text{d}V,\end{eqnarray}$$
assuming that exact derivatives over the domain
 $V$
integrate to zero. One useful identity that helps to simplify (5.1) writes the operator
 $\text{E}$
in terms of
 $\text{D}$
,
 $$\begin{eqnarray}\text{E}=2(1+\unicode[STIX]{x1D6FC})\unicode[STIX]{x0394}-\frac{4+3\unicode[STIX]{x1D6FC}}{2}\text{D},\end{eqnarray}$$
and a second forms an exact derivative from one of the horizontal refraction terms in (5.1),
 $$\begin{eqnarray}A^{\ast }\unicode[STIX]{x1D735}_{h}\boldsymbol{\cdot }(\text{D}\unicode[STIX]{x1D713}\unicode[STIX]{x1D735}_{h}A)-A\unicode[STIX]{x1D735}_{h}\boldsymbol{\cdot }(\text{D}\unicode[STIX]{x1D713}\unicode[STIX]{x1D735}_{h}A^{\ast })=\unicode[STIX]{x1D735}_{h}\boldsymbol{\cdot }[\text{D}\unicode[STIX]{x1D713}(A^{\ast }\unicode[STIX]{x1D735}_{h}A-A\unicode[STIX]{x1D735}_{h}A^{\ast })].\end{eqnarray}$$
A third identity that leads to a cancellation between two Jacobians and part of the advection term
 $\text{J}(\unicode[STIX]{x1D713},\text{E}A)$
is
 $$\begin{eqnarray}\displaystyle \int A^{\ast }\text{J}(\unicode[STIX]{x1D713},\unicode[STIX]{x0394}A)+A\text{J}(\unicode[STIX]{x1D713},\unicode[STIX]{x0394}A^{\ast })\,\text{d}V=-\int A^{\ast }[\text{J}(\unicode[STIX]{x1D713}_{x},A_{x})+\text{J}(\unicode[STIX]{x1D713}_{y},A_{y})]\,\text{d}V+\text{c.c.} & & \displaystyle\end{eqnarray}$$
Finally, we note that all the terms in (1.5) with
 $\text{i}$
as factor cancel each other during the integration in (5.1). For example, a few integrations by parts yields the identity
 $$\begin{eqnarray}\displaystyle \int A^{\ast }\text{J}(\unicode[STIX]{x1D713}_{x},A_{y})-A^{\ast }\text{J}(\unicode[STIX]{x1D713}_{y},A_{x})\,\text{d}V & = & \displaystyle \int A\unicode[STIX]{x2202}_{y}[\text{J}(\unicode[STIX]{x1D713}_{x},A^{\ast })]-A\unicode[STIX]{x2202}_{x}[\text{J}(\unicode[STIX]{x1D713}_{y},A^{\ast })]\,\text{d}V,\end{eqnarray}$$
 $$\begin{eqnarray}\displaystyle & = & \displaystyle \int A\text{J}(\unicode[STIX]{x1D713}_{x},A_{y}^{\ast })-A\text{J}(\unicode[STIX]{x1D713}_{y},A_{x}^{\ast })\,\text{d}V.\end{eqnarray}$$
Because (5.6) is the complex conjugate of the left-hand side of (5.5), both quantities are real and cancel during the simplification of (5.1).
Assembling these and additional identities and using many integrations by parts eventually produces an evolution equation for
 ${\mathcal{A}}$
, the wave action:
 $$\begin{eqnarray}\frac{\text{d}{\mathcal{A}}}{\text{d}t}=\frac{4+3\unicode[STIX]{x1D6FC}}{2\unicode[STIX]{x1D6FC}^{2}\unicode[STIX]{x1D70E}}\int \unicode[STIX]{x1D713}[\text{J}(A^{\ast },\text{D}A)+\text{J}(A,\text{D}A^{\ast })]\,\text{d}V,\end{eqnarray}$$
where
 $$\begin{eqnarray}{\mathcal{A}}\stackrel{\text{def}}{=}\frac{1}{2\unicode[STIX]{x1D6FC}\unicode[STIX]{x1D70E}}\int |\unicode[STIX]{x1D735}_{h}A|^{2}+(4+3\unicode[STIX]{x1D6FC})\frac{f^{2}}{N^{2}}|A_{z}|^{2}\,\text{d}V.\end{eqnarray}$$
The magnitude of the residual on the right-hand side of (5.7) depends explicitly on the fact that
 $\text{D}A\neq 0$
. The residual on the right-hand side of (5.7) is smaller than the individual contributions on the left-hand side of (5.7) by
 $O(\unicode[STIX]{x1D716})$
.
The wave action in (5.8) resembles, but is not equal to, Bretherton & Garrett’s definition of wave energy divided by intrinsic frequency. The wave energy, or the wave-associated part of horizontal kinetic plus potential energy contained in the leading-order solution (3.13) and (3.16), is defined in (B 10) and given by
 $$\begin{eqnarray}{\mathcal{E}}^{A}=\int \frac{\unicode[STIX]{x1D6FC}+2}{\unicode[STIX]{x1D6FC}^{2}}|\unicode[STIX]{x1D735}_{h}A|^{2}+\frac{f^{2}}{N^{2}}|A_{z}|^{2}\,\text{d}V.\end{eqnarray}$$
Subtracting
 $(\unicode[STIX]{x1D6FC}+4)(2\unicode[STIX]{x1D6FC}^{2}\unicode[STIX]{x1D70E})^{-1}\!\int \!A^{\ast }\text{D}A\,\text{d}V$
from (5.1) and using the identity
 $$\begin{eqnarray}\int A^{\ast }\text{D}A\,\text{d}V=\unicode[STIX]{x1D6FC}\int \frac{f^{2}}{N^{2}}|A_{z}|^{2}\,\text{d}V-\int |\unicode[STIX]{x1D735}_{h}A|^{2}\,\text{d}V\end{eqnarray}$$
reveals the relationship
 $$\begin{eqnarray}{\mathcal{A}}=\frac{{\mathcal{E}}^{A}}{\unicode[STIX]{x1D70E}}+\frac{\unicode[STIX]{x1D6FC}+4}{2\unicode[STIX]{x1D6FC}^{2}\unicode[STIX]{x1D70E}}\int A^{\ast }\text{D}A\,\text{d}V\end{eqnarray}$$
between wave action
 ${\mathcal{A}}$
and energy
 ${\mathcal{E}}^{A}$
. The difference between action in the hydrostatic wave equation and
 ${\mathcal{E}}^{A}/\unicode[STIX]{x1D70E}$
depends on the fact that
 $\text{D}A\neq 0$
. Substituting (5.11) into (5.7) yields an equation for the evolution of wave energy, which is not conserved in the hydrostatic wave equation (1.5).
Curiously, models that conserve wave action can be constructed with modifications to (3.24) that are similar to the modifications made in § 4. These action- and energy-conserving models lack either Galilean invariance or improved dispersion. In some exploratory simulations, a model without improved dispersion fared worse and had a more limited regime of validity than (1.5). Without Galilean invariance the model does not exactly describe Doppler shifting, though the consequences of such an inaccuracy have not been explored. In § 6.6 we show that both
 ${\mathcal{A}}$
and
 ${\mathcal{E}}^{A}$
are nearly but not exactly conserved when a plane, vertical mode-one wave is distorted by two-dimensional turbulence.
6 Validation
To build confidence in the validity of the hydrostatic wave equation (1.5), we compare solutions to the linearized, hydrostatic Boussinesq equations and hydrostatic wave equation for a suite of initial value problems. The initial value problems expose 20 vertical mode-one, horizontal plane waves with varying
 $\unicode[STIX]{x1D6FC}$
to three two-dimensional turbulent flows with varying
 $\unicode[STIX]{x1D716}$
. Though this parameter study neglects the effects of vertical shear and buoyancy refraction, it nevertheless defines a region in
 $\unicode[STIX]{x1D6FC},\unicode[STIX]{x1D716}$
space where the model is accurate and provides a glimpse of how the hydrostatic wave equation fails as
 $\unicode[STIX]{x1D716}$
increases or
 $\unicode[STIX]{x1D6FC}$
decreases.
6.1 The linearized hydrostatic Boussinesq equations and two-dimensional turbulence
We linearize the hydrostatic Boussinesq equations around a two-dimensional mean flow
 $$\begin{eqnarray}\boldsymbol{U}(x,y,t)=-\unicode[STIX]{x1D713}_{y}\hat{\boldsymbol{x}}+\unicode[STIX]{x1D713}_{x}\hat{\boldsymbol{y}}\end{eqnarray}$$
by substituting
 $\boldsymbol{u}\mapsto \boldsymbol{U}+\boldsymbol{u}$
in (2.1)–(2.5) and discarding terms quadratic in
 $\boldsymbol{u}$
and
 $b$
. These steps yield the set
 $$\begin{eqnarray}\displaystyle & u_{t}+\boldsymbol{U}\boldsymbol{\cdot }\unicode[STIX]{x1D735}u+\boldsymbol{u}\boldsymbol{\cdot }\unicode[STIX]{x1D735}U-fv+p_{x}=0, & \displaystyle\end{eqnarray}$$
 $$\begin{eqnarray}\displaystyle & v_{t}+\boldsymbol{U}\boldsymbol{\cdot }\unicode[STIX]{x1D735}v+\boldsymbol{u}\boldsymbol{\cdot }\unicode[STIX]{x1D735}V+fu+p_{y}=0, & \displaystyle\end{eqnarray}$$
 $$\begin{eqnarray}\displaystyle & p_{z}=b, & \displaystyle\end{eqnarray}$$
 $$\begin{eqnarray}\displaystyle & b_{t}+\boldsymbol{U}\boldsymbol{\cdot }\unicode[STIX]{x1D735}b+wN^{2}=0, & \displaystyle\end{eqnarray}$$
 $$\begin{eqnarray}\displaystyle & u_{x}+v_{y}+w_{z}=0. & \displaystyle\end{eqnarray}$$
Equations (6.2)–(6.6) describe the advection and refraction of waves by a two-dimensional flow with
 $\boldsymbol{U}_{\!z}=\unicode[STIX]{x1D713}_{z}=0$
and thus no buoyancy field. The linearization neglects the complications of nonlinear wave dynamics and permits a two-dimensionalization of (6.2)–(6.6) by projection onto vertical modes. Neither viscous dissipation in (6.2)–(6.4) nor diffusion in (6.5) is required to stabilize (6.2)–(6.6) for any of the solutions we report.
The streamfunction
 $\unicode[STIX]{x1D713}$
in (1.5) and (6.1) obeys the two-dimensional vorticity equation with fourth-order hyperviscous dissipation,
 $$\begin{eqnarray}\unicode[STIX]{x0394}\unicode[STIX]{x1D713}_{t}+\text{J}(\unicode[STIX]{x1D713},\unicode[STIX]{x0394}\unicode[STIX]{x1D713})=-\unicode[STIX]{x1D708}_{\unicode[STIX]{x1D713}}\unicode[STIX]{x0394}^{2}(\unicode[STIX]{x0394}\unicode[STIX]{x1D713}),\end{eqnarray}$$
where
 $\unicode[STIX]{x1D708}_{\unicode[STIX]{x1D713}}$
is the hyperviscosity applied to
 $\unicode[STIX]{x0394}\unicode[STIX]{x1D713}$
. The solutions to (6.7) we consider are relatively viscous and low resolution, but still exhibit characteristic features of geophysical and two-dimensional turbulence, such as persistent coherent vortices.
6.2 The vertical mode decomposition
We restrict attention to waves with simple vertical structure by projecting (1.5) and (6.2)–(6.6) onto the hydrostatic vertical modes
 $h_{n}(z)$
that solve the eigenproblem
 $$\begin{eqnarray}\frac{f^{2}}{N^{2}}h_{nzz}+\unicode[STIX]{x1D705}_{n}^{2}h_{n}=0,\quad \text{with}\;h_{n}=0\;\text{at}\;z=-H,0.\end{eqnarray}$$
Note that the derivative
 $h_{nz}$
satisfies
 $\text{L}~h_{nz}=-\unicode[STIX]{x1D705}_{n}^{2}h_{nz}$
. The modal amplitudes of the independent variables
 $A,\boldsymbol{u},b,p$
are defined by their weighted projection onto
 $h_{n}$
or its derivative
 $h_{nz}$
, with
 $$\begin{eqnarray}\unicode[STIX]{x1D6F7}_{n}\stackrel{\text{def}}{=}\int _{-H}^{0}\unicode[STIX]{x1D6F7}h_{nz}\,\text{d}z\quad \text{for}\;\unicode[STIX]{x1D6F7}=(A,u,v,p),\end{eqnarray}$$
and
 $$\begin{eqnarray}b_{n}\stackrel{\text{def}}{=}\int _{-H}^{0}b\,h_{n}\,\text{d}z\quad \text{and}\quad w_{n}\stackrel{\text{def}}{=}\int _{-H}^{0}\frac{N^{2}\unicode[STIX]{x1D705}_{n}^{2}}{f^{2}}wh_{n}\,\text{d}z.\end{eqnarray}$$
We assume
 $A,\boldsymbol{u},b$
and
 $p$
satisfy free-slip, rigid-lid homogeneous boundary conditions with
 $A_{z}=u_{z}=v_{z}=p_{z}=0$
and
 $w=b=0$
at
 $z=-H,0$
.
To project the hydrostatic wave equation (1.5) onto the modes
 $h_{nz}$
, we note that
 $\unicode[STIX]{x1D713}$
is two-dimensional and discard terms that depend on
 $\unicode[STIX]{x1D713}_{z}$
, multiply by
 $h_{nz}$
, integrate from
 $z=-H$
to
 $z=0$
and apply the definition of
 $A_{n}$
in (6.9). We add eighth-order hyperviscosity to the result for numerical stability to obtain
 $$\begin{eqnarray}\displaystyle & & \displaystyle \text{E}_{n}A_{nt}+\text{i}\unicode[STIX]{x1D6FC}\unicode[STIX]{x1D70E}\text{D}_{n}A_{n}+\text{J}(\unicode[STIX]{x1D713},\text{E}_{n}A_{n})+\text{J}(A_{n},\unicode[STIX]{x0394}\unicode[STIX]{x1D713})+\frac{\text{i}\unicode[STIX]{x1D70E}}{f}\unicode[STIX]{x1D735}_{h}\boldsymbol{\cdot }(\unicode[STIX]{x0394}\unicode[STIX]{x1D713}\unicode[STIX]{x1D735}_{h}A_{n})\nonumber\\ \displaystyle & & \displaystyle \quad -\,\frac{2\text{i}\unicode[STIX]{x1D70E}}{f^{2}}[\text{J}(\unicode[STIX]{x1D713}_{x},\text{i}\unicode[STIX]{x1D70E}A_{nx}-fA_{ny})+\text{J}(\unicode[STIX]{x1D713}_{y},\text{i}\unicode[STIX]{x1D70E}A_{ny}+fA_{nx})]=-\unicode[STIX]{x1D708}_{A}\unicode[STIX]{x0394}^{4}(\unicode[STIX]{x0394}A_{n}),\end{eqnarray}$$
where
 $\unicode[STIX]{x1D708}_{A}$
is the hyperviscosity applied to
 $A_{n}$
, and the mode-wise operators
 $\text{E}_{n}$
and
 $\text{D}_{n}$
are
 $$\begin{eqnarray}\text{E}_{n}=\frac{\unicode[STIX]{x1D6FC}}{2}[\unicode[STIX]{x0394}-\unicode[STIX]{x1D705}_{n}^{2}(4+3\unicode[STIX]{x1D6FC})]\quad \text{and}\quad \text{D}_{n}=\unicode[STIX]{x0394}+\unicode[STIX]{x1D6FC}\unicode[STIX]{x1D705}_{n}^{2}.\end{eqnarray}$$
Equation (6.11) describes the horizontal propagation of a mode-
 $n$
wave field with amplitude
 $A_{n}(x,y,t)$
through two-dimensional turbulence with streamfunction
 $\unicode[STIX]{x1D713}$
. The arbitrary stratification profile
 $N(z)$
enters (6.11) via the eigenvalue
 $\unicode[STIX]{x1D705}_{n}^{2}$
determined by (6.8).
The linearized Boussinesq equations (6.2)–(6.6) are processed in similar fashion. We project (6.2) and (6.3) onto
 $h_{nz}$
, which yields
 $$\begin{eqnarray}\displaystyle & u_{nt}-fv_{n}+p_{nx} & \displaystyle =-\boldsymbol{U}\boldsymbol{\cdot }\unicode[STIX]{x1D735}u_{n}-\boldsymbol{u}_{n}\boldsymbol{\cdot }\unicode[STIX]{x1D735}U,\end{eqnarray}$$
 $$\begin{eqnarray}\displaystyle & v_{nt}+fu_{n}+p_{ny} & \displaystyle =-\boldsymbol{U}\boldsymbol{\cdot }\unicode[STIX]{x1D735}v_{n}-\boldsymbol{u}_{n}\boldsymbol{\cdot }\unicode[STIX]{x1D735}V.\end{eqnarray}$$
We next combine (6.4)–(6.6) by projecting (6.6) onto
 $h_{nz}$
, integrating by parts once and using (6.8) to yield
 $w_{n}=-u_{nx}-v_{ny}$
. Then, using
 $p_{z}=b$
to combine (6.4) and (6.5), projecting the result onto
 $h_{n}$
, integrating by parts and substituting
 $w_{n}=-u_{nx}-v_{ny}$
leads to
 $$\begin{eqnarray}p_{nt}+\left(\frac{f}{\unicode[STIX]{x1D705}_{n}}\right)^{2}(u_{nx}+v_{ny})=-\boldsymbol{U}\boldsymbol{\cdot }\unicode[STIX]{x1D735}p_{n}.\end{eqnarray}$$
The three equations (6.13)–(6.15) describe the evolution of hydrostatic, vertical mode-
 $n$
waves in a two-dimensional flow
 $\boldsymbol{U}=U\hat{\boldsymbol{x}}+V\hat{\boldsymbol{y}}$
with
 $\boldsymbol{U}_{\!z}=0$
. The parameter
 $f/\unicode[STIX]{x1D705}_{n}$
is the phase speed of a linear wave with mode-
 $n$
vertical structure.
6.3 Initial value problems and numerical methods
We solve (6.7) simultaneously with (6.11) and (6.13)–(6.15) for a series of initial value problems that place a horizontal plane wave with the vertical structure of a single vertical mode into mature two-dimensional turbulence in a doubly periodic domain. The periodic physical domain is square with dimension
 $L=1600~\text{km}$
, which fits 16 wavelengths of a plane wave with dimensional wavenumber
 $k_{0}=\unicode[STIX]{x03C0}/50~\text{km}^{-1}$
. In varying
 $\unicode[STIX]{x1D6FC}$
from 0.1 to 2, we fix the domain size
 $L$
, wavenumber
 $k_{0}$
, initial turbulent field
 $\unicode[STIX]{x1D713}$
and inertial frequency
 $f=10^{-4}~\text{s}^{-1}$
while co-varying
 $\unicode[STIX]{x1D705}_{n}=k_{0}/\sqrt{\unicode[STIX]{x1D6FC}}$
and
 $\unicode[STIX]{x1D70E}=f\sqrt{1+\unicode[STIX]{x1D6FC}}$
with
 $\unicode[STIX]{x1D6FC}$
.
The initial condition for
 $A_{n}$
,
 $$\begin{eqnarray}A_{n}(t=0)=\text{e}^{\text{i}k_{0}x}a,\end{eqnarray}$$
excites a rightward propagating horizontal plane wave. In (6.16)
 $a$
is the constant initial magnitude of
 $A_{n}$
and
 $k_{0}=\unicode[STIX]{x03C0}/50~\text{km}^{-1}$
is the wave field’s initial wavenumber. The linearized nature of both (6.11) and (6.13)–(6.15) means the initial magnitude of the wave field is arbitrary; we choose
 $a=\unicode[STIX]{x1D6FC}f/2k_{0}\sqrt{\unicode[STIX]{x1D6FC}+2}$
to produce an initial maximum speed
 $\max (\sqrt{u_{n}^{2}+v_{n}^{2}})=1~\text{m}~\text{s}^{-1}$
.
The initial conditions for
 $p_{n}$
,
 $u_{n}$
and
 $v_{n}$
in (6.13)–(6.15) are
 $$\begin{eqnarray}[p_{n},u_{n},v_{n}]_{t=0}=\frac{2a}{\unicode[STIX]{x1D6FC}f^{2}}[\unicode[STIX]{x1D6FC}f^{3}\cos (k_{0}x),k_{0}\unicode[STIX]{x1D70E}\cos (k_{0}x),k_{0}f\sin (k_{0}x)]\end{eqnarray}$$
corresponding to the same progressive plane wave in (6.16) with the mode-
 $n$
pressure field
 $p_{n}=2af\cos \big(k_{0}x-\unicode[STIX]{x1D70E}t\big)$
at
 $t=0$
.
We generate three turbulent initial conditions for
 $\unicode[STIX]{x1D713}$
by integrating (6.7) from the random state
 $$\begin{eqnarray}\hat{\unicode[STIX]{x1D713}}(t=-T)=\frac{\unicode[STIX]{x1D6F9}\text{e}^{\text{i}\unicode[STIX]{x1D703}}\sqrt{k^{2}+\ell ^{2}}}{\left(1+k_{c}^{-1}\sqrt{k^{2}+\ell ^{2}}\right)^{8}},\end{eqnarray}$$
for a preliminary interval of length
 $T$
up to
 $t=0$
. In (6.18)
 $\hat{\unicode[STIX]{x1D713}}(k,\ell ,t)$
is the two-dimensional Fourier transform of
 $\unicode[STIX]{x1D713}(x,y,t)$
and
 $\unicode[STIX]{x1D703}(k,\ell )$
is the random initial phase of wavenumber
 $k,\ell$
. We choose the dimensional value
 $k_{c}=64\times 2\unicode[STIX]{x03C0}/L$
in (6.18) so that the energy spectra
 $(k^{2}+\ell ^{2})|\hat{\unicode[STIX]{x1D713}}|^{2}$
is initially concentrated around non-dimensional wavenumber 64. Three magnitudes
 $\unicode[STIX]{x1D6F9}$
in (6.18) are chosen so the random state in (6.18) has the root-mean-square (r.m.s.) Rossby numbers
 $\text{r.m.s.}\,(\unicode[STIX]{x0394}\unicode[STIX]{x1D713}/f)=(0.07,0.1,0.2)$
. The resulting random states are then integrated for the preliminary intervals
 $T=(600,400,200)\times 2\unicode[STIX]{x03C0}/f~\text{s}$
, respectively, to produce turbulent initial conditions
 $\unicode[STIX]{x1D713}(t=0)$
with the properties
 $\text{max}(\unicode[STIX]{x0394}\unicode[STIX]{x1D713}/f)\approx (0.033,0.064,0.14)$
and
 $\text{max}(|\unicode[STIX]{x1D735}\unicode[STIX]{x1D713}|k_{0}/f)\approx (0.039,0.060,0.12)$
. The parameters and intervals used for the preliminary integrations are tuned so that
 $\max (\unicode[STIX]{x0394}\unicode[STIX]{x1D713}/f)$
and
 $\max (|\unicode[STIX]{x1D735}\unicode[STIX]{x1D713}|k_{0}/f)$
are similar for each of the initial turbulent states, which implies that all terms in (6.11) are of comparable importance. Hereafter we use
 $\max (\unicode[STIX]{x0394}\unicode[STIX]{x1D713}/f)\approx (0.033,0.064,0.14)$
as reference values for
 $\unicode[STIX]{x1D716}$
.
Equations (6.7), (6.11) and (6.13)–(6.15) are solved on a square doubly periodic domain using a dealiased pseudospectral method with
 $256^{2}$
Fourier modes in
 $x$
and
 $y$
. The ETDRK4 scheme described by Cox & Matthews (Reference Cox and Matthews2002), Kassam & Trefethen (Reference Kassam and Trefethen2005) and Grooms & Julien (Reference Grooms and Julien2011) is used to integrate (6.7) and (6.11) in time, while a fourth-order Runge–Kutta scheme is used to integrate the modal hydrostatic Boussinesq equations (6.13)–(6.15). We use the hyperviscosities
 $\unicode[STIX]{x1D708}_{\unicode[STIX]{x1D713}}=3\times 10^{8}~\text{m}^{4}~\text{s}^{-1}$
in (6.7) and
 $\unicode[STIX]{x1D708}_{A}=10^{24}~\text{m}^{8}~\text{s}^{-1}$
in (6.11). Due to hyperdissipation the three turbulent fields lose 1 %–3 % of their energy at
 $t=0$
over the few hundred wave periods that we consider.
Scattering of a plane wave with frequency
 $\unicode[STIX]{x1D70E}=f\sqrt{2}$
and thus
 $\unicode[STIX]{x1D6FC}=1$
by two-dimensional turbulence with maximum vorticity
 $\text{max}(\unicode[STIX]{x0394}\unicode[STIX]{x1D713}/f)\approx 0.14$
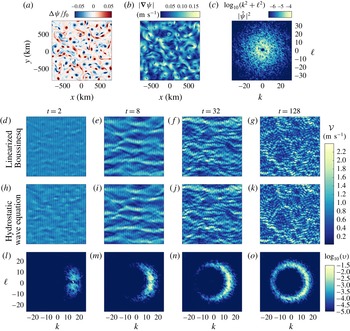
in the linearized Boussinesq equations and the hydrostatic wave equation. Parameters and initial conditions are given in § 6.3. (a–c) Show the initial turbulent vorticity, speed and energy spectra. (d–o) Show wave field evolution in four snapshots: (d–g) shows speed
 ${\mathcal{V}}_{B}$
in the linearized hydrostatic Boussinesq system (6.13)–(6.15); (h–k) shows speed
 ${\mathcal{V}}_{A}$
in the hydrostatic wave equation (6.11); and (l–o) shows the logarithm of the spectral measure
 $\unicode[STIX]{x1D710}_{A}$
from the hydrostatic wave equation.
 ${\mathcal{V}}$
and
 $\unicode[STIX]{x1D710}$
are defined in (6.19) and (6.20).

6.4 Wave field evolution with
 $\unicode[STIX]{x1D6FC}=1$
and
$\unicode[STIX]{x1D716}\approx 0.14$


The initial turbulent field and the evolution of
 $A_{n}$
in the hydrostatic wave equation and
 $u_{n},v_{n}$
and
 $p_{n}$
in the linearized Boussinesq equations are shown in figure 2 for a case with wave Burger number
 $\unicode[STIX]{x1D6FC}=1$
and Rossby number
 $\unicode[STIX]{x1D716}\approx \max (\unicode[STIX]{x0394}\unicode[STIX]{x1D713}/f)\approx 0.14$
. Figure 2(a–c) shows the initial normalized turbulent vorticity
 $\unicode[STIX]{x0394}\unicode[STIX]{x1D713}/f$
, speed
 $|\unicode[STIX]{x1D735}\unicode[STIX]{x1D713}|$
, and energy spectra
 $(k^{2}+\ell ^{2})|\hat{\unicode[STIX]{x1D713}}|^{2}$
from left to right. Turbulent vorticity is concentrated in coherent vortices and turbulent energy in non-dimensional wavenumbers less than
 $\sqrt{k^{2}+\ell ^{2}}\approx 8$
. As a result, wave field spectral components experience a gradual diffusion to nearby wavenumbers rather than the sharper reflection that a smaller-scale turbulent field would incur. Hereafter in figures and text the wavenumbers
 $k$
and
 $\ell$
denote non-dimensional Fourier wavenumbers normalized by
 $2\unicode[STIX]{x03C0}/L$
.
Figure 2(d–o) portrays the turbulent scattering of the initially planar wave field in four snapshots at
 $t=2$
, 8, 32 and 128 wave periods. Figure 2(d–k) shows snapshots of mode-wise wave speed,
 $$\begin{eqnarray}{\mathcal{V}}(x,y,t)\stackrel{\text{def}}{=}\sqrt{u_{n}^{2}+v_{n}^{2}},\end{eqnarray}$$
which is diagnosed from the hydrostatic wave equation solution using the leading-order relations in (3.16). We use subscripts to differentiate between models, so that
 ${\mathcal{V}}_{B}$
is diagnosed from the linearized hydrostatic Boussinesq system (6.13)–(6.15), and
 ${\mathcal{V}}_{A}$
from the hydrostatic wave equation (6.11). Figure 2(l–o) shows snapshots of the normalized wave potential energy spectra
 $$\begin{eqnarray}\unicode[STIX]{x1D710}(k,\ell ,t)\stackrel{\text{def}}{=}\frac{|\hat{A}_{n}|^{2}}{\displaystyle \int |\hat{A}_{n}|^{2}\,\text{d}k\,\text{d}\ell }\end{eqnarray}$$
from the hydrostatic wave equation (6.11).
The snapshots of speed
 ${\mathcal{V}}$
and spectra
 $\unicode[STIX]{x1D710}$
reveal how wave scattering by turbulence both smears wave energy to wavenumber magnitudes higher and lower than
 $k_{0}$
and leads eventually to an isotropization of wave energy around the circle
 $k^{2}+\ell ^{2}=k_{0}^{2}$
. The smearing of energy around
 $k_{0}$
indicates the importance of near-resonant interactions between waves and turbulence. At
 $t=2$
most of the energy is concentrated at
 $k=k_{0}$
. By
 $t=8$
the initial stages of isotropization are underway, attended by a focusing and concentration of wave energy in strips parallel to the original direction of wave propagation. Focusing is generic in the scattering of parallel incident waves, especially in the geometrics optics limit (White & Fornberg Reference White and Fornberg1998; Nye Reference Nye1999). As the isotropization proceeds, random focusing gives way to almost isotropic disorder by
 $t=128$
.
The agreement between the two models is impressive: excellent correspondence both in the spatial structure and quantitative amplitude of wave field energy persists to
 $t=128$
wave periods. Interestingly, the most obvious differences in wave speed are at the earliest time
 $t=2$
wave periods. The pointwise comparison of wave speed over hundreds of wave periods is a severe test of the asymptotic model, and correspondences between wave field spectra and statistics diagnosed from the two models for the same parameters are closer still. We find that for the parameters explored here, such good agreement holds approximately when
 $\unicode[STIX]{x1D716}/\unicode[STIX]{x1D6FC}<0.2$
. For larger values of
 $\unicode[STIX]{x1D716}/\unicode[STIX]{x1D6FC}$
nonlinear advection and refraction overcome the effects of dispersion, which consequently leads to non-small
 $\text{D}A$
, disrupts the assumed ordering of terms in the wave operator equation (2.8), and invalidates the assumptions used to derive (1.5).
6.5 Physical space and statistical comparisons across
$\unicode[STIX]{x1D6FC},\unicode[STIX]{x1D716}$
parameter space

We next explore the
 $\unicode[STIX]{x1D6FC},\unicode[STIX]{x1D716}$
parameter space with 60 simulations of both the hydrostatic wave equation (6.11) and linearized Boussinesq system (6.13)–(6.15). The 60 cases correspond to 20 equispaced values of
 $\unicode[STIX]{x1D6FC}$
between
 $\unicode[STIX]{x1D6FC}=0.1$
and
 $\unicode[STIX]{x1D6FC}=2$
for each of the 3 turbulent vorticity fields with
 $\unicode[STIX]{x1D716}\approx 0.033$
, 0.064 and 0.14. We compare physical fields and spectra of the two models before using a bulk measure of physical space error in solutions to the hydrostatic wave equation to compare the results in aggregate.
A qualitative physical space comparison between snapshots of wave speed from the linearized Boussinesq equations and the hydrostatic wave equation for four initial value problems with wave Burger numbers
 $\unicode[STIX]{x1D6FC}=0.2$
, 0.4, 0.8 and 1.6. The snapshots are taken at
 $t=10\unicode[STIX]{x1D6FC}$
wave periods. The initial value problems expose an initially planar wave field to a two-dimensional turbulent flow with
 $\unicode[STIX]{x1D716}\approx \max (\unicode[STIX]{x0394}\unicode[STIX]{x1D713}/f)\approx 0.064$
and are described in § 6.3. (a–d), (e–h) Show wave speed
 ${\mathcal{V}}_{B}$
from the linearized Boussinesq system and
 ${\mathcal{V}}_{A}$
from the hydrostatic wave equation, respectively, and (i–l) shows the absolute error
 $|{\mathcal{V}}_{B}-{\mathcal{V}}_{A}|$
.

Figure 3 compares snapshots of wave speed
 ${\mathcal{V}}$
from four linearized Boussinesq and hydrostatic wave equation solutions with
 $\unicode[STIX]{x1D6FC}=0.2$
, 0.4, 0.8 and 0.16 and
 $\unicode[STIX]{x1D716}\approx 0.064$
at
 $t=10\unicode[STIX]{x1D6FC}$
wave periods. Figure 3(a–d) shows wave speed
 ${\mathcal{V}}_{B}$
defined in (6.19) from the linearized Boussinesq equations, (e–h) shows
 ${\mathcal{V}}_{A}$
from the hydrostatic wave equation and (i–l) shows the absolute error
 $|{\mathcal{V}}_{B}-{\mathcal{V}}_{A}|$
between the two. The results show clearly that for fixed
 $\unicode[STIX]{x1D716}$
the error decreases when
 $\unicode[STIX]{x1D6FC}$
increases; when
 $\unicode[STIX]{x1D6FC}=1.6$
and
 $\unicode[STIX]{x1D716}\approx 0.064$
the pointwise error in wave speed after
 $t=160$
wave periods is almost everywhere less than 10 % of its initial value. Despite the relatively large errors when
 $\unicode[STIX]{x1D6FC}=0.2$
, the spatial structure of
 ${\mathcal{V}}$
is broadly similar between both models.
The pointwise comparison of wave speed
 ${\mathcal{V}}$
is a strict test of model accuracy. We move toward less stringent statistical comparisons with figure 4, which replicates the form of figure 3 for snapshots of the normalized spectral amplitudes
 $\unicode[STIX]{x1D710}$
defined in (6.20) in terms of
 $\hat{A}_{n}$
. To estimate
 $A_{n}$
from the linearized Boussinesq solution, we observe that the definition of
 $A$
in terms of
 $p$
in (3.11) implies that
 $$\begin{eqnarray}p_{nt}=-\text{i}\unicode[STIX]{x1D70E}(\text{e}^{-\text{i}\unicode[STIX]{x1D70E}t}A_{n}-\text{e}^{\text{i}\unicode[STIX]{x1D70E}t}A_{n}^{\ast })+\text{e}^{-\text{i}\unicode[STIX]{x1D70E}t}A_{nt}+\text{e}^{\text{i}\unicode[STIX]{x1D70E}t}A_{nt}^{\ast }.\end{eqnarray}$$
Due to the slow variation of
 $A_{n}$
, which implies that
 $A_{nt}/\unicode[STIX]{x1D70E}A_{n}\sim \unicode[STIX]{x1D716}\ll 1$
, the parenthetical terms in (6.21) are both
 $O(\unicode[STIX]{x1D716}^{-1})$
larger than the two rightmost terms. This implies the approximate formula for
 $A_{n}$
 $$\begin{eqnarray}A_{n}\approx \frac{\text{e}^{\text{i}\unicode[STIX]{x1D70E}t}}{2f}(p_{n}+\text{i}\unicode[STIX]{x1D70E}^{-1}p_{nt}),\end{eqnarray}$$
in terms of the linearized Boussinesq variables
 $p_{n}$
and
 $p_{nt}$
. The Fourier transform of (6.22) provides an estimate of
 $\hat{A}_{n}$
from
 $\hat{p}_{n}$
.
Comparison of normalized potential energy spectral amplitudes
 $\unicode[STIX]{x1D710}$
defined in (6.20) for the same simulations considered in figure 3. (a–d) Shows
 $\unicode[STIX]{x1D710}_{B}$
from the linearized Boussinesq equations, (e–h) shows
 $\unicode[STIX]{x1D710}_{A}$
from the hydrostatic wave equation and (i–l) shows the absolute difference
 $|\unicode[STIX]{x1D710}_{B}-\unicode[STIX]{x1D710}_{A}|$
, all scaled logarithmically.

Figures 4(a–d) and 4(e–h) show
 $\unicode[STIX]{x1D710}_{B}$
from the linearized Boussinesq system and
 $\unicode[STIX]{x1D710}_{A}$
hydrostatic wave equation, scaled logarithmically. The spectral amplitudes
 $\unicode[STIX]{x1D710}$
for each model are remarkably similar. Figure 4(i–l) shows the absolute difference
 $|\unicode[STIX]{x1D710}_{B}-\unicode[STIX]{x1D710}_{A}|$
between figures 4(a–d) and 4(e–h). Spectral errors are small and decrease with increasing
 $\unicode[STIX]{x1D6FC}$
for fixed
 $\unicode[STIX]{x1D716}$
.
We next isolate specific modes of model failure by moving from the non-dimensional Cartesian spectral coordinates
 $k,\ell$
into the polar spectral coordinates
 $\unicode[STIX]{x1D718},\unicode[STIX]{x1D703}$
defined so that
 $k=\unicode[STIX]{x1D718}\cos \unicode[STIX]{x1D703}$
and
 $\ell =\unicode[STIX]{x1D718}\sin \unicode[STIX]{x1D703}$
. We define the spectral integral measure
 $\unicode[STIX]{x1D6F6}$
as
 $$\begin{eqnarray}\unicode[STIX]{x1D6F6}(\unicode[STIX]{x1D718},t)\stackrel{\text{def}}{=}\int _{0}^{2\unicode[STIX]{x03C0}}|\hat{A}_{n}|^{2}\unicode[STIX]{x1D718}\,\text{d}\unicode[STIX]{x1D703}.\end{eqnarray}$$
 $\unicode[STIX]{x1D6F6}$
is similar to the one-dimensional energy spectra common to the analysis of turbulence and the integral
 $\int \unicode[STIX]{x1D6F6}\,\text{d}\unicode[STIX]{x1D718}$
is proportional to total wave field potential energy.
 $\unicode[STIX]{x1D6F6}$
reveals the radial distribution of
 $|\hat{A}_{n}|^{2}$
and thus measures the spatial scales in
 $\hat{A}_{n}$
regardless of the direction of propagation of the mode
 $k,\ell$
. To calculate
 $\unicode[STIX]{x1D6F6}$
numerically we interpolate
 $\hat{A}_{n}$
known at discrete
 $k,\ell$
values onto a
 $1024\times 256$
grid in
 $\unicode[STIX]{x1D718},\unicode[STIX]{x1D703}$
and integrate
 $|\hat{A}_{n}|^{2}$
over
 $\unicode[STIX]{x1D703}$
.
Figure 5 shows snapshots of
 $\unicode[STIX]{x1D6F6}$
at
 $t\approx 13\unicode[STIX]{x1D6FC}/\unicode[STIX]{x1D716}$
wave periods for six cases with varying
 $\unicode[STIX]{x1D6FC}$
and
 $\unicode[STIX]{x1D716}$
: in (a)
 $\unicode[STIX]{x1D716}\approx 0.064$
is held constant and
 $\unicode[STIX]{x1D6FC}$
is varied, while in (b)
 $\unicode[STIX]{x1D6FC}=0.2$
is held constant and
 $\unicode[STIX]{x1D716}$
is varied. In (a,b)
 $\unicode[STIX]{x1D6F6}$
is normalized by
 $\int \unicode[STIX]{x1D6F6}\,\text{d}\unicode[STIX]{x1D718}$
from the linearized Boussinesq solution. Figures 5(c) and 5(d) compare snapshots of
 ${\mathcal{V}}_{B}$
and
 ${\mathcal{V}}_{A}$
for the case
 $\unicode[STIX]{x1D716}=0.064$
and
 $\unicode[STIX]{x1D6FC}=0.1$
. The
 $\unicode[STIX]{x1D6F6}$
comparisons reveal aspects both of wave–flow interaction and the errors that develop in the hydrostatic wave equation for small
 $\unicode[STIX]{x1D6FC}/\unicode[STIX]{x1D716}$
: first, because exactly ‘resonant’ wave–flow interactions only redistribute energy among wave modes with
 $\unicode[STIX]{x1D718}=16$
, the width of
 $\unicode[STIX]{x1D6F6}$
associated with energy at off-dispersion wavenumbers around
 $\unicode[STIX]{x1D718}=16$
is due explicitly to near-resonant dynamics. Second, all curves are asymmetric about the central wavenumber
 $\unicode[STIX]{x1D718}=16$
, showing that these near-resonant interactions preferentially shift energy to higher wavenumbers. Third, the most severe errors in
 $\unicode[STIX]{x1D6F6}$
in the hydrostatic wave equation are associated with an over-prediction of wave energy at very high wavenumbers. The worst case comparison in figure 5(c,d) shows how these errors manifest as regions of spuriously intense small-scale wave activity.
Comparison of the polar-integrated spectral measure
 $\unicode[STIX]{x1D6F6}(\unicode[STIX]{x1D718})$
defined in (6.23) in the linearized Boussinesq equations (solid lines) and hydrostatic wave equation (dashed lines), both normalized by
 $\int \unicode[STIX]{x1D6F6}\,\text{d}\unicode[STIX]{x1D718}$
from the linear Boussinesq result. (a) Compares four solutions with
 $\unicode[STIX]{x1D716}\approx 0.064$
with varying
 $\unicode[STIX]{x1D6FC}$
while (b) compares three solutions with
 $\unicode[STIX]{x1D6FC}=0.2$
and varying
 $\unicode[STIX]{x1D716}$
. A dotted line indicates the wave field’s initial wavenumber
 $\unicode[STIX]{x1D718}=16$
. (c,d) Show wave speed
 ${\mathcal{V}}$
from the two models for the case
 $\unicode[STIX]{x1D716}=0.064$
and
 $\unicode[STIX]{x1D6FC}=0.1$
to illustrate the spuriously intense small-scale features that develop in the hydrostatic wave equation solution when
 $\unicode[STIX]{x1D6FC}/\unicode[STIX]{x1D716}$
is small. All snapshots are taken at
 $t\approx 13\unicode[STIX]{x1D6FC}/\unicode[STIX]{x1D716}$
wave periods.

Integrated and maximum pointwise error in 60 solutions to the hydrostatic wave equation corresponding to three values of
 $\unicode[STIX]{x1D716}\approx \max (\unicode[STIX]{x0394}\unicode[STIX]{x1D713}/f)$
and 20 values of
 $\unicode[STIX]{x1D6FC}$
. For every solution the error is computed at
 $t\approx 6.5\unicode[STIX]{x1D6FC}/\unicode[STIX]{x1D716}$
wave periods. The integrated error is defined in (6.24) and maximum error is the maximum pointwise error in speed defined in (6.25).

We finally aggregate all solutions by introducing two bulk metrics: the ‘integrated error’ and ‘maximum error’. Integrated error measures the total sum of errors in snapshots of wave speed and is defined by
 $$\begin{eqnarray}\text{integrated error}\stackrel{\text{def}}{=}\frac{\displaystyle \int |{\mathcal{V}}_{B}-{\mathcal{V}}_{A}|\,\text{d}x\,\text{d}y}{\displaystyle \int {\mathcal{V}}_{B}\,\text{d}x\,\text{d}y}.\end{eqnarray}$$
The maximum error defined by
 $$\begin{eqnarray}\text{maximum error}\stackrel{\text{def}}{=}\frac{\max |{\mathcal{V}}_{B}-{\mathcal{V}}_{A}|}{\max ({\mathcal{V}}_{B})}\end{eqnarray}$$
isolates the worst case relative errors in wave speed at particular locations and times. Figure 6 shows snapshots of integrated error and maximum error for all 60 initial value problems as a function of
 $\unicode[STIX]{x1D6FC}$
. The snapshots are taken at the approximate time
 $t\approx 6.5\unicode[STIX]{x1D6FC}/\unicode[STIX]{x1D716}$
wave periods. All errors decrease both as
 $\unicode[STIX]{x1D716}$
decreases and as
 $\unicode[STIX]{x1D6FC}$
increases. The maximum error in the physical space solution is less than 10 % when
 $\unicode[STIX]{x1D716}\leqslant 0.064$
and
 $\unicode[STIX]{x1D6FC}\geqslant 0.8$
, but is never less than
 $10\,\%$
when
 $\unicode[STIX]{x1D716}\approx 0.14$
for the range of
 $\unicode[STIX]{x1D6FC}$
and time snapshots considered. Maximum errors increases sharply for small
 $\unicode[STIX]{x1D6FC}$
and are more than 50 % when
 $\unicode[STIX]{x1D6FC}\leqslant 0.2$
for all
 $\unicode[STIX]{x1D716}$
.
6.6 The evolution of wave energy and action
We turn at last to the transfer of energy between waves and turbulence. We use the evolution of wave action
 ${\mathcal{A}}$
defined in (5.8) to diagnose energy transfers in the hydrostatic wave equation. The mode-wise version of
 ${\mathcal{A}}$
is
 $$\begin{eqnarray}{\mathcal{A}}_{n}=\frac{1}{2\unicode[STIX]{x1D6FC}\unicode[STIX]{x1D70E}}\int |\unicode[STIX]{x1D735}_{h}A_{n}|^{2}+(4+3\unicode[STIX]{x1D6FC})\unicode[STIX]{x1D705}_{n}^{2}|A_{n}|^{2}\,\text{d}x\,\text{d}y.\end{eqnarray}$$
An equation for the evolution of wave energy density in the linearized Boussinesq equations follows from the combination
 $u_{n}(6.13)+v_{n}(6.14)+(\unicode[STIX]{x1D705}_{n}/f)^{2}p_{n}(6.15)$
, which produces
 $$\begin{eqnarray}e_{nt}^{B}+\unicode[STIX]{x1D735}\boldsymbol{\cdot }(\boldsymbol{u}_{n}p_{n}+\boldsymbol{U}e_{n}^{B})=-u_{n}\boldsymbol{u}_{n}\boldsymbol{\cdot }\unicode[STIX]{x1D735}U-v_{n}\boldsymbol{u}_{n}\boldsymbol{\cdot }\unicode[STIX]{x1D735}V,\end{eqnarray}$$
where wave energy density is defined
 $$\begin{eqnarray}e_{n}^{B}\stackrel{\text{def}}{=}\frac{1}{2}u_{n}^{2}+\frac{1}{2}v_{n}^{2}+\frac{\unicode[STIX]{x1D705}_{n}^{2}}{2f^{2}}p_{n}^{2}.\end{eqnarray}$$
The superscript ‘
 $B$
’ stands for ‘Boussinesq’. The total mode-wise wave energy
 ${\mathcal{E}}_{n}^{B}\stackrel{\text{def}}{=}\int e_{n}^{B}\,\text{d}V$
, which is not conserved in (6.13)–(6.15) due to the non-zero right-hand side of (6.27), is therefore
 $$\begin{eqnarray}{\mathcal{E}}_{n}^{B}=\frac{1}{2}\int u_{n}^{2}+v_{n}^{2}+\frac{\unicode[STIX]{x1D705}_{n}^{2}}{f^{2}}p_{n}^{2}\,\text{d}x\,\text{d}y.\end{eqnarray}$$
We compare the evolution of
 $\unicode[STIX]{x1D70E}{\mathcal{A}}_{n}$
and
 ${\mathcal{E}}_{n}^{B}$
, which are initially equal for the initial conditions in (6.16)–(6.17) because
 $\text{D}_{n}A_{n}|_{t=0}=0$
. The product
 $\unicode[STIX]{x1D70E}{\mathcal{A}}_{n}$
and wave energy in the hydrostatic wave equation are closely related by the identity in (5.11).
Comparison of
 $\unicode[STIX]{x1D70E}{\mathcal{A}}_{n}$
(dashed lines) and
 ${\mathcal{E}}_{n}^{B}$
(solid lines), both normalized by the initial wave energy
 ${\mathcal{E}}_{n}^{B}(t=0)$
. (a) Shows three cases with
 $\unicode[STIX]{x1D6FC}=0.4$
, 0.8 and 1.6 with
 $\unicode[STIX]{x1D716}\approx 0.064$
and (b) shows three cases with the same
 $\unicode[STIX]{x1D6FC}$
and
 $\unicode[STIX]{x1D716}\approx 0.14$
. Both
 ${\mathcal{A}}$
and
 ${\mathcal{E}}^{B}$
are conserved to within a few per cent in all cases except
 $\unicode[STIX]{x1D6FC}=0.4$
and
 $\unicode[STIX]{x1D716}\approx 0.14$
. Note that the panels have different
 $y$
-axes.

Our comparison is summarized in figure 7, which shows the evolution of
 $\unicode[STIX]{x1D70E}{\mathcal{A}}_{n}$
and
 ${\mathcal{E}}_{n}^{B}$
both normalized by total initial wave energy
 ${\mathcal{E}}_{n}^{B}(t=0)$
for three values of
 $\unicode[STIX]{x1D6FC}=0.4$
, 0.8, 1.6. Figure 7(a) corresponds to the case
 $\unicode[STIX]{x1D716}\approx 0.064$
and (b) to
 $\unicode[STIX]{x1D716}\approx 0.14$
. Even in the most nonlinear case with
 $\unicode[STIX]{x1D716}\approx 0.14$
the energy of the linearized Boussinesq solution remains within 1 % of its initial value: in other words, there is almost no transfer of energy between waves and flow in these non-near-inertial cases. The comparison shows also that the mode-wise wave action
 ${\mathcal{A}}_{n}$
is nearly conserved when
 $\unicode[STIX]{x1D716}/\unicode[STIX]{x1D6FC}$
is small. The
 ${\sim}10\,\%$
change in
 $A_{n}$
at
 $\unicode[STIX]{x1D716}\approx 0.14$
and
 $\unicode[STIX]{x1D6FC}=0.4$
betrays the strong increases in
 ${\mathcal{A}}_{n}$
that manifest when
 $\unicode[STIX]{x1D716}/\unicode[STIX]{x1D6FC}$
approaches unity.
The lack of energy transfer between non-inertial waves and quasi-geostrophic flow in our Boussinesq simulations is surprising in light of analytical (Bühler & McIntyre Reference Bühler and McIntyre2005) and observational (Polzin Reference Polzin2010) results and numerous analogous results for the near-inertial case (Xie & Vanneste Reference Xie and Vanneste2015; Taylor & Straub Reference Taylor and Straub2016; Wagner & Young Reference Wagner and Young2016; Barkan et al. Reference Barkan, Winters and McWilliams2017; Shakespeare & Hogg Reference Shakespeare and Hogg2017). The absence of energy transfer is possibly associated with the strong dispersivity of non-inertial waves, which prevents the cascade of wave energy to relatively small horizontal scales associated with energy transfer in the weakly dispersive near-inertial case. The main qualitative impact of turbulent distortion illustrated by figure 2 appears instead to be the development of caustic-like features from the monochromatic wave field followed by the formation of a complex network of ‘wave dislocations’ (Nye & Berry Reference Nye and Berry1974) as the nearly sinusoidal wave field becomes isotropic. In addition, we stress that the linearized model can only suggest the importance of energy transfer, since it does not include the feedback onto the mean flow associated with energy transfers to and from the wave field and thus does not describe the full dynamics of the coupled system. A more complete assessment of energy transfer between internal tides and quasi-geostrophic flow requires a coupled, energy-conserving model.
In summary, both the hydrostatic wave equation and the linearized Boussinesq system exhibit weak energy transfers between waves and turbulence, and the small transfers in the hydrostatic wave equation are systematically larger than those in linearized Boussinesq system. In the least accurate case in figure 7 where
 $(\unicode[STIX]{x1D6FC},\unicode[STIX]{x1D716})=(0.4,0.14)$
, the hydrostatic wave equation has transfers of the order of 7 %–11 %, while the Boussinesq transfers are always less than 1 %. We speculate that increasing
 $\unicode[STIX]{x1D716}$
will result in larger transfers, but characterization of these transfers lies beyond our present scope.
6.7 Summary of § 6
The hydrostatic wave equation provides an accurate approximation of linearized Boussinesq dynamics when
 $\unicode[STIX]{x1D716}/\unicode[STIX]{x1D6FC}$
is small, or when the wave frequency is sufficiently far from inertial and the quasi-geostrophic flow is weak enough in combination. For example, here the maximum error is everywhere less than 10 % when
 $\unicode[STIX]{x1D716}\leqslant 0.064$
and
 $\unicode[STIX]{x1D6FC}\geqslant 0.8$
. Conversely, great care must be taken in using (1.5) when the wave field approaches near inertial: when
 $\unicode[STIX]{x1D6FC}<0.5$
and
 $\unicode[STIX]{x1D70E}<1.22f$
, maximum error in the hydrostatic wave equation is less than 10 % only when the mean flow is very weak and
 $\unicode[STIX]{x1D716}\leqslant 0.033$
. Failures of the hydrostatic wave equation are systematically associated with too large transfers of wave energy to high wavenumbers and the subsequent development of spuriously small spatial scales in the wave field. Yet even when the hydrostatic wave equation does not well-predict wave field spatial structure it may provide a decent approximation of wave field statistics such as the spectral distribution of wave energy. Finally, for the cases we consider, waves and turbulence exchange only small amounts of energy.
7 Discussion
This paper introduces the ‘hydrostatic wave equation’: a new reduced model for the propagation of three-dimensional hydrostatic internal waves through quasi-geostrophic mean flow. The hydrostatic wave equation exhibited in (1.5) is appropriate for describing the propagation of non-inertial internal tides of arbitrary scale through the inhomogeneous ocean. The primary virtues of the hydrostatic wave equation are the filtering of fast wave oscillations, lack of spatial scale separation assumptions, and description of near-resonant interactions permitted by our use of the method of reconstitution described by Roberts (Reference Roberts1985). This time averaging isolates nonlinear advection and refraction on the slow time scales of quasi-geostrophic flow evolution and permits the use of relatively large time steps in numerical solutions. Time filtering thus facilitates both computations and theoretical analysis, such as an estimate of internal tide scattering rates similar to that applied to Young and Ben Jelloul’s near-inertial equation by Danioux & Vanneste (Reference Danioux and Vanneste2016). The costs of filtering are the errors that emerge when the mean flow is too strong.
The reconstitution of linear leading wave terms with the weakly nonlinear wave–mean interaction terms is central to our derivation of a physical space hydrostatic wave model unencumbered by spatial-scale separation assumptions. Reconstitution has a price, however, in its discomfiting proliferation of a ‘plethora of permissible forms’ for the hydrostatic wave equation, all with the same formal asymptotic error. This issue is resolved by adding and subtracting terms that lie ‘in the noise’ of the formal asymptotic error to obtain a model that best reproduces the dynamics of the linearized hydrostatic Boussinesq equations. We find, like Thomas (Reference Thomas2017) finds in the context of acoustic waves, that the most accurate Galilean invariant model with respect to this criterion is the one with an improved approximation of the parent model’s linear dispersion relation – rather than, for example, a model that conserves wave action or energy. This apparent superiority of accurate linear dynamics over exact conservation laws may be notable, but further work is needed for firm conclusions.
An examination of terms in the hydrostatic wave equation (1.5) refines notions of hydrostatic internal wave ‘advection’ and ‘refraction’. In the hydrostatic Boussinesq system, advection and refraction are each associated with three terms in the momentum and buoyancy equations with the form
 $\bar{\boldsymbol{u}}\boldsymbol{\cdot }\unicode[STIX]{x1D735}\tilde{u}$
and
 $\tilde{\boldsymbol{u}}\boldsymbol{\cdot }\unicode[STIX]{x1D735}\bar{u}$
for advection and refraction respectively, where
 $\tilde{\boldsymbol{u}}$
and
 $\bar{\boldsymbol{u}}$
are wave and mean velocity fields. Yet only part of
 $\bar{\boldsymbol{u}}\boldsymbol{\cdot }\unicode[STIX]{x1D735}\tilde{u}$
, for example, is associated with
 $\text{J}(\unicode[STIX]{x1D713},\text{E}A)$
, which as the advection term of (1.5) ensures Galilean invariance, has the fewest derivatives on
 $\unicode[STIX]{x1D713}$
and is the only surviving nonlinear term in the ‘Wentzel–Kramers–Brillouin (WKB)’ limit where
 $\unicode[STIX]{x1D713}$
has much larger scales than
 $A$
. It is notable that the remaining parts of the Boussinesq advection terms cannot be distinguished from refraction terms, as they cancel and combine to produce the Jacobians on the second line of (1.5). The ‘true’ refraction terms that emerge from (1.5), with three derivatives on
 $\unicode[STIX]{x1D713}$
and one on
 $A$
, are
 $$\begin{eqnarray}\text{J}(A,\text{D}\unicode[STIX]{x1D713})+\frac{\text{i}\unicode[STIX]{x1D70E}}{f}\left(\unicode[STIX]{x1D735}_{h}A\boldsymbol{\cdot }\unicode[STIX]{x1D735}_{h}\text{D}\unicode[STIX]{x1D713}-\frac{\unicode[STIX]{x1D6FC}f^{2}}{N^{2}}A_{z}\text{D}\unicode[STIX]{x1D713}_{z}\right).\end{eqnarray}$$
The terms in (7.1) are largest when
 $\unicode[STIX]{x1D713}$
has much smaller scales than
 $A$
and are some, but not all, of the terms associated with wave advection of quasi-geostrophic vorticity and buoyancy fields. The metamorphosis of advection and refraction terms in the Boussinesq system into three types of terms in (1.5) – advection terms with one derivative on
 $\unicode[STIX]{x1D713}$
and three on
 $A$
, refraction terms with three derivatives on
 $\unicode[STIX]{x1D713}$
and one on
 $A$
and intermediate terms with two derivatives on
 $\unicode[STIX]{x1D713}$
and
 $A$
each – is due to the derivatives that operate on the nonlinear terms in the Boussinesq equations’ wave operator form (2.8). This classification of terms exposes two potential further reductions of (1.5) – the WKB approximation justified when the mean flow has a relatively large scale, which retains only the advection term
 $\text{J}(\unicode[STIX]{x1D713},\text{E}A)$
from (1.5), or a ‘refractive’ approximation justified when the mean flow has a much smaller spatial scale than the wave field that retains only the terms in (7.1) from the right-hand side of (1.5).
A natural question is whether the hydrostatic wave equation can be coupled to the quasi-geostrophic equation in a two-component wave–flow model similar to the models derived by Xie & Vanneste (Reference Xie and Vanneste2015) and Wagner & Young (Reference Wagner and Young2016) for near-inertial waves. Such a coupled model may be derived by using the leading-order expressions in (3.16) to evaluate the wave contribution to potential vorticity,
 $q^{w}$
, defined in equation (1.3) of Wagner & Young (Reference Wagner and Young2015). Evaluating
 $q^{w}$
and diagnosing the nonlinear mean flows associated with hydrostatic waves may reveal important analogies between nonlinear optical phenomena associated with wave dislocations and phase singularities (Desyatnikov, Kivshar & Torner Reference Desyatnikov, Kivshar and Torner2005) and nonlinear internal wave evolution. And a coupled tide–flow model could elucidate the effects that strong oceanic internal tides and tide-induced mean flows have on the energetics and evolution of quasi-geostrophic fronts and eddies, the main reservoir of oceanic kinetic energy and principal agent of oceanic isopycnal stirring.
Acknowledgements
This work was supported by the National Science Foundation under OCE-1357047. We thank P. Bartello, B. Dewar and an anonymous reviewer for constructive criticism, N. Grisouard and J. MacKinnon for helpful comments on a early version of this manuscript, and J. Thomas for discussions on reconstitution.
Appendix A. Wave operator form of the hydrostatic Boussinesq equations
Equations (2.1)–(2.5) can be formulated in terms of a wave operator. To obtain this we first add
 $\unicode[STIX]{x2202}_{t}$
(2.3) to
 $\unicode[STIX]{x2202}_{z}N^{-2}$
(2.4), multiply by
 $f^{2}$
, and use (2.5) to find
 $$\begin{eqnarray}\displaystyle f^{2}(u_{x}+v_{y})=\text{L}p_{t}+\unicode[STIX]{x2202}_{z}\frac{f^{2}}{N^{2}}(\boldsymbol{u}\boldsymbol{\cdot }\unicode[STIX]{x1D735}p_{z}). & & \displaystyle\end{eqnarray}$$
Subtracting
 $\unicode[STIX]{x2202}_{y}$
(2.1) from
 $\unicode[STIX]{x2202}_{x}$
(2.2), multiplying by
 $f$
and using (A 1) yields the vertical vorticity equation,
 $$\begin{eqnarray}f\unicode[STIX]{x2202}_{t}(v_{x}-u_{y})+\text{L}p_{t}=-f\unicode[STIX]{x1D735}_{\bot }\boldsymbol{\cdot }(\boldsymbol{u}\boldsymbol{\cdot }\unicode[STIX]{x1D735})\boldsymbol{u}-\unicode[STIX]{x2202}_{z}\frac{f^{2}}{N^{2}}(\boldsymbol{u}\boldsymbol{\cdot }\unicode[STIX]{x1D735}p_{z}),\end{eqnarray}$$
where
 $\unicode[STIX]{x1D735}_{\bot }=-\unicode[STIX]{x2202}_{y}\hat{\boldsymbol{x}}+\unicode[STIX]{x2202}_{x}\hat{\boldsymbol{y}}$
. Next, adding
 $\unicode[STIX]{x2202}_{x}$
(2.1) to
 $\unicode[STIX]{x2202}_{y}$
(2.2), using (A 1), and operating on the result with
 $f^{2}\unicode[STIX]{x2202}_{t}$
leads to
 $$\begin{eqnarray}\unicode[STIX]{x2202}_{t}(\unicode[STIX]{x2202}_{t}^{2}\text{L}+f^{2}\unicode[STIX]{x0394})p+\unicode[STIX]{x2202}_{z}\unicode[STIX]{x2202}_{t}^{2}\frac{f^{2}}{N^{2}}(\boldsymbol{u}\boldsymbol{\cdot }\unicode[STIX]{x1D735}p_{z})-f^{3}\unicode[STIX]{x1D714}_{t}=-f^{2}\unicode[STIX]{x2202}_{t}\unicode[STIX]{x2202}_{x}(\boldsymbol{u}\boldsymbol{\cdot }\unicode[STIX]{x1D735}u)-f^{2}\unicode[STIX]{x2202}_{t}\unicode[STIX]{x2202}_{y}(\boldsymbol{u}\boldsymbol{\cdot }\unicode[STIX]{x1D735}v).\end{eqnarray}$$
Adding (A 3) to
 $f^{2}(\text{A}\,2)$
eliminates
 $f^{3}\unicode[STIX]{x1D714}_{t}$
and yields the wave operator form of (2.1) through (2.5),
 $$\begin{eqnarray}\unicode[STIX]{x2202}_{t}[\unicode[STIX]{x2202}_{t}^{2}\text{L}+f^{2}(\unicode[STIX]{x0394}+\text{L})]p=-f^{2}(\unicode[STIX]{x2202}_{t}\unicode[STIX]{x1D735}_{h}+f\unicode[STIX]{x1D735}_{\bot })\boldsymbol{\cdot }(\boldsymbol{u}\boldsymbol{\cdot }\unicode[STIX]{x1D735})\boldsymbol{u}-\unicode[STIX]{x2202}_{z}\frac{f^{2}}{N^{2}}(\unicode[STIX]{x2202}_{t}^{2}+f^{2})(\boldsymbol{u}\boldsymbol{\cdot }\unicode[STIX]{x1D735}p_{z}),\end{eqnarray}$$
where
 $\unicode[STIX]{x1D735}_{h}=\unicode[STIX]{x2202}_{x}\hat{\boldsymbol{x}}+\unicode[STIX]{x2202}_{y}\hat{\boldsymbol{y}}$
is the horizontal part of the gradient operator.
Appendix B. The part of RHS in (3.18) proportional to
$\text{e}^{-\text{i}\unicode[STIX]{x1D70E}\tilde{t}}$

In this appendix we parse the right-hand side of (3.17), or ‘RHS’, for its part proportional to
 $\text{e}^{-\text{i}\unicode[STIX]{x1D70E}\tilde{t}}$
. The RHS defined in (3.18) is
 $$\begin{eqnarray}\text{RHS}=-f^{2}(\unicode[STIX]{x2202}_{\tilde{t}}\unicode[STIX]{x1D735}_{h}+f\unicode[STIX]{x1D735}_{\bot })\boldsymbol{\cdot }(\boldsymbol{u}\boldsymbol{\cdot }\unicode[STIX]{x1D735})\boldsymbol{u}-\unicode[STIX]{x2202}_{z}\frac{f^{2}}{N^{2}}(\unicode[STIX]{x2202}_{\tilde{t}}^{2}+f^{2})(\boldsymbol{u}\boldsymbol{\cdot }\unicode[STIX]{x1D735}p_{z}).\end{eqnarray}$$
In (B 1) and hereafter we drop the subscripts ‘0’ denoting leading-order fields for clarity. All fields are leading-order, so that
 $(\boldsymbol{u},p)=(\boldsymbol{u}_{0},p_{0})$
.
B.1 The leading-order solution
The leading-order pressure is
 $$\begin{eqnarray}p=f(\unicode[STIX]{x1D713}+\text{e}^{-\text{i}\unicode[STIX]{x1D70E}\tilde{t}}A+\text{e}^{\text{i}\unicode[STIX]{x1D70E}\tilde{t}}A^{\ast }),\end{eqnarray}$$
and the velocity
 $\boldsymbol{u}$
is given in (3.16). An expression more compact than (3.16) and useful for the strenuous bookkeeping that follows is
 $$\begin{eqnarray}\boldsymbol{u}=\unicode[STIX]{x1D735}_{\bot }\unicode[STIX]{x1D713}-\frac{\text{e}^{-\text{i}\unicode[STIX]{x1D70E}\tilde{t}}}{\unicode[STIX]{x1D6FC}f}(\text{i}\unicode[STIX]{x1D70E}\unicode[STIX]{x1D735}_{\unicode[STIX]{x1D6FC}}+f\unicode[STIX]{x1D735}_{\bot })A+\frac{\text{e}^{\text{i}\unicode[STIX]{x1D70E}\tilde{t}}}{\unicode[STIX]{x1D6FC}f}(\text{i}\unicode[STIX]{x1D70E}\unicode[STIX]{x1D735}_{\unicode[STIX]{x1D6FC}}-f\unicode[STIX]{x1D735}_{\bot })A^{\ast },\end{eqnarray}$$
where
 $\unicode[STIX]{x1D735}_{\bot }=-\unicode[STIX]{x2202}_{y}\hat{\boldsymbol{x}}+\unicode[STIX]{x2202}_{x}\hat{\boldsymbol{y}}$
and the three-component vector operator
 $\unicode[STIX]{x1D735}_{\unicode[STIX]{x1D6FC}}$
is defined
 $$\begin{eqnarray}\unicode[STIX]{x1D735}_{\unicode[STIX]{x1D6FC}}\stackrel{\text{def}}{=}\unicode[STIX]{x2202}_{x}\hat{\boldsymbol{x}}+\unicode[STIX]{x2202}_{y}\hat{\boldsymbol{y}}-\frac{\unicode[STIX]{x1D6FC}f^{2}}{N^{2}}\unicode[STIX]{x2202}_{z}\hat{\boldsymbol{z}}.\end{eqnarray}$$
Notice that
 $\unicode[STIX]{x1D735}_{\unicode[STIX]{x1D6FC}}$
does not commute with
 $\unicode[STIX]{x2202}_{z}$
and that
 $\unicode[STIX]{x1D735}\boldsymbol{\cdot }\unicode[STIX]{x1D735}_{\unicode[STIX]{x1D6FC}}=\unicode[STIX]{x0394}-\unicode[STIX]{x1D6FC}\text{L}=\text{D}$
. The first-order advective derivative is
 $$\begin{eqnarray}\boldsymbol{u}\boldsymbol{\cdot }\unicode[STIX]{x1D735}=\text{J}(\unicode[STIX]{x1D713},\bullet )-\frac{\text{e}^{-\text{i}\unicode[STIX]{x1D70E}\tilde{t}}}{\unicode[STIX]{x1D6FC}f}[f\text{J}(A,\bullet )+\text{i}\unicode[STIX]{x1D70E}\unicode[STIX]{x1D735}_{\unicode[STIX]{x1D6FC}}A\boldsymbol{\cdot }\unicode[STIX]{x1D735}]+\text{c.c.}\end{eqnarray}$$
The horizontal divergence and vertical vorticity
 $\unicode[STIX]{x1D714}\stackrel{\text{def}}{=}\unicode[STIX]{x1D735}_{\bot }\boldsymbol{\cdot }\boldsymbol{u}$
are
 $$\begin{eqnarray}\unicode[STIX]{x1D735}_{h}\boldsymbol{\cdot }\boldsymbol{u}=\frac{\text{i}\unicode[STIX]{x1D70E}}{\unicode[STIX]{x1D6FC}f}\unicode[STIX]{x0394}(\text{e}^{\text{i}\unicode[STIX]{x1D70E}\tilde{t}}A^{\ast }-\text{e}^{-\text{i}\unicode[STIX]{x1D70E}\tilde{t}}A),\quad \text{and}\quad \unicode[STIX]{x1D714}=\unicode[STIX]{x0394}\unicode[STIX]{x1D713}-\unicode[STIX]{x1D6FC}^{-1}\unicode[STIX]{x0394}(\text{e}^{-\text{i}\unicode[STIX]{x1D70E}\tilde{t}}A+\text{e}^{\text{i}\unicode[STIX]{x1D70E}\tilde{t}}A^{\ast }).\end{eqnarray}$$
A third useful derivative quantity is
 $$\begin{eqnarray}(\unicode[STIX]{x2202}_{\tilde{t}}\unicode[STIX]{x1D735}_{h}+f\unicode[STIX]{x1D735}_{\bot })\boldsymbol{\cdot }\boldsymbol{u}=f\unicode[STIX]{x0394}\unicode[STIX]{x1D713}-\frac{\unicode[STIX]{x1D70E}^{2}+f^{2}}{\unicode[STIX]{x1D6FC}f}\unicode[STIX]{x0394}(\text{e}^{-\text{i}\unicode[STIX]{x1D70E}\tilde{t}}A+\text{e}^{\text{i}\unicode[STIX]{x1D70E}\tilde{t}}A^{\ast }).\end{eqnarray}$$
The average energy density in the hydrostatic linear solution is
 $$\begin{eqnarray}\displaystyle e^{A} & = & \displaystyle \frac{1}{2}(\overline{u^{2}}+\overline{v^{2}}+N^{-2}\overline{b^{2}}),\end{eqnarray}$$
 $$\begin{eqnarray}\displaystyle & = & \displaystyle \frac{1}{2}|\unicode[STIX]{x1D735}_{h}\unicode[STIX]{x1D713}|^{2}+\frac{f^{2}}{2N^{2}}\unicode[STIX]{x1D713}_{z}^{2}+\frac{2+\unicode[STIX]{x1D6FC}}{\unicode[STIX]{x1D6FC}^{2}}|\unicode[STIX]{x1D735}_{h}A|^{2}+\frac{2\text{i}\sqrt{1+\unicode[STIX]{x1D6FC}}}{\unicode[STIX]{x1D6FC}^{2}}\text{J}(A^{\ast },A)+\frac{f^{2}}{N^{2}}|A_{z}|^{2},\end{eqnarray}$$
and the total, integrated ‘wave energy’ is
 $$\begin{eqnarray}{\mathcal{E}}^{A}\stackrel{\text{def}}{=}\int \frac{\unicode[STIX]{x1D6FC}+2}{\unicode[STIX]{x1D6FC}^{2}}|\unicode[STIX]{x1D735}_{h}A|^{2}+\frac{f^{2}}{N^{2}}|A_{z}|^{2}\,\text{d}V.\end{eqnarray}$$
The first term in (B 10) is total wave kinetic energy and the second term is total wave potential energy. The Jacobian contribution to
 $e^{A}$
in (B 9) integrates to zero and thus does not contribute to the integral quantity
 ${\mathcal{E}}^{A}$
in (B 10).
 ${\mathcal{E}}^{A}$
is conserved only over short times in the hydrostatic wave equation (1.5).
B.2 Some strenuous bookkeeping
We tackle the momentum advection term in (B 1) first, which expands into
 $$\begin{eqnarray}\displaystyle f^{2}(\unicode[STIX]{x2202}_{\tilde{t}}\unicode[STIX]{x1D735}_{h}+f\unicode[STIX]{x1D735}_{\bot })\boldsymbol{\cdot }(\boldsymbol{u}\boldsymbol{\cdot }\unicode[STIX]{x1D735})\boldsymbol{u} & = & \displaystyle f^{2}(\boldsymbol{u}\boldsymbol{\cdot }\unicode[STIX]{x1D735})(\unicode[STIX]{x2202}_{\tilde{t}}\unicode[STIX]{x1D735}_{h}+f\unicode[STIX]{x1D735}_{\bot })\boldsymbol{\cdot }\boldsymbol{u}\nonumber\\ \displaystyle & & \displaystyle +\,f^{2}(\boldsymbol{u}_{xt}-f\boldsymbol{u}_{y})\boldsymbol{\cdot }\unicode[STIX]{x1D735}u+f^{2}(\boldsymbol{u}_{yt}+f\boldsymbol{u}_{x})\boldsymbol{\cdot }\unicode[STIX]{x1D735}v\nonumber\\ \displaystyle & & \displaystyle +\,f^{2}\boldsymbol{u}_{x}\boldsymbol{\cdot }\unicode[STIX]{x1D735}u_{t}+f^{2}\boldsymbol{u}_{y}\boldsymbol{\cdot }\unicode[STIX]{x1D735}v_{t}+f^{2}\boldsymbol{u}_{t}\boldsymbol{\cdot }\unicode[STIX]{x1D735}(u_{x}+v_{y}).\qquad\end{eqnarray}$$
Using (B 5) and multiplying by
 $\text{e}^{\text{i}\unicode[STIX]{x1D70E}\tilde{t}}\unicode[STIX]{x1D6FC}/f$
yields
 $$\begin{eqnarray}\displaystyle \text{e}^{\text{i}\unicode[STIX]{x1D70E}\tilde{t}}\unicode[STIX]{x1D6FC}f(\boldsymbol{u}\boldsymbol{\cdot }\unicode[STIX]{x1D735})(\unicode[STIX]{x2202}_{\tilde{t}}\unicode[STIX]{x1D735}_{h}+f\unicode[STIX]{x1D735}_{\bot })\boldsymbol{\cdot }\boldsymbol{u} & = & \displaystyle -(\unicode[STIX]{x1D70E}^{2}+f^{2})\text{J}(\unicode[STIX]{x1D713},\unicode[STIX]{x0394}A)-f^{2}\text{J}(A,\unicode[STIX]{x0394}\unicode[STIX]{x1D713})\nonumber\\ \displaystyle & & \displaystyle -\,\text{i}\unicode[STIX]{x1D70E}f\unicode[STIX]{x1D735}_{\unicode[STIX]{x1D6FC}}A\boldsymbol{\cdot }\unicode[STIX]{x1D735}\unicode[STIX]{x0394}\unicode[STIX]{x1D713}+\cdots ,\end{eqnarray}$$
where throughout this subappendix the
 $\cdots$
stand for terms that do not contribute to the part of RHS proportional to
 $\text{e}^{-\text{i}\unicode[STIX]{x1D70E}\tilde{t}}$
. The next two terms are somewhat more involved. We eventually obtain
 $$\begin{eqnarray}\displaystyle \text{e}^{\text{i}\unicode[STIX]{x1D70E}\tilde{t}}\unicode[STIX]{x1D6FC}f(\boldsymbol{u}_{xt}-f\boldsymbol{u}_{y})\boldsymbol{\cdot }\unicode[STIX]{x1D735}u & = & \displaystyle 2\text{i}\unicode[STIX]{x1D70E}f\text{J}(\unicode[STIX]{x1D713}_{y},A_{x})\nonumber\\ \displaystyle & & \displaystyle +\,\unicode[STIX]{x1D70E}^{2}\unicode[STIX]{x1D735}_{\unicode[STIX]{x1D6FC}}A_{x}\boldsymbol{\cdot }\unicode[STIX]{x1D735}\unicode[STIX]{x1D713}_{y}-\text{i}\unicode[STIX]{x1D70E}f\unicode[STIX]{x1D735}_{\unicode[STIX]{x1D6FC}}A_{y}\boldsymbol{\cdot }\unicode[STIX]{x1D735}\unicode[STIX]{x1D713}_{y}+\cdots ,\end{eqnarray}$$
and
 $$\begin{eqnarray}\displaystyle \text{e}^{\text{i}\unicode[STIX]{x1D70E}\tilde{t}}\unicode[STIX]{x1D6FC}f(\boldsymbol{u}_{yt}+f\boldsymbol{u}_{x})\boldsymbol{\cdot }\unicode[STIX]{x1D735}v & = & \displaystyle -2\text{i}\unicode[STIX]{x1D70E}f\text{J}(\unicode[STIX]{x1D713}_{x},A_{y})\nonumber\\ \displaystyle & & \displaystyle -\,\unicode[STIX]{x1D70E}^{2}\unicode[STIX]{x1D735}_{\unicode[STIX]{x1D6FC}}A_{y}\boldsymbol{\cdot }\unicode[STIX]{x1D735}\unicode[STIX]{x1D713}_{x}-\text{i}\unicode[STIX]{x1D70E}f\unicode[STIX]{x1D735}_{\unicode[STIX]{x1D6FC}}A_{x}\boldsymbol{\cdot }\unicode[STIX]{x1D735}\unicode[STIX]{x1D713}_{x}+\cdots .\end{eqnarray}$$
The fourth and fifth terms in (B 11) are
 $$\begin{eqnarray}\displaystyle \text{e}^{\text{i}\unicode[STIX]{x1D70E}\tilde{t}}\unicode[STIX]{x1D6FC}f(\boldsymbol{u}_{x}\boldsymbol{\cdot }\unicode[STIX]{x1D735}u_{t}+\boldsymbol{u}_{y}\boldsymbol{\cdot }\unicode[STIX]{x1D735}v_{t}) & = & \displaystyle -\unicode[STIX]{x1D70E}^{2}\text{J}(\unicode[STIX]{x1D713}_{x},A_{x})-\unicode[STIX]{x1D70E}^{2}\text{J}(\unicode[STIX]{x1D713}_{y},A_{y})\nonumber\\ \displaystyle & & \displaystyle +\,\text{i}\unicode[STIX]{x1D70E}f\text{J}(\unicode[STIX]{x1D713}_{y},A_{x})-\text{i}\unicode[STIX]{x1D70E}f\text{J}(\unicode[STIX]{x1D713}_{x},A_{y}).\end{eqnarray}$$
The sixth term in (B 11) has no part proportional to
 $\text{e}^{-\text{i}\unicode[STIX]{x1D70E}t}$
because both
 $\boldsymbol{u}_{t}$
and
 $u_{x}+v_{y}=-w_{z}$
oscillate with frequency
 $\unicode[STIX]{x1D70E}$
. At last, the second term in (B 1) is
 $$\begin{eqnarray}\displaystyle & & \displaystyle \text{e}^{\text{i}\unicode[STIX]{x1D70E}\tilde{t}}\unicode[STIX]{x2202}_{z}\frac{\unicode[STIX]{x1D6FC}f}{N^{2}}(\unicode[STIX]{x2202}_{t}^{2}+f^{2})(\boldsymbol{u}\boldsymbol{\cdot }\unicode[STIX]{x1D735}p_{z})\nonumber\\ \displaystyle & & \displaystyle \quad =-\unicode[STIX]{x2202}_{z}\frac{\unicode[STIX]{x1D6FC}^{2}f^{2}}{N^{2}}[f^{2}\text{J}(\unicode[STIX]{x1D713},A_{z})-\unicode[STIX]{x1D6FC}^{-1}f^{2}\text{J}(A,\unicode[STIX]{x1D713}_{z})-\text{i}\unicode[STIX]{x1D6FC}^{-1}\unicode[STIX]{x1D70E}f\unicode[STIX]{x1D735}_{\unicode[STIX]{x1D6FC}}A\boldsymbol{\cdot }\unicode[STIX]{x1D735}\unicode[STIX]{x1D713}_{z}]+\cdots ,\end{eqnarray}$$
 $$\begin{eqnarray}\displaystyle & & \displaystyle \quad =-\unicode[STIX]{x1D70E}^{2}\frac{\unicode[STIX]{x1D6FC}f^{2}}{N^{2}}\text{J}(\unicode[STIX]{x1D713}_{z},A_{z})-\unicode[STIX]{x1D6FC}^{2}f^{2}\text{J}(\unicode[STIX]{x1D713},\text{L}A)-\unicode[STIX]{x1D6FC}f^{2}\text{J}(\text{L}\unicode[STIX]{x1D713},A)\nonumber\\ \displaystyle & & \displaystyle \qquad +\,\text{i}\unicode[STIX]{x1D70E}f\unicode[STIX]{x2202}_{z}\left(\unicode[STIX]{x1D735}_{\unicode[STIX]{x1D6FC}}A\boldsymbol{\cdot }\frac{\unicode[STIX]{x1D6FC}f^{2}}{N^{2}}\unicode[STIX]{x2202}_{z}\unicode[STIX]{x1D735}\unicode[STIX]{x1D713}\right)+\cdots .\end{eqnarray}$$
The extra factor of
 $-\unicode[STIX]{x1D6FC}f^{2}$
on the right of (B 16) comes from the relation
 $\unicode[STIX]{x1D70E}^{2}-f^{2}=\unicode[STIX]{x1D6FC}f^{2}$
. In passing from (B 16) to (B 17) we employ the Jacobian identity
 $\text{J}\left(A,\unicode[STIX]{x1D713}_{z}\right)=-\text{J}\left(\unicode[STIX]{x1D713}_{z},A\right)$
, distribute the
 $z$
-derivative and use
 $\unicode[STIX]{x1D6FC}+1=\unicode[STIX]{x1D70E}^{2}/f^{2}$
.
We next collect the contributions to
 $\unicode[STIX]{x1D6FC}\text{RHS}/f$
in (B 12)
 $+$
(B 13)
 $+$
(B 14)
 $+$
(B 17) and organize them according to whether they are multiplied by
 $\unicode[STIX]{x1D70E}^{2}$
,
 $f^{2}$
or
 $\text{i}\unicode[STIX]{x1D70E}f$
. We observe a cancellation within the collection
 $$\begin{eqnarray}\unicode[STIX]{x1D735}_{\unicode[STIX]{x1D6FC}}A_{x}\boldsymbol{\cdot }\unicode[STIX]{x1D735}\unicode[STIX]{x1D713}_{y}-\unicode[STIX]{x1D735}_{\unicode[STIX]{x1D6FC}}A_{y}\boldsymbol{\cdot }\unicode[STIX]{x1D735}\unicode[STIX]{x1D713}_{x}-\frac{\unicode[STIX]{x1D6FC}f^{2}}{N^{2}}\text{J}(\unicode[STIX]{x1D713}_{z},A_{z})=-\text{J}(\unicode[STIX]{x1D713}_{x},A_{x})-\text{J}(\unicode[STIX]{x1D713}_{y},A_{y}),\end{eqnarray}$$
which, along with the identity
 $$\begin{eqnarray}\unicode[STIX]{x0394}\text{J}(\unicode[STIX]{x1D713},A)=\text{J}(\unicode[STIX]{x0394}\unicode[STIX]{x1D713},A)+\text{J}(\unicode[STIX]{x1D713},\unicode[STIX]{x0394}A)+2\text{J}(\unicode[STIX]{x1D713}_{x},A_{x})+2\text{J}(\unicode[STIX]{x1D713}_{y},A_{y}),\end{eqnarray}$$
permits the simplification of terms proportional to
 $\unicode[STIX]{x1D70E}^{2}$
:
 $$\begin{eqnarray}\displaystyle \frac{1}{\unicode[STIX]{x1D70E}^{2}}T_{\unicode[STIX]{x1D70E}^{2}} & = & \displaystyle -\text{J}(\unicode[STIX]{x1D713},\unicode[STIX]{x0394}A)-\text{J}(\unicode[STIX]{x1D713}_{x},A_{x})-\text{J}(\unicode[STIX]{x1D713}_{y},A_{y})\nonumber\\ \displaystyle & & \displaystyle +\,\unicode[STIX]{x1D735}_{\unicode[STIX]{x1D6FC}}A_{x}\boldsymbol{\cdot }\unicode[STIX]{x1D735}\unicode[STIX]{x1D713}_{y}-\unicode[STIX]{x1D735}_{\unicode[STIX]{x1D6FC}}A_{y}\boldsymbol{\cdot }\unicode[STIX]{x1D735}\unicode[STIX]{x1D713}_{x}-\frac{\unicode[STIX]{x1D6FC}f^{2}}{N^{2}}\text{J}(\unicode[STIX]{x1D713}_{z},A_{z}),\end{eqnarray}$$
 $$\begin{eqnarray}\displaystyle & = & \displaystyle -\text{J}(\unicode[STIX]{x1D713},\unicode[STIX]{x0394}A)-2\text{J}(\unicode[STIX]{x1D713}_{x},A_{x})-2\text{J}(\unicode[STIX]{x1D713}_{y},A_{y}).\end{eqnarray}$$
Next, we employ the notation
 $\text{D}=\unicode[STIX]{x0394}-\unicode[STIX]{x1D6FC}\text{L}$
in writing terms proportional to
 $f^{2}$
:
 $$\begin{eqnarray}\displaystyle \frac{1}{f^{2}}T_{f^{2}} & = & \displaystyle -\text{J}(\unicode[STIX]{x1D713},\unicode[STIX]{x0394}A)+\text{J}(\unicode[STIX]{x0394}\unicode[STIX]{x1D713},A)-\unicode[STIX]{x1D6FC}^{2}\text{J}(\unicode[STIX]{x1D713},\text{L}A)-\unicode[STIX]{x1D6FC}\text{J}(\text{L}\unicode[STIX]{x1D713},A),\end{eqnarray}$$
 $$\begin{eqnarray}\displaystyle & = & \displaystyle -\text{J}(\unicode[STIX]{x1D713},\unicode[STIX]{x0394}A)-\unicode[STIX]{x1D6FC}^{2}\text{J}(\unicode[STIX]{x1D713},\text{L}A)+\text{J}(\text{D}\unicode[STIX]{x1D713},A),\end{eqnarray}$$
Finally, the terms proportional to
 $\text{i}\unicode[STIX]{x1D70E}f$
are
 $$\begin{eqnarray}\displaystyle \frac{1}{\text{i}\unicode[STIX]{x1D70E}f}T_{\unicode[STIX]{x1D70E}f} & = & \displaystyle 3\text{J}(\unicode[STIX]{x1D713}_{y},A_{x})-3\text{J}(\unicode[STIX]{x1D713}_{x},A_{y})-\unicode[STIX]{x1D735}_{\unicode[STIX]{x1D6FC}}A\boldsymbol{\cdot }\unicode[STIX]{x1D735}\unicode[STIX]{x0394}\unicode[STIX]{x1D713}-\unicode[STIX]{x1D735}_{\unicode[STIX]{x1D6FC}}A_{x}\boldsymbol{\cdot }\unicode[STIX]{x1D735}\unicode[STIX]{x1D713}_{x}-\unicode[STIX]{x1D735}_{\unicode[STIX]{x1D6FC}}A_{y}\boldsymbol{\cdot }\unicode[STIX]{x1D735}\unicode[STIX]{x1D713}_{y}\nonumber\\ \displaystyle & & \displaystyle +\,\unicode[STIX]{x2202}_{z}\left(\unicode[STIX]{x1D735}_{\unicode[STIX]{x1D6FC}}A\boldsymbol{\cdot }\frac{\unicode[STIX]{x1D6FC}f^{2}}{N^{2}}\unicode[STIX]{x2202}_{z}\unicode[STIX]{x1D735}\unicode[STIX]{x1D713}\right).\end{eqnarray}$$
Some rearrangement and combination of terms leads eventually to the identity
 $$\begin{eqnarray}\displaystyle & & \displaystyle \unicode[STIX]{x1D735}_{\unicode[STIX]{x1D6FC}}A\boldsymbol{\cdot }\unicode[STIX]{x1D735}\unicode[STIX]{x0394}\unicode[STIX]{x1D713}+\unicode[STIX]{x1D735}_{\unicode[STIX]{x1D6FC}}A_{x}\boldsymbol{\cdot }\unicode[STIX]{x1D735}\unicode[STIX]{x1D713}_{x}+\unicode[STIX]{x1D735}_{\unicode[STIX]{x1D6FC}}A_{y}\boldsymbol{\cdot }\unicode[STIX]{x1D735}\unicode[STIX]{x1D713}_{y}-\unicode[STIX]{x2202}_{z}\left(\unicode[STIX]{x1D735}_{\unicode[STIX]{x1D6FC}}A\boldsymbol{\cdot }\frac{\unicode[STIX]{x1D6FC}f^{2}}{N^{2}}\unicode[STIX]{x2202}_{z}\unicode[STIX]{x1D735}\unicode[STIX]{x1D713}\right)\nonumber\\ \displaystyle & & \displaystyle \quad =\text{J}(\unicode[STIX]{x1D713}_{y},A_{x})-\text{J}(\unicode[STIX]{x1D713}_{x},A_{y})+\unicode[STIX]{x2202}_{x}(A_{x}\text{D}\unicode[STIX]{x1D713})+\unicode[STIX]{x2202}_{y}(A_{y}\text{D}\unicode[STIX]{x1D713})\nonumber\\ \displaystyle & & \displaystyle \qquad -\text{D}\left(\frac{\unicode[STIX]{x1D6FC}f^{2}}{N^{2}}\unicode[STIX]{x1D713}_{z}A_{z}\right)+\unicode[STIX]{x2202}_{z}\left(\frac{\unicode[STIX]{x1D6FC}f^{2}}{N^{2}}\unicode[STIX]{x1D713}_{z}\text{D}A\right).\end{eqnarray}$$
Using (B 25) to simplify (B 24) yields
 $$\begin{eqnarray}\frac{1}{\text{i}\unicode[STIX]{x1D70E}f}T_{\unicode[STIX]{x1D70E}f}=2\text{J}(\unicode[STIX]{x1D713}_{y},A_{x})-2\text{J}(\unicode[STIX]{x1D713}_{x},A_{y})-\unicode[STIX]{x1D735}_{h}\boldsymbol{\cdot }(\text{D}\unicode[STIX]{x1D713}\unicode[STIX]{x1D735}_{h}A)+\text{D}\left(\frac{\unicode[STIX]{x1D6FC}f^{2}}{N^{2}}\unicode[STIX]{x1D713}_{z}A_{z}\right)-\unicode[STIX]{x2202}_{z}\left(\frac{\unicode[STIX]{x1D6FC}f^{2}}{N^{2}}\unicode[STIX]{x1D713}_{z}\text{D}A\right)\!.\end{eqnarray}$$
B.3 The final tally
With (B 21), (B 23) and (B 26), we have all the pieces needed to construct RHS. We find that
 $$\begin{eqnarray}\displaystyle \frac{\unicode[STIX]{x1D6FC}}{f}\overline{\text{e}^{\text{i}\unicode[STIX]{x1D70E}\tilde{t}}\text{RHS}} & = & \displaystyle -(T_{\unicode[STIX]{x1D70E}^{2}}+T_{f^{2}}+T_{\unicode[STIX]{x1D70E}f}),\end{eqnarray}$$
 $$\begin{eqnarray}\displaystyle & = & \displaystyle (\unicode[STIX]{x1D70E}^{2}+f^{2})\text{J}(\unicode[STIX]{x1D713},\unicode[STIX]{x0394}A)+(\unicode[STIX]{x1D6FC}f)^{2}\text{J}(\unicode[STIX]{x1D713},\text{L}A)-f^{2}\text{J}(\text{D}\unicode[STIX]{x1D713},A)\nonumber\\ \displaystyle & & \displaystyle -\,2\text{i}\unicode[STIX]{x1D70E}[\text{J}(\unicode[STIX]{x1D713}_{x},\text{i}\unicode[STIX]{x1D70E}A_{x}-fA_{y})+\text{J}(\unicode[STIX]{x1D713}_{y},\text{i}\unicode[STIX]{x1D70E}A_{y}+fA_{x})]\nonumber\\ \displaystyle & & \displaystyle +\,\text{i}\unicode[STIX]{x1D70E}f\left[\unicode[STIX]{x1D735}_{h}\boldsymbol{\cdot }(\text{D}\unicode[STIX]{x1D713}\unicode[STIX]{x1D735}_{h}A)-\text{D}\left(\frac{\unicode[STIX]{x1D6FC}f^{2}}{N^{2}}\unicode[STIX]{x1D713}_{z}A_{z}\right)+\unicode[STIX]{x2202}_{z}\left(\frac{\unicode[STIX]{x1D6FC}f^{2}}{N^{2}}\unicode[STIX]{x1D713}_{z}\text{D}A\right)\right].\qquad\end{eqnarray}$$