This report sheds new light on developments in public opinion in contemporary China through an original examination of the three most recent waves of the World Values Survey (WVS) of China. Data from the latest WVS of China, Wave 7, which was conducted in 2018, were released in late July 2020. This report is among the first to analyse the data in comparison with data collected in Waves 5 (2007) and 6 (2012–13).Footnote 1 The temporal spacing of the waves is useful in capturing public opinion midway through the Hu Jintao 胡锦涛 administration (2007), during the transition from the Hu to the Xi Jinping 习近平 administration (late 2012–early 2013), and roughly five years into the Xi administration (2018).
Our comparative analysis uncovers deeper dynamics beneath the strong trust in government found in other studies, revealing sources of potential regime weakness. High and rising levels of trust in government among Chinese citizens from the early 1990s through to the present are documented in numerous respected public opinion surveys.Footnote 2 Most explanations centre on the regime's adaptability, openness to input and satisfactory fulfilment of the basic functions of government.Footnote 3 Relatedly, scholars point to economic performance as the foundation of regime legitimacy, supplemented by more ideational foci such as nationalism and, particularly under Xi Jinping, the punishment of corrupt officials.Footnote 4
Our examination of recent WVS data provides new insight into the interplay of these factors over time and across demographic groups. In particular, the report illustrates how particular means of political participation are used and viewed by various categories of Chinese citizens. Perhaps most interestingly, local election participation appears to have no positive relationship with regime trust, even when citizens express an increased belief in free elections as a key component of democracy. At the same time, a rise in the personal proclivity to engage in peaceful demonstrations is positively related to increased regime trust; perceptions of greater prevalence of corruption coincide with lower political trust. Thus, constraints on people's ability to engage in peaceful demonstrations to address concerns about corruption are likely to negatively impact views on regime legitimacy. In addition, regime legitimacy appears more precarious among citizens at the bottom of the socioeconomic hierarchy and among younger Chinese.
Our findings also complicate explanations of regime legitimacy centring on economic performance. In alignment with what such explanations would expect, declined trust in government between 2007 and 2012–2013 coincided with a sharp drop in China's economic growth rate (from 14.23 per cent in 2007 to 7.86 per cent in 2012). Yet, from 2012 to 2018, trust in government rose alongside slowed economic growth (6.75 per cent in 2018), suggesting that the relationship between economic performance and regime legitimacy is more complex.Footnote 5
Analysis
To gain a deeper understanding of public political attitudes from 2007 to 2018, we analyse WVS responses in Waves 5, 6 and 7 on questions regarding trust in government, satisfaction with system performance, happiness and life satisfaction, political engagement, corruption, support for free elections, and demographic variables such as age, social class, education level and gender. Co-author Hu ran linear regressions on the effect of demographic characteristics on several survey questions that relate to the topics listed above. Charts are included for OLS results with all waves of the data in the body of the paper. Gender is coded as a binary variable, where 0 is male and 1 is female. Social class is asked subjectively of the respondent with the choices: 1 – upper class; 2 – upper-middle class; 3 – lower-middle class; 4 – working class; and 5 – lower class. In this paper's analysis, the coding is reversed so that a higher social class is associated with the larger number. In the original survey, education had nine levels; this has been recoded to four levels – primary, secondary, post-secondary and tertiary – to gain better consistency across all waves. To investigate whether there was a change in the response between survey years, a dummy variable was added for each survey year. For each indicator, one model was built with all the data (Waves 5, 6, and 7).
Results
Our analysis reveals novel findings related to popular political satisfaction in contemporary China. First, the model shows a decrease in trust in China's political system during the last half of the Hu administration and an increase during the first five years of the Xi administration. Meanwhile, the data reveal a rise in the individual proclivity to engage in activism and increased belief in the importance of free elections as a component of democracy but decreased participation in local elections. The model also depicts demographic variations, most notably in terms of age and social class. From Wave 6 to Wave 7, we see increased happiness across all age groups, but a greater rise among older respondents. Simultaneously, the data show increased happiness for all social classes apart from those identifying as “upper class” (reporting a slight decline), and a greater increase in happiness as one moves downward from “upper-middle class” to “lower class” respondents. Looking only at the Wave 7 data, respondents of higher age and social class express more trust in government, more satisfaction with system performance and lower perceptions of political corruption. The results below are divided by survey indicators that relate to different groups of questions.
Trust in government
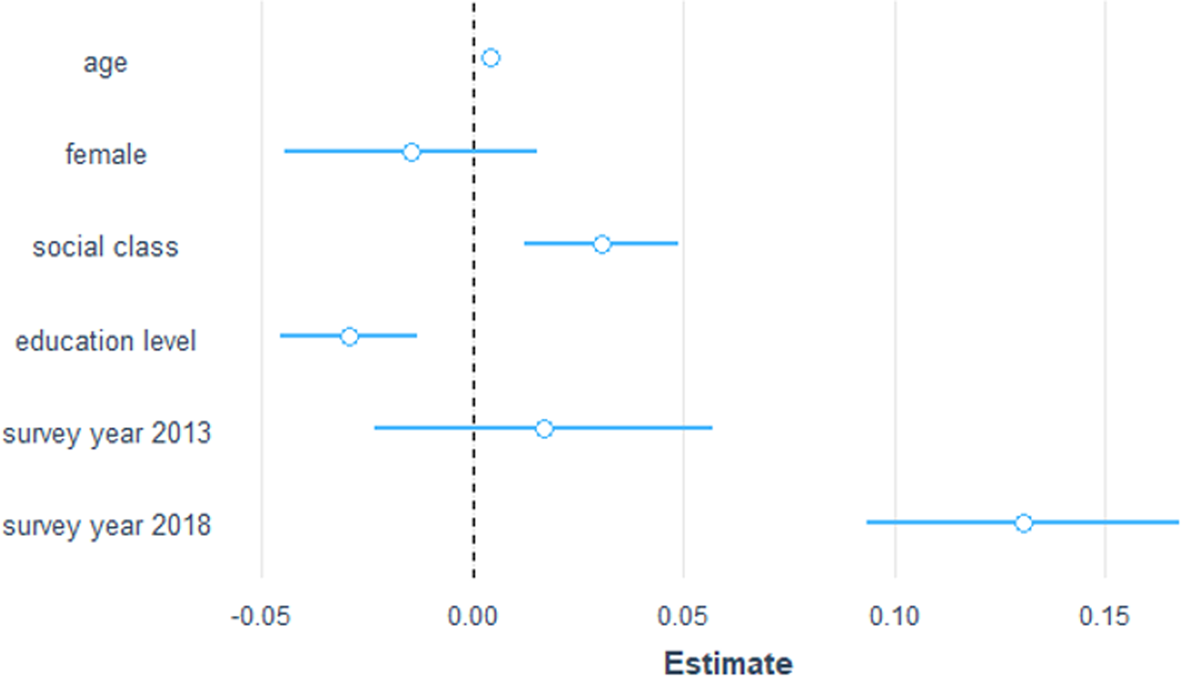
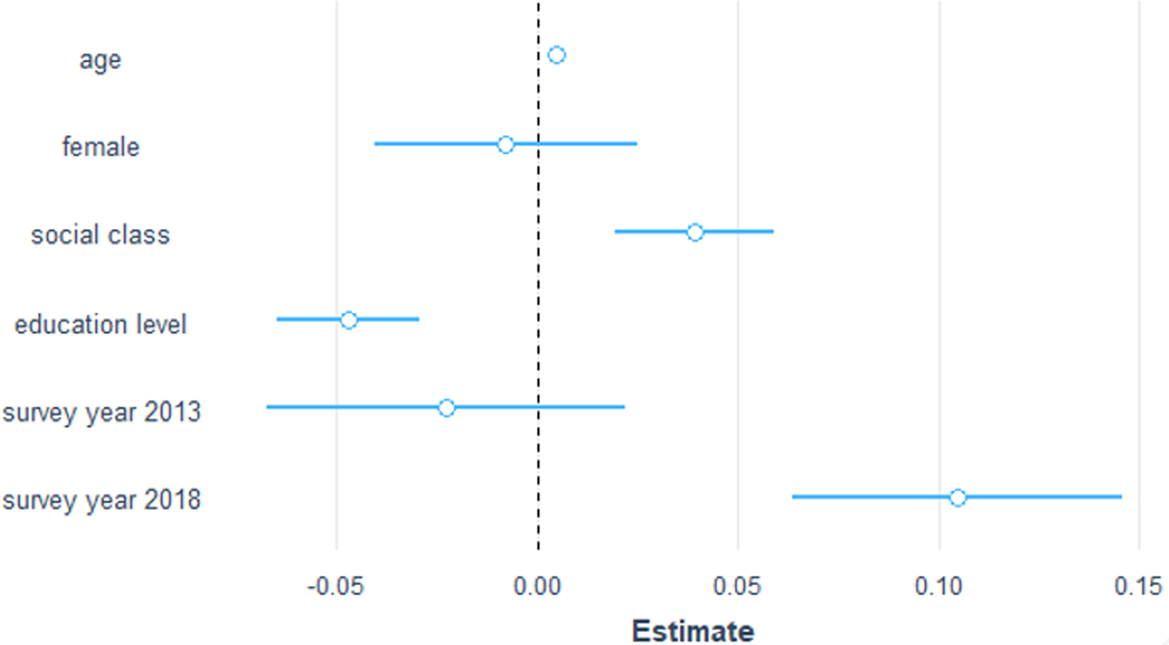
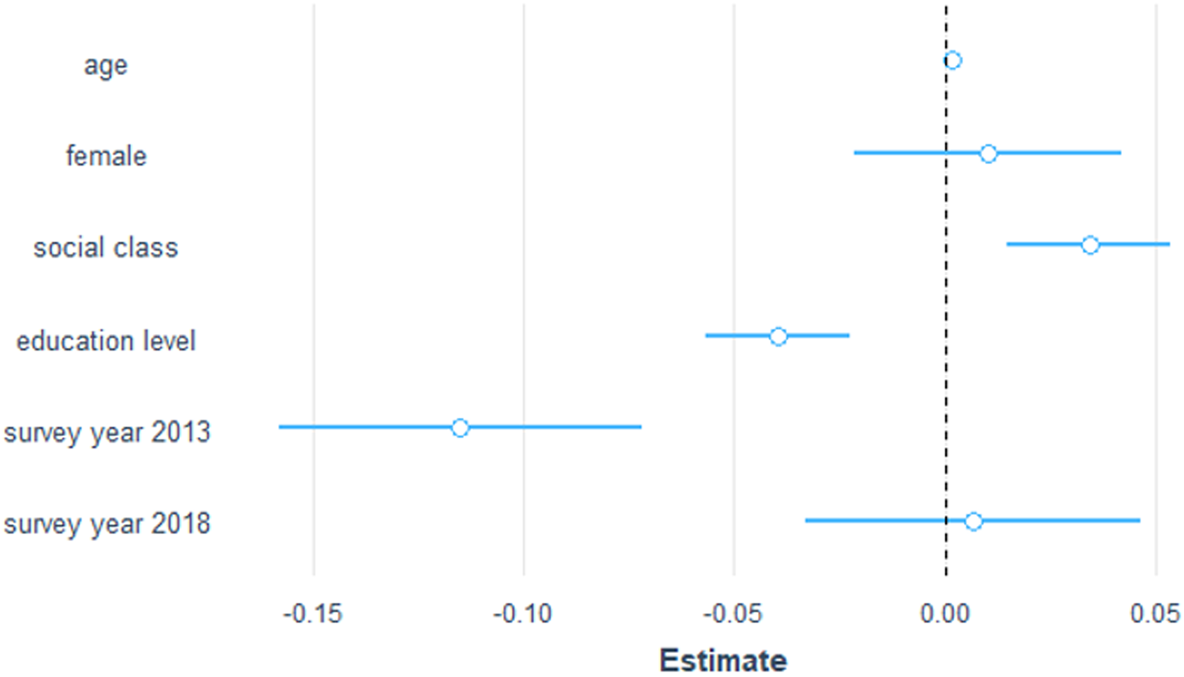
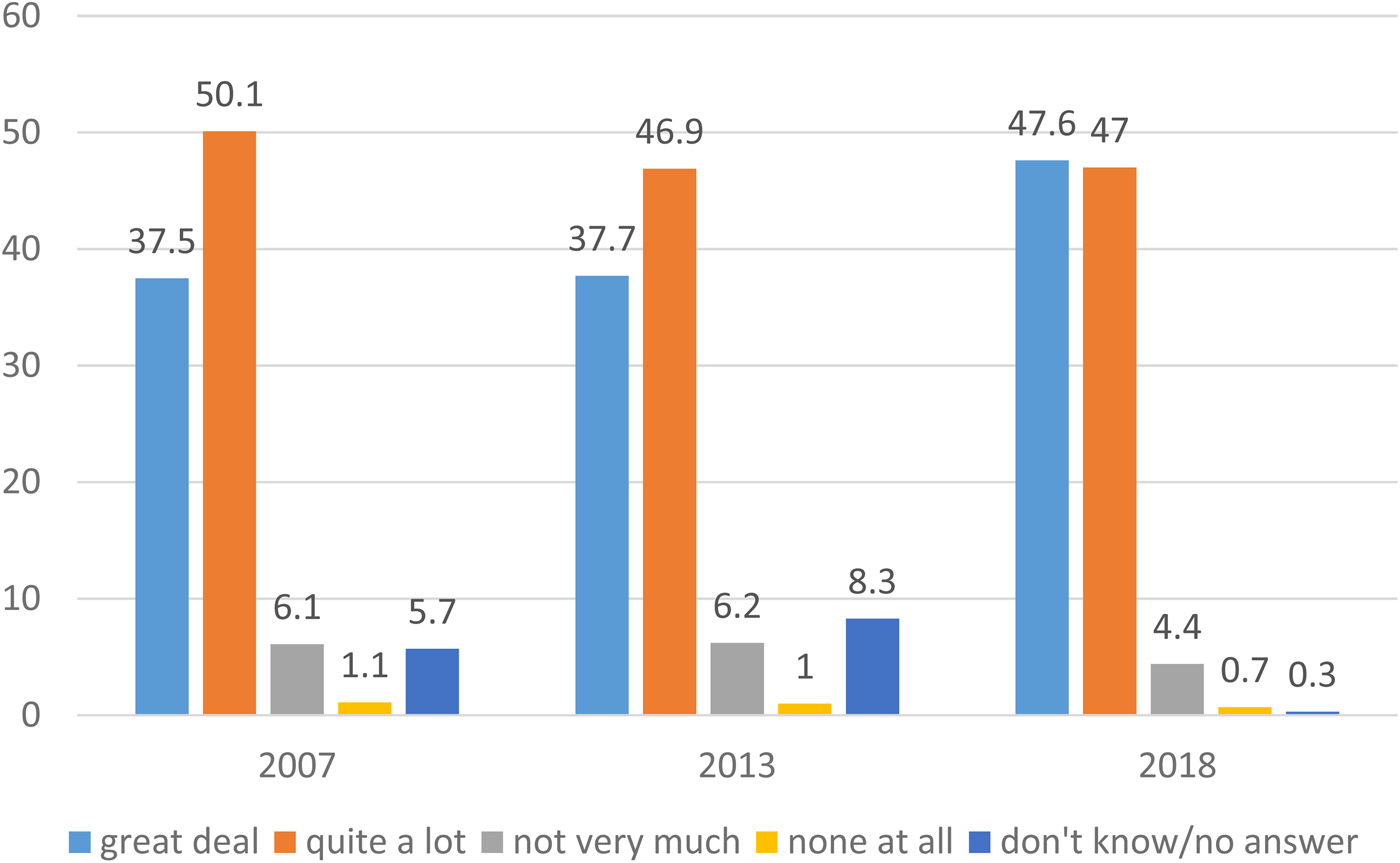
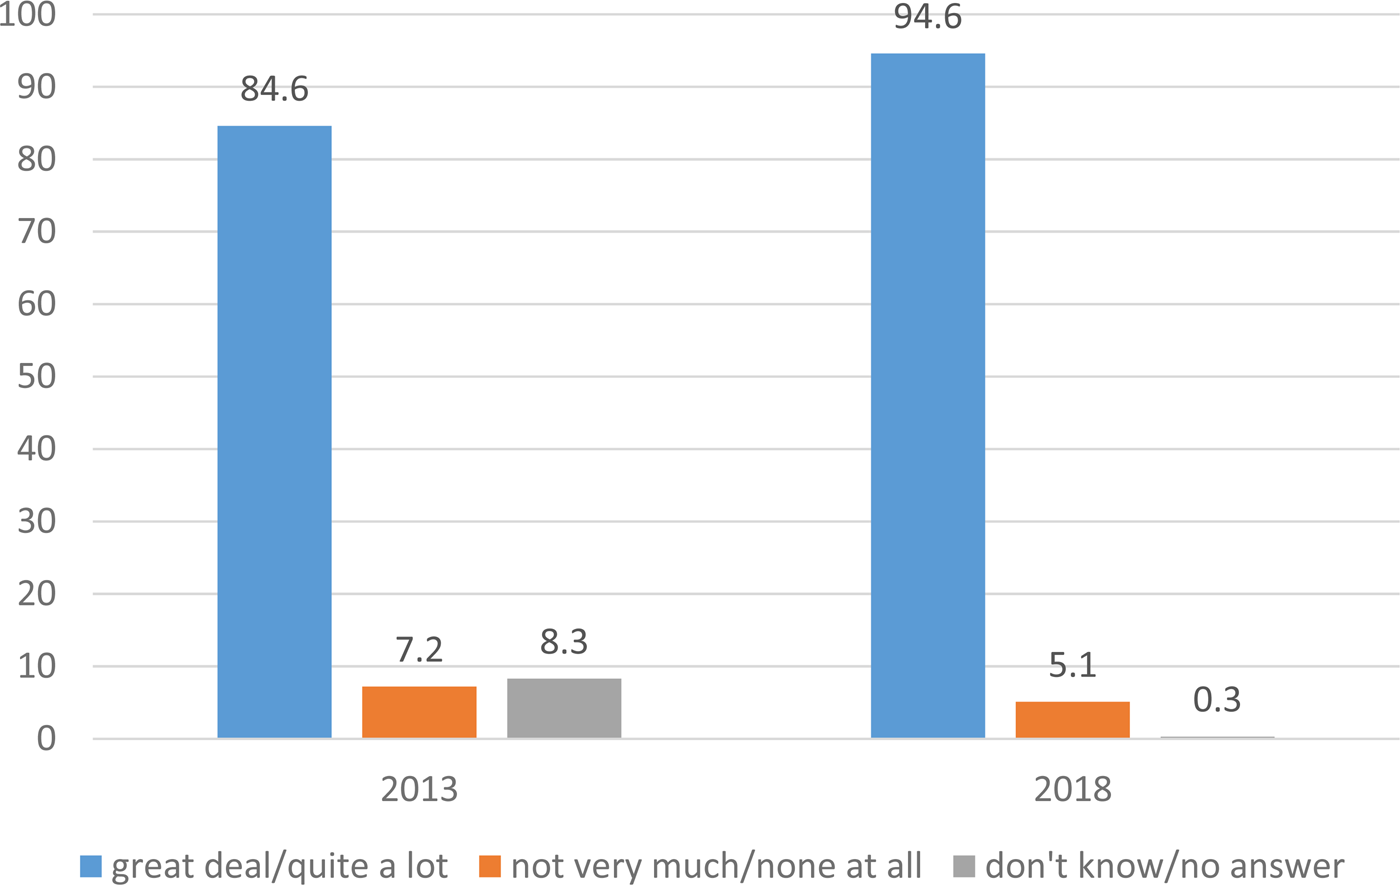
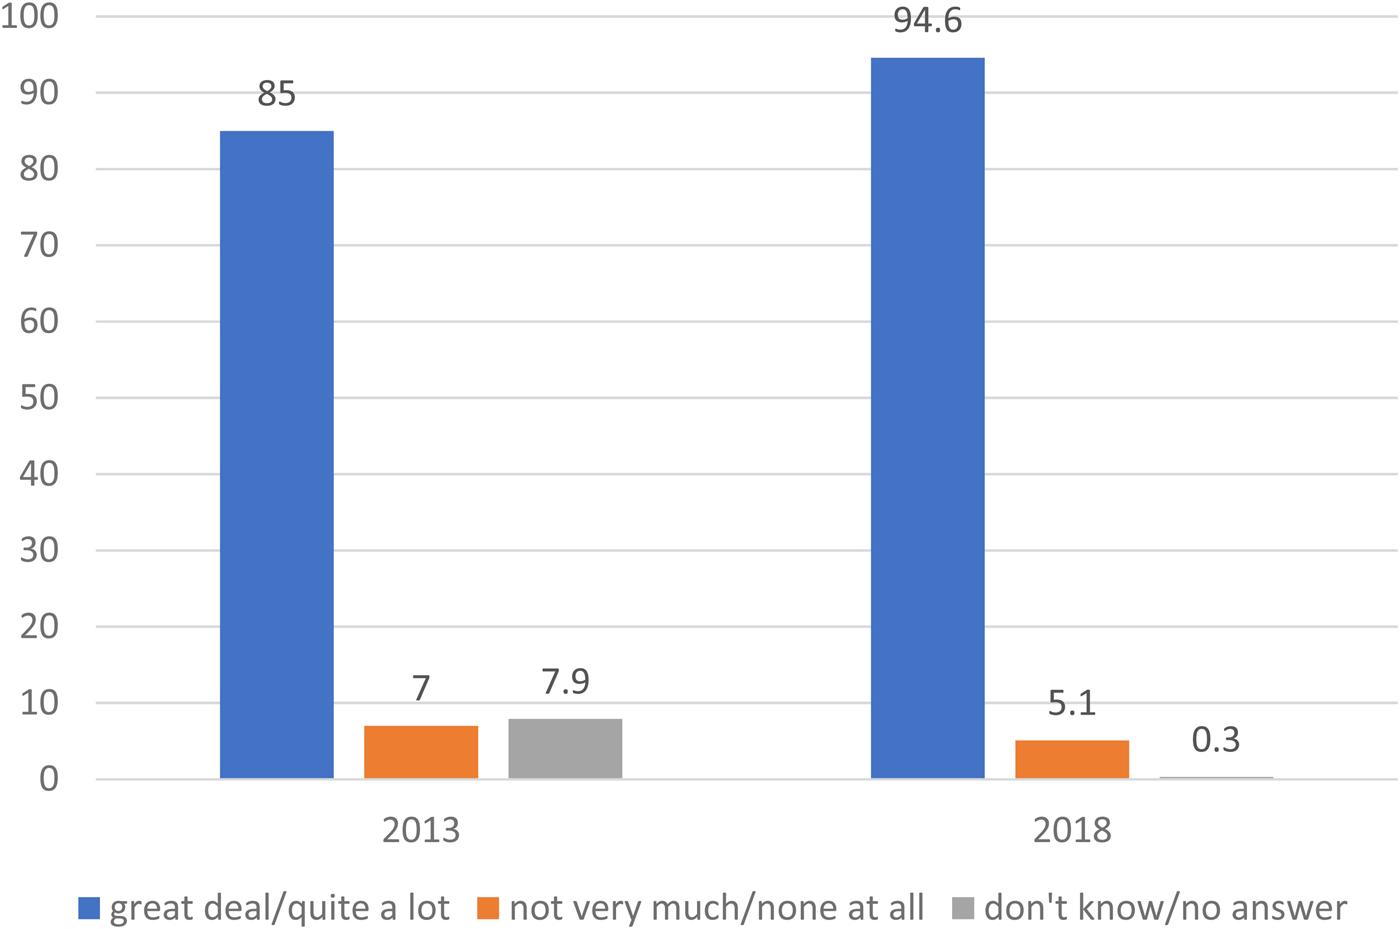
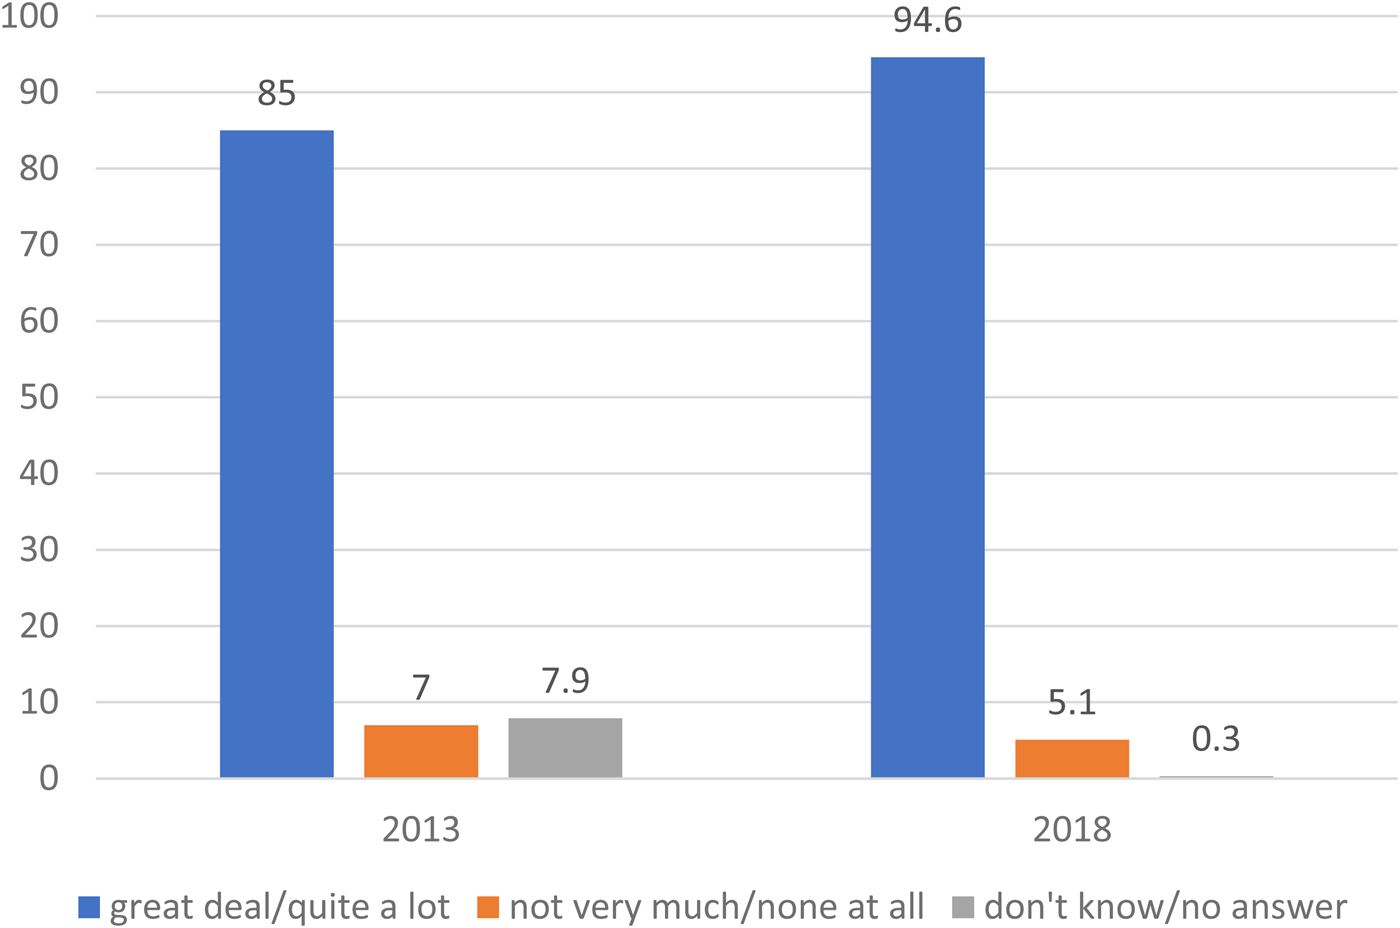
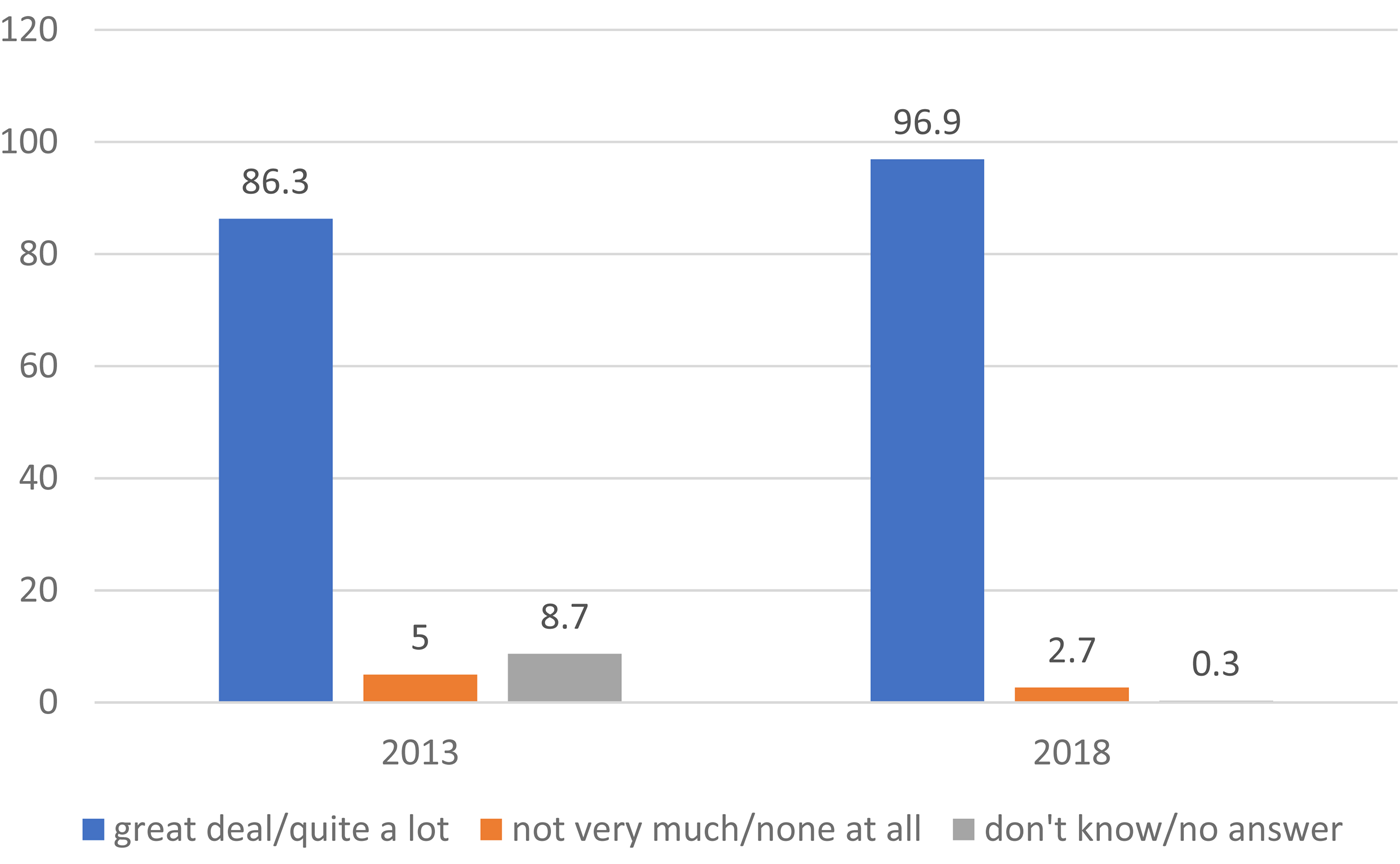
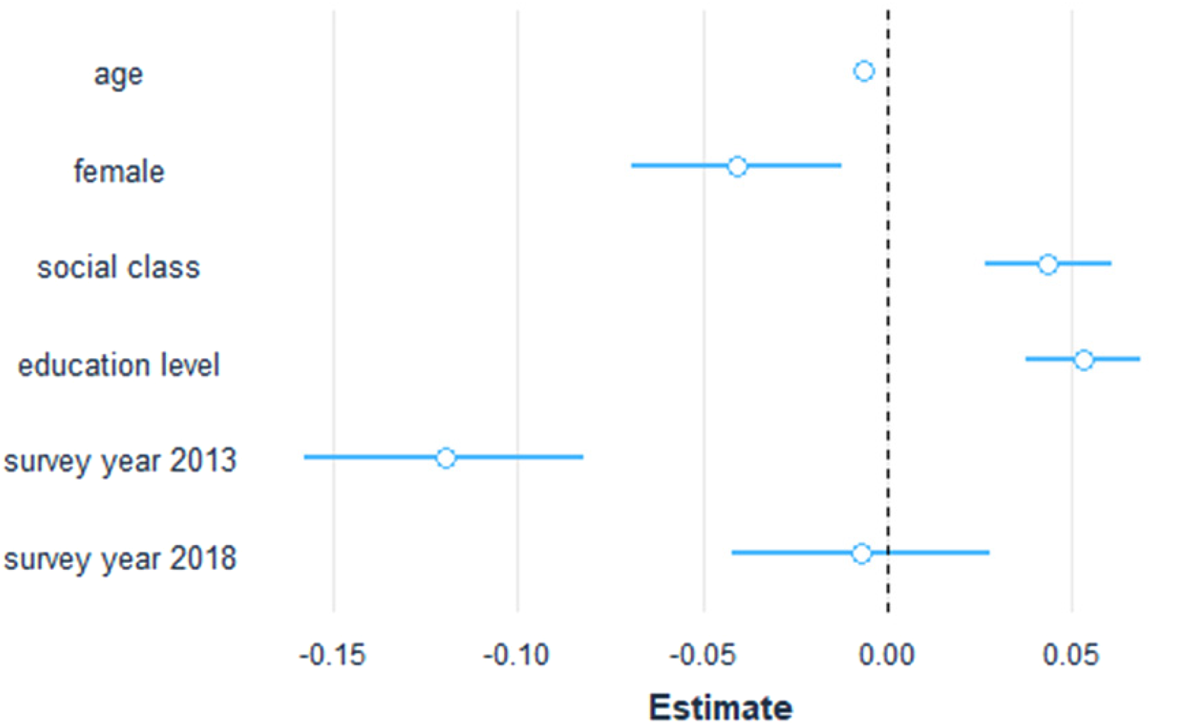
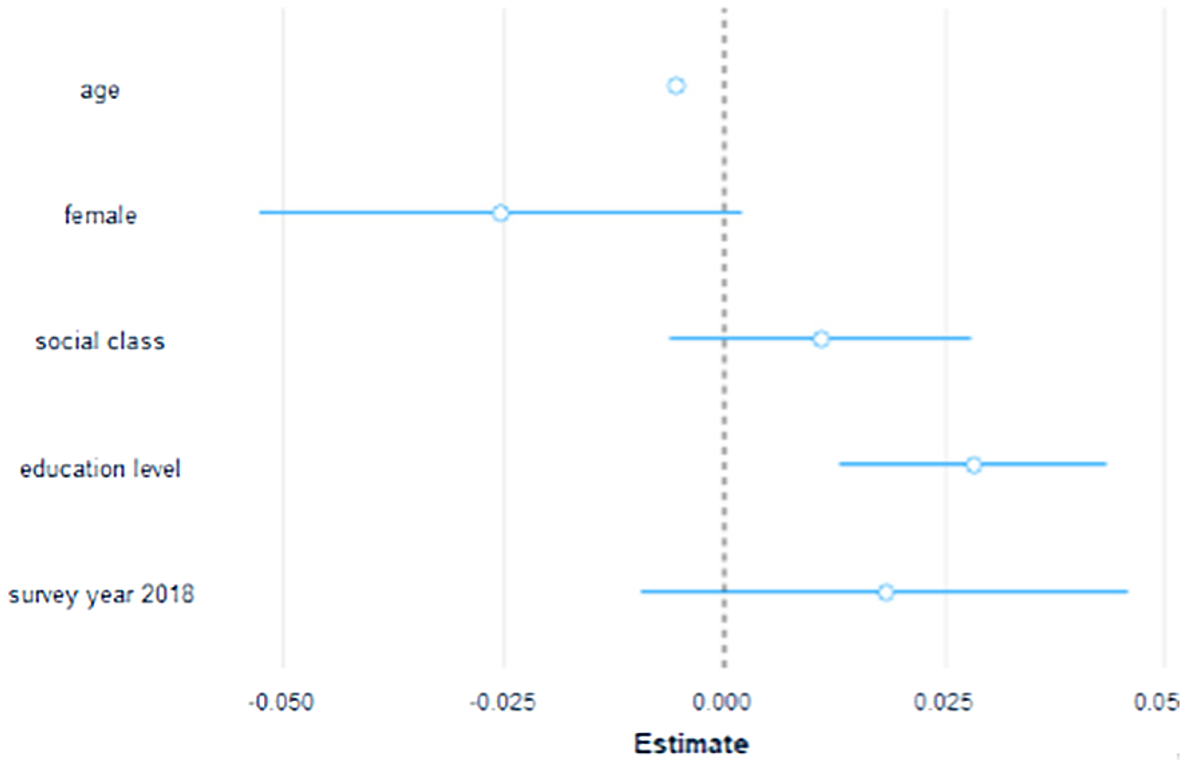
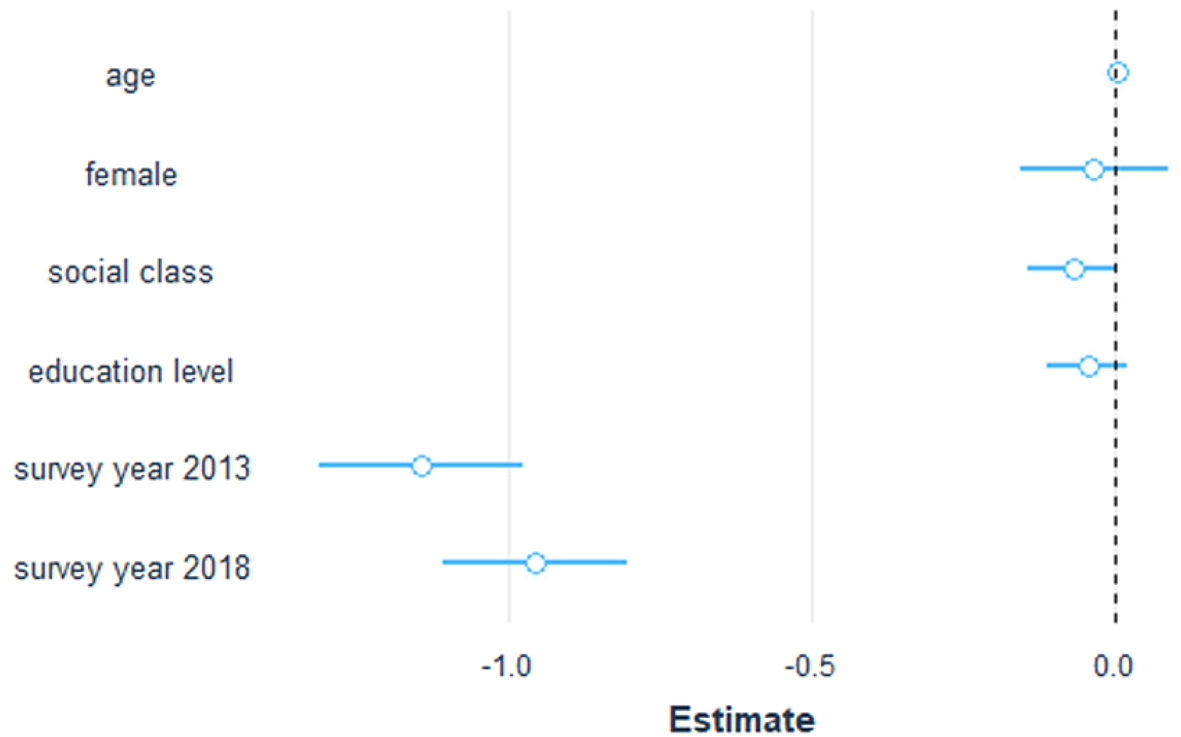
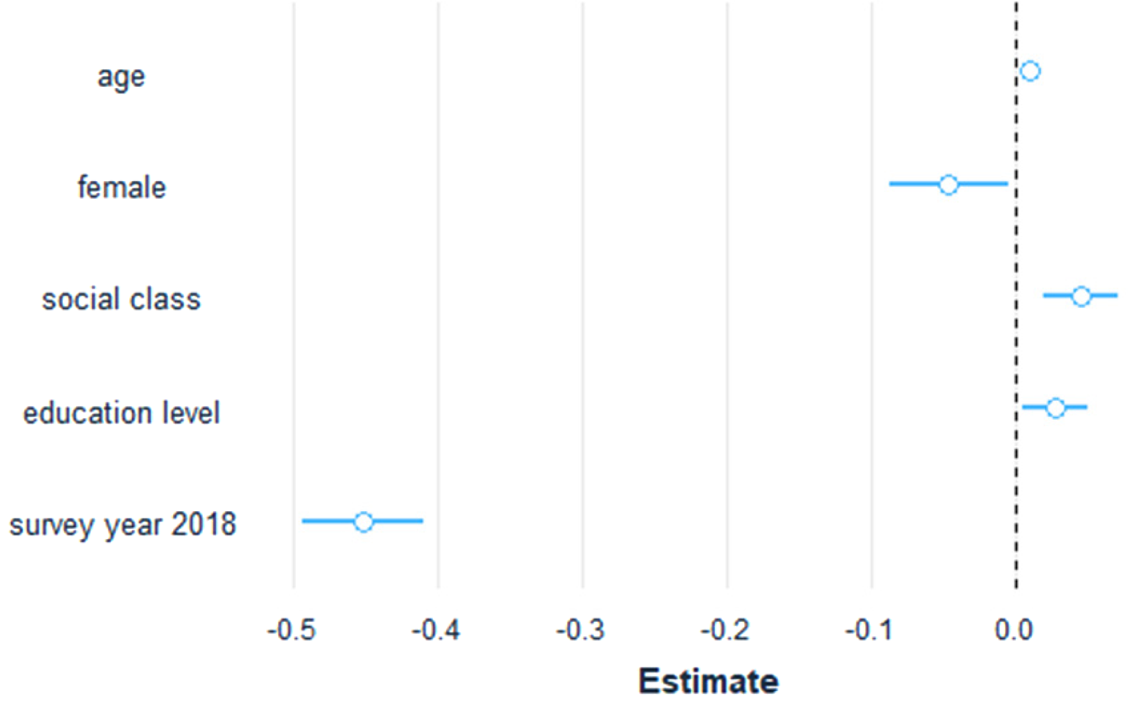
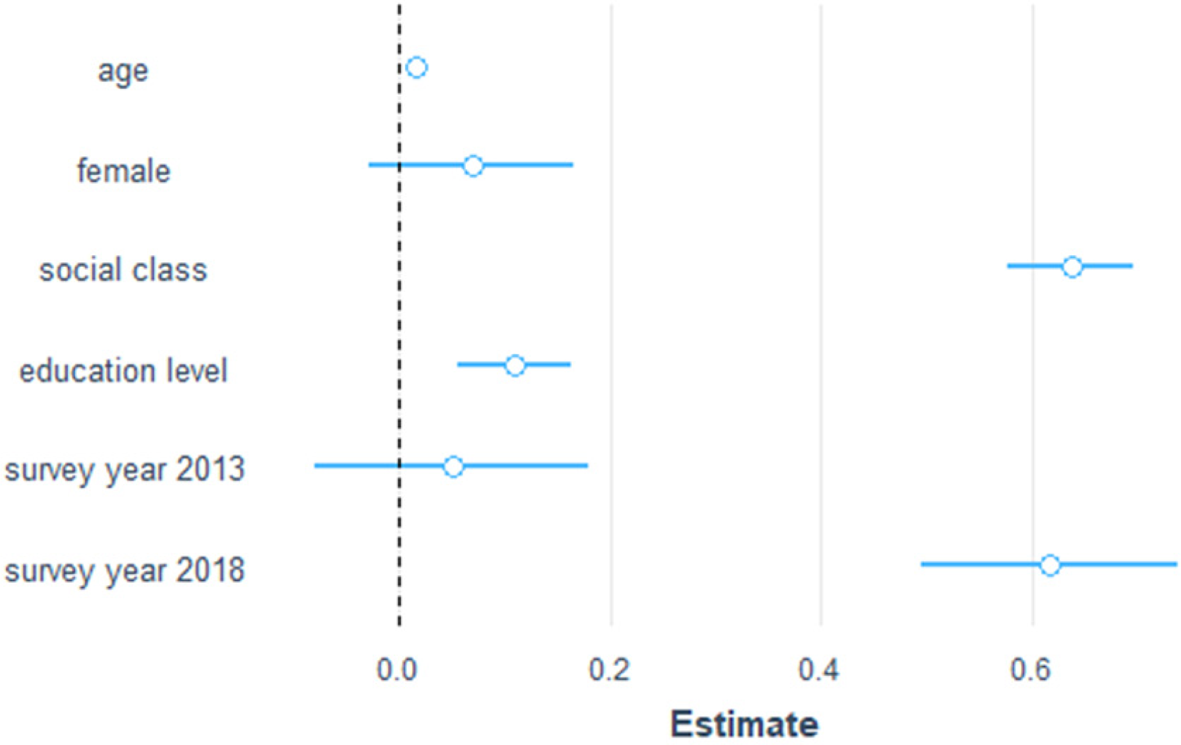
Charts 1–3 show the effect of demographic characteristics on trust in various government institutions. Each question asks the respondents how much trust they have in the specified organization. They can respond with 1 – a great deal; 2 – quite a lot; 3 – not very much; or 4 – none at all. The coding is again reversed in the model so increasing values mean increasing trust. From 2013 to 2018, there is strong evidence of an increase in trust in the government, including the Chinese Communist Party (CCP) and the National People's Congress (NPC) (Chart 4). In contrast, there is a decrease in trust in the NPC from 2007 to 2013 (Chart 5). Across the three government indicators, age is significantly correlated with increase in trust (Charts 6–9). People with higher socioeconomic status and lower education levels (controlling for other demographic characteristics) also have higher trust in government.
OLS Results – Trust in Central Government

OLS Results – Trust in Party

OLS Results – Trust in NPC

Trust in Central Government, Waves 5, 6 and 7

Trust in Central Government, Waves 6 and 7, Positive and Negative Responses Combined

Trust in Central Government, Ages 18–29, Waves 6 and 7, Positive and Negative Responses Combined

Trust in Central Government, Ages 30–49, Waves 6 and 7, Positive and Negative Responses Combined

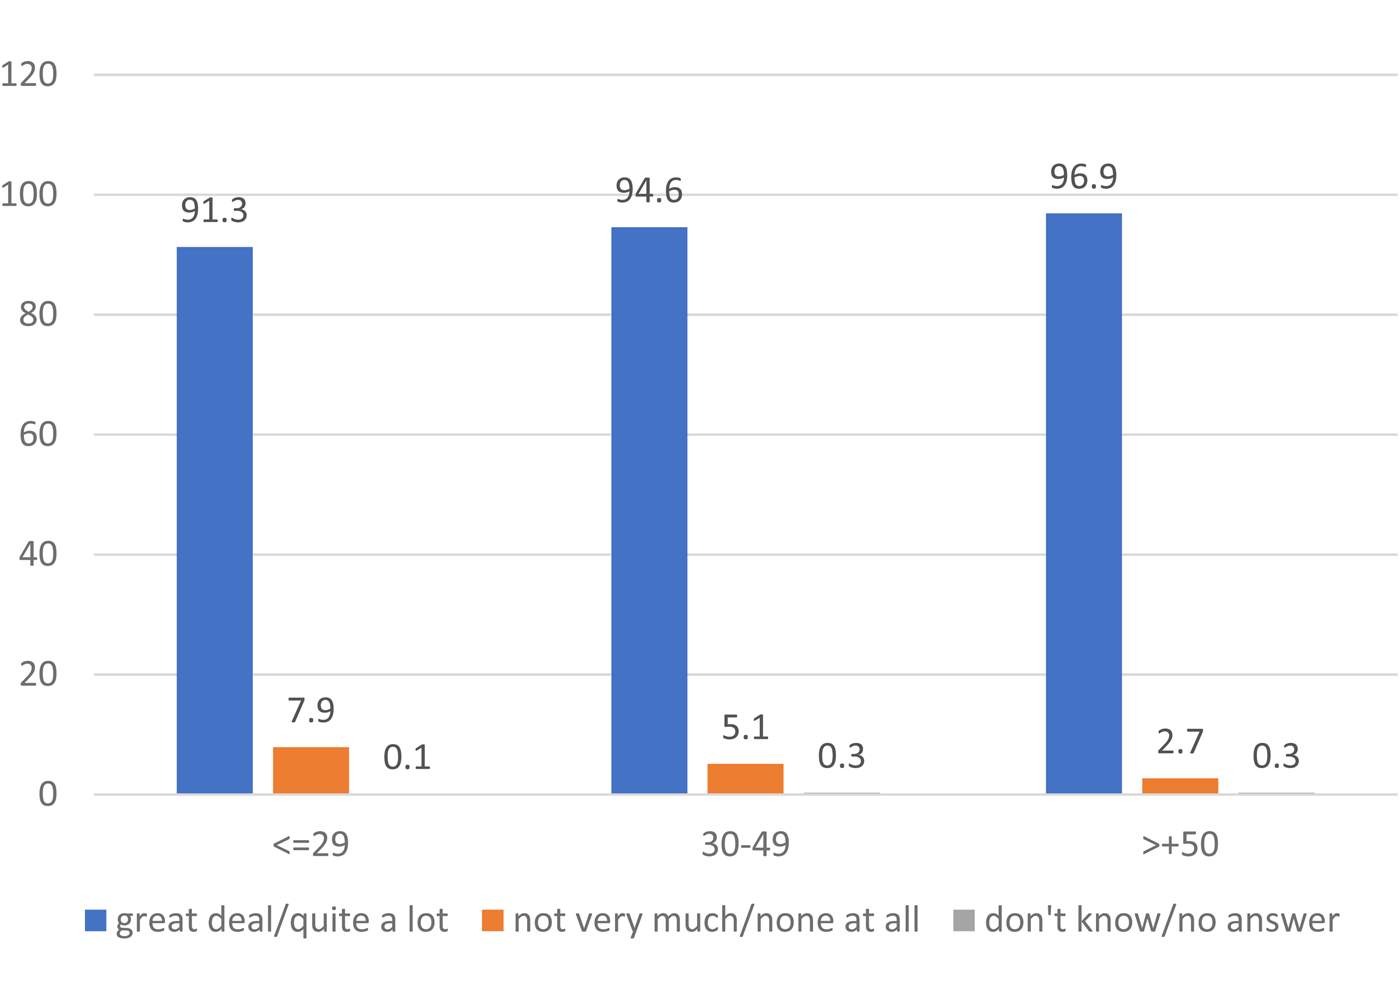
Trust in Central Government, Ages 50+, Waves 6 and 7, Positive and Negative Responses Combined

Trust in Central Government by Age, Wave 7, Positive and Negative Responses Combined

Activism
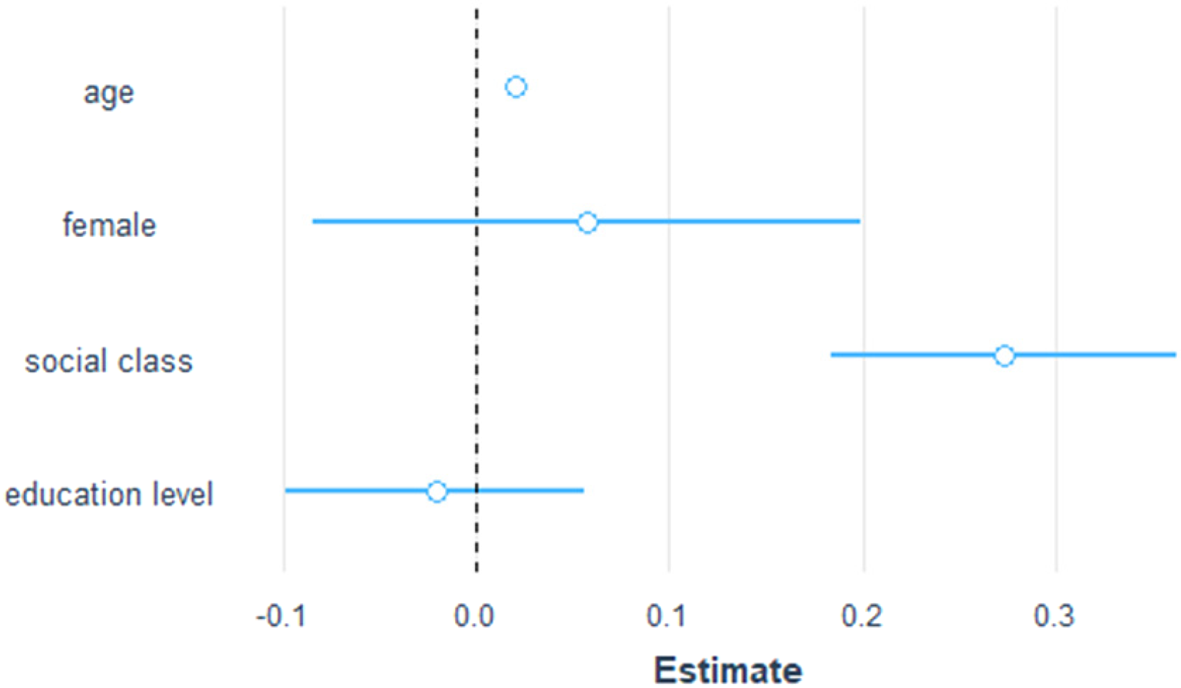
We also analyse the WVS survey data to see trends in activism and discern the relationship between activism and political trust. A personal proclivity towards activism is represented by questions that ask about petitions and peaceful demonstrations/marches (heping shiwei huodong sanbu/youxing 和平示威活动 散步/游行). Respondents are asked whether they: 3 – would never do; 2 – might do; and 1 – have done the specified action. The model reversed the coding, so a higher value means greater willingness to engage in activism. Although a respondent's selection of option 1 (“have done”) suggests that they have engaged in such an act, it is not possible to definitively state that a rise in respondents making this choice signals an actual increase in this form of activism. Peaceful demonstrations were asked about only in Waves 6 and 7; thus, there is only one model included (Charts 11–12). The data show some indications of an increased individual proclivity towards activism from 2013 to 2018, since the coefficient is positive for the models with Wave 6 and 7 data (see Appendix). However, the relationship is significant only for petitions (Chart 10). Unlike trust in government, age is significant and negatively correlated with both forms of action – younger respondents are more likely to report a proclivity to participate in petitions and demonstrations (see also Chart 12). Both higher social class and education are significant and positively correlated with activism.
OLS Results – Sign a Petition

OLS Results – Peaceful Demonstration

Proclivity to Attend Peaceful Demonstrations, Wave 7, by Age

Elections
To gauge trends in support for and participation in elections as related to political trust and satisfaction, we examine two WVS questions. First, we look at support for elections through a WVS question asking respondents to rate “how essential” “free elections” are to “democracy.” The Mandarin term for “democracy” used in the question is minzhu 民主, which translates literally as “people rule” or “people's rights.” It must not be assumed that respondents equate minzhu with liberal democracy. Indeed, in three national surveys of Chinese citizens, Peng Hu finds most respondents understood democracy as “political participation in order to ensure government accountability.”Footnote 6 Regardless of how WVS respondents think of minzhu, we expect most view it as a positive or desirable attribute of governance. Among the array of questions included under “democracy,” we chose one typically seen as a basic characteristic of liberal democracy: “People choose their leaders in free elections.” However, this question does not tell us why a respondent believes “free elections” are essential to “democracy.” In line with the literal meaning of minzhu and the surveys referenced above, Chinese respondents are likely to view elections more as a means to hold officials accountable rather than as a liberal democratic mechanism for popular representation. In the WVS survey, respondents answer on a scale of 1–10, where 1 is “not at all” an essential characteristic of democracy and 10 is “definitely” an essential characteristic of democracy. Overall, the data show a slight increase in support for “people choosing their leaders in free elections” from 2013 to 2018 (Chart 13). As discussed below, this coincides with increased trust in the NPC and a greater individual proclivity towards activism over the same period.
OLS Results – Elections as an Essential Characteristic of Democracy

To assess the public's actual participation in elections, we look at the WVS question asking if, in previous local elections, respondents “always,” “usually” or “never” voted. Wave 7 data had an extra category of “not allowed to vote,” which was re-coded as “never” to match the other two waves. The data show a decrease in reported participation in local elections from 2013 to 2018 (Chart 14). Interestingly, this is the case even while, over the same period, support for free elections, proclivity towards activism and political trust increased. This suggests actual participation in local elections is not a key contributor to perceptions of regime legitimacy.
OLS Results – Participation in Local Elections

Corruption
To assess how ideational considerations such as “clean” or “trustworthy” politicians may relate to regime legitimacy, we use the WVS data to explore the relationships among perceptions of corruption, proclivity towards activism and political satisfaction. Wave 7 includes newly added questions on corruption that are explored in the OLS results below. As seen in the results, individuals who are younger, male, come from a lower social class and have higher education levels report a higher perception of local corruption. The model with central corruption shows similar but less significant results. This is consistent with existing research findings that corruption at the local level is seen as more pervasive and serious than corruption at the centre. Comparing perceptions of local corruption with responses on satisfaction with political system performance, the results show that for each demographic variable, the sign is the opposite (Charts 15–16). In other words, respondents who perceive greater corruption are less satisfied with political system performance.
OLS Results – Perceptions of Local Authority Involvement in Corruption

OLS Results – Satisfaction with Political System Performance

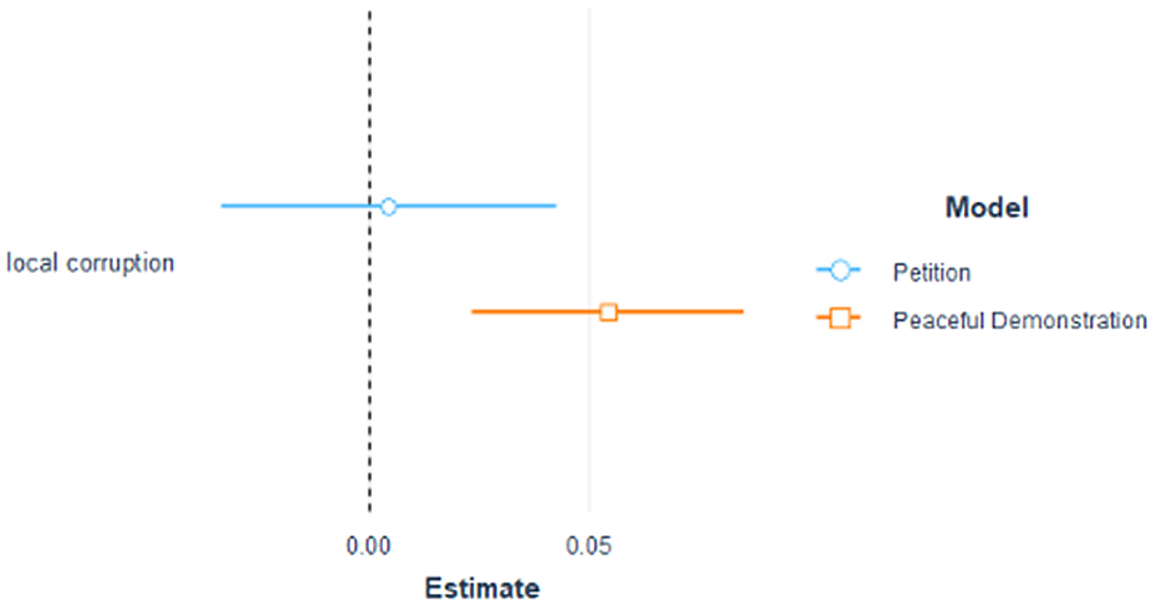
We also examine how perceptions of corruption relate to activism (Chart 17). The results show that a greater perception of corruption is significantly and positively correlated with a proclivity to participate in peaceful demonstrations, indicating that seeing corruption may push Chinese citizens to engage in this form of action. At the same time, submitting petitions is not significantly correlated with perceptions of local corruption, perhaps because petitions are expected to first be submitted to local “letters and visits” (xinfang 信访) offices. As discussed below, these findings may have important implications for future regime stability under Xi; to the extent that citizens see peaceful demonstrations as their only recourse in addressing government corruption, and citizens perceiving greater corruption express less political satisfaction, constraints on people's ability to engage in peaceful demonstrations are likely to negatively impact views of regime legitimacy.
OLS Results – Local Corruption Perception Effect on Activism

Happiness and life satisfaction
Given common assumptions that the legitimacy of the Chinese regime is partly (or largely) based on economic growth, we might expect that Chinese citizens judge the effectiveness of the government in relation to their own happiness and life satisfaction. At the same time, it may be the case that people's feelings of happiness and life satisfaction are impacted by their perception of the prevalence of political corruption and general “fairness” in society. Recognizing this, we look at happiness and life satisfaction questions in the WVS surveys and examine how these perceptions relate to political trust. The “feeling of happiness” question asks respondent to rate their happiness from: 1 – very happy; 2 – quite happy; 3 – not very happy; and 4 – not at all happy. The model reverses the coding, such that a higher score denotes greater reported happiness. “Satisfaction with your life” is answered on a scale of 1 to 10, with 1 being completely dissatisfied and 10 being completely satisfied.
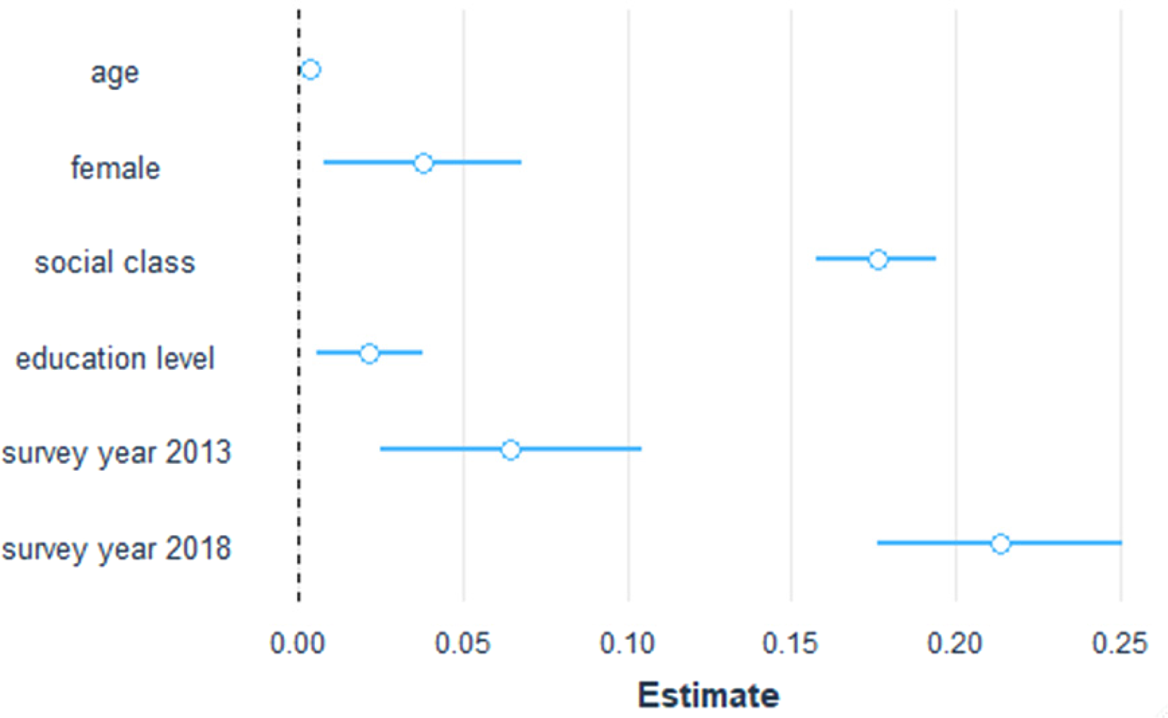
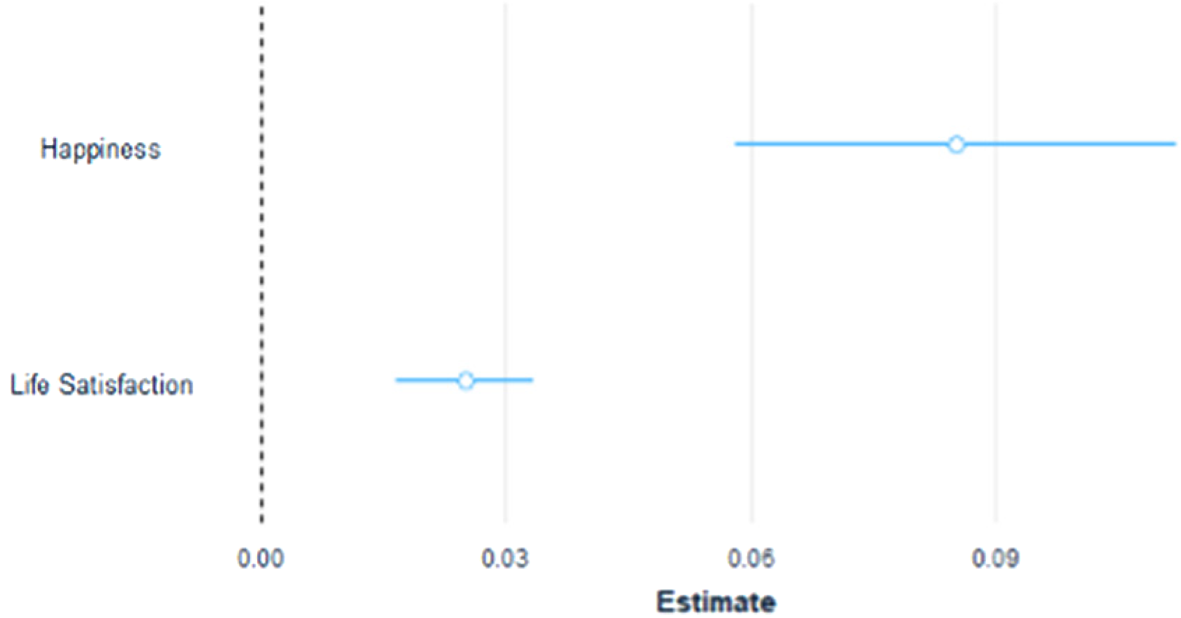
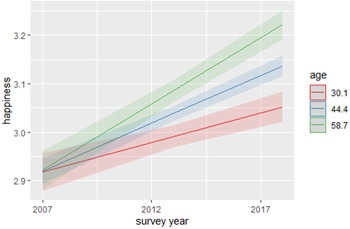
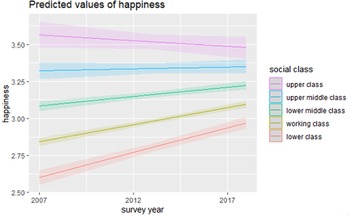
The increase in happiness and life satisfaction from 2007 to 2018 and from 2013 to 2018 is statistically significant (Charts 18–19). Further, in the data we see that, indeed, happiness and life satisfaction are significant positive predictors for trust in the central government (Chart 20). To explore the change in happiness and life satisfaction over the three survey waves, we also look at the interaction effect between the survey years and age (Chart 21). The results show a slight divergence between older and younger age groups, with older generations reporting a greater increase in happiness relative to younger generations. We also look at the interaction effect with social class, finding that “upper class” respondents report a slight decrease in happiness while those in all other classes report an increase across the years. Further, the increase in happiness is greater for each descending class, with the “lower class” reporting the highest increase in happiness among all classes (Chart 22).
OLS Results – Happiness

OLS Results – Life Satisfaction

Effect of Happiness and Life Satisfaction on Trust in Central Government with Controls

Interaction Effect of Age and Survey Year on Happiness

Interaction Effect of Social Class and Survey Year on Happiness

Discussion
WVS respondents report greater happiness, life satisfaction and trust in China's CCP-led government five years into the Xi Jinping administration than they did when Xi assumed the party-state's top posts. This would seem to be good news for both Xi Jinping and CCP rule: at least as of 2018, the system's effectiveness and legitimacy were not diminishing in the eyes of the Chinese public and, in fact, had improved relative to the last five years of the Hu Jintao administration. Yet the WVS data also reveal new aspects of regime legitimacy and point to potential sources of diminished political trust and satisfaction in the Xi era.
Exemplifying the complexity of citizen attitudes are the WVS findings regarding elections. Between Wave 6 (2012–2013) and Wave 7 (2018), the data show a slight increase in the view that “people choosing their leaders in free elections” is an essential characteristic of democracy (minzhu). Over the same span of time, we see a decrease in respondents reporting having participated in local elections. These findings present something of a puzzle, as they coincide with greater reported trust in government during Xi Jinping's first five years at the party-state helm. This conundrum underscores Bruce Dickson, Mingming Shen and Jie Yan's point that various factors simultaneously contribute to and detract from perceptions of regime legitimacy, and that legitimacy is not something that “is” or “is not” present at a particular time and place.Footnote 7 It also may be that Chinese citizens do not view participating in local elections as being as crucial as having the right to choose leaders in free elections, particularly if the main value of elections is to hold political leaders accountable (rather than to ensure popular representation).
Further complicating matters are fluctuations in reported personal proclivity towards activism in the form of petitions and peaceful demonstrations. The WVS data show an overall decline in the proclivity to engage in these types of activism between Wave 5 (2007) and Wave 6 (2012–2013), but a rise between Wave 6 and Wave 7 (2018). This seems to fly in the face of notions that Chinese citizens have become more fearful and docile as a result of Xi's authoritarian turn. Also, as discussed in more detail below, it is interesting that these trends coincide with findings in the Wave 7 survey, which was administered five years into Xi's anti-corruption campaign, that greater perceptions of local corruption correlate with greater openness to activism. This suggests citizens frustrated with corruption are not resigned to its perpetuation and feel some hope that their activism can lead to the punishment of the system's “bad apples.”
Meanwhile, demographic variations reveal dynamics lying beneath the general trends in overall responses. For example, younger, more educated and wealthier respondents express a greater proclivity to engage in activism, and especially peaceful demonstrations. Given evidence that wealthier and more educated Chinese citizens are more likely to have their protest demands met, this finding may not be surprising.Footnote 8 Yet it also suggests that China's political system is perceived to be responsive by at least some key demographic groups.
Younger Chinese have reason to be less satisfied. Younger citizens holding rural hukou 户口 (household registration) are largely employed as wage labourers in China's urban areas, working incredibly long hours in barely human conditions, with little hope of saving enough to live a decent life in the city, where – unlike earlier generations of rural migrant workers – most strongly prefer to reside.Footnote 9 Simultaneously, younger urban hukou-holders with a university degree face an extremely competitive job market with a shortage of jobs commensurate with their educational level and, unlike their parents who may live in a valuable urban flat purchased with cash when China's urban housing was privatized in the late 1990s, they typically cannot afford desirable urban housing on their own.
The data also reveal demographic variations in the interaction among popular views of activism, local corruption and satisfaction with political system performance. In the 2018 survey, respondents who are younger, male, come from a lower social class and have higher education levels reported higher perceptions of local corruption. Moreover, the 2018 data suggest that these groups are more likely to participate in peaceful demonstrations and are less satisfied with the political system. These complex dynamics regarding political engagement and views of corruption may not bode well for the regime should constraints on popular demonstrations continue or increase.
Meanwhile, we find a greater reported increase in happiness among older people relative to younger respondents from Wave 6 to Wave 7. We also see increased happiness among all classes apart from those identifying as “upper class,” with the rise in happiness becoming more prominent with each descending class. Altogether, older and poorer citizens show the greatest increase in happiness over the course of Xi's first term.
Given these findings, what might the regime do to promote regime legitimacy? Policies that appear to have been appreciated by the public, such as anti-corruption efforts, poverty reduction and environmental resuscitation, should be continued and expanded. Simultaneously, greater attention should be paid to promoting socioeconomic mobility and life satisfaction among China's younger citizens. Meanwhile, freedom of protest and expression should not be viewed as a threat but rather as a means to bolster political trust through increasing citizens’ ideal commitment to the system. In short, Xi and his comrades would be well advised to recognize that despite overall positive indicators in public opinion, political legitimacy is complex and fluid. Scholars, meanwhile, are encouraged to further probe how developments since 2018 (such as the campaign to eradicate urban poverty, the regulation reforms begun in 2021 and responses to protests related to COVID lockdowns and frozen bank deposits) have influenced popular political attitudes. We look forward to the publication of the next wave of WVS data to help illuminate changes and continuities during Xi's second five-year term.
Acknowledgements
We are grateful to the participants in our American Political Science Association panel and anonymous reviewers for their helpful comments and recommendations.
Competing interests
None.
Dora HU received a master's in political science from the University of California San Diego and is interested in Chinese politics and economics.
Teresa WRIGHT is a professor of political science at California State University Long Beach. She writes on state–society relations, protest and dissent, and governance in China.
Appendix
Reference survey questions in Wave 7
H_URBRURAL: Urban–Rural
Urban–Rural Settlement type
1 – Urban; 2 – Rural
Q46: Feeling of happiness
All things considered, would you say you are:
(Jiang suoyou de qingkuang dou kaolü jinlai,muqian nin shenghuo de yukuai ma? 将所有的情况都考虑进来,目前您生活得愉快么?)
1 – very happy; 2 – quite happy; 3 – not very happy; 4 – not at all happy
Q49: Satisfaction with your life
All things considered, how satisfied are you with your life as a whole these days?
(Ba suoyou de qingkuang dou kaolü jinqu, zongde laishuo nin dui ziji muqian de shenghuo manyi ma? 把所有的情况都考虑进去, 总的来说, 您对自己目前的生活满意吗?)
10 – completely satisfied; 1 – completely dissatisfied
Q71: Trust: the government
(Zhongyang zhengfu 中央政府)
Q72: Trust: the political parties
(Zhengdang 政党)
Q73: Trust: parliament
(Renmin daibiao dahui 人民代表大会)
I am going to name a number of organizations. For each one, could you tell me how much trust you have in them: is it a great deal of trust, quite a lot of trust, not very much trust or none at all? (Nin dui xiamian zhexie zuzhi de xinrendu ruhe? Shi feichang xinren, xinren, butai xinren, haishi henbu xinren? 您对下面这些组织的信任度如何?是非常信任、信任、不太信任还是很不信任?)
1 – a great deal; 2 – quite a lot; 3 – not very much; 4 – none at all
Q209: Political action: signing a petition
(Zai qingyuanshu shang qianming 在请愿书上签名)
Q210: Political action: joining in boycotts
(Canjia dizhi xingdong 参加抵制行动)
Q211: Political action: attending peaceful demonstrations
(Canjia heping shiwei huodong (sanbu/youxing) 参加和平示威活动(散步/游行))
Now, I'd like you to look at this card. I'm going to read out some different forms of political action that people can take, and I'd like you to tell me, for each one, whether you have actually done any of these things, whether you might do it or would never, under any circumstances, do it.
(Renmen keneng caiqu butong de xingdong biaoda ziji de yiyuan, qingwen nin shifou canjia guo xialie huodong, ruguo meiyou canjia guo, nin shi you keneng canjia, haishi zai renhe qingkuang xia dou buhui canjia? 人们可能采取不同的行动表达自己的意愿,请问您是否参加过下列活动,如果没有参加过,您是有可能参加,还是在任何情况下都不会参加?)
1 – have done; 2 – might do; 3 – would never do
Q241: Democracy: governments tax the rich and subsidize the poor
(Zhengfu xiang furen shoushui butie qiongren 政府向富人收税补贴穷人)
Q243: Democracy: people choose their leaders in free elections
(Renmen tongguo ziyou xuanju lai xuanze lingdaoren 人们通过自由选举来选择领导人)
Q247: Democracy: the state makes people's incomes equal
(Guojia rang jumin shouru pingdeng 国家让居民收入平等)
Please tell me for each of the following things, how essential you think it is as a characteristic of democracy. Use this scale where 1 means “not at all an essential characteristic of democracy” and 10 means it definitely is “an essential characteristic of democracy.
(Minzhu baokuo henduo neirong, dan qizhong zhiyou yixie shi zui jiben de. Zai nin kanlai, xialie gexiang neirong shibushi minzhu de zui jiben yaosu? Zhege liangbiao zhong, 1 biaoshi zhexiang neirong bushi minzhu de jiben yaosu, 10 biaoshi shi minzhu de jiben yaosu. Qingzai liangbiao shang biaochu nin de kanfa 民主包括很多内容,但其中只有一些是最基本的。在您看来,下列各项内容是不是民主的最基本要素?这个量表中,1 表示这项内容不是民主的基本要素,10 表示是民主的基本要素。请在量表上标出您的看法。)
0 – it is against democracy (spontaneous); 1 – not an essential characteristic of democracy; 10 – an essential characteristic of democracy
Q260: Sex
Respondent's sex
(Shoufangren xingbie 受访人性别)
1 – male; 2 – female
Q262: Age
This means you are XX years old?
(Na jiu yiwei zhe nin jinnian XX zhousui 那就意味着您今年XX周岁)
Q275: Highest educational level
What is the highest educational level that you, your significant other and your parents have attained?
(Qingwen nin, nin peiou, yiji nin fumuqin de xueli fenbie shi shenme? 请问您、您配偶,以及您父母亲的学历分别是什么?)
0 – early childhood education (ISCED 0) / no education; 1 – primary education (ISCED 1); 2 – lower secondary education (ISCED 2); 3 – upper secondary education (ISCED 3); 4 – post-secondary non-tertiary education (ISCED 4); 5 – short-cycle tertiary education (ISCED 5); 6 – bachelor's degree or equivalent (ISCED 6); 7 – master's degree or equivalent (ISCED 7); 8 – doctoral degree or equivalent (ISCED 8)
Q287: Social class
People sometimes describe themselves as belonging to the working class, the middle class or the upper or lower class. Would you describe yourself as belonging to the:
(Renmin youshi hui ba ziji huafen dao gaodi butong de jieceng, nin renwei ziji zai shehui shang shuyu na yige jieceng? 人们有时会把自己划分到高低不同的阶层,您认为自己在社会上属于哪一个阶层?)
1 – upper class; 2 – upper-middle class; 3 – lower-middle class; 4 – working class; 5 – lower class