INTRODUCTION
It is generally agreed that the live weight (LW) of animals is an important factor associated with determining feeding levels and the management of veterinary products and animal conditioning.
LW is usually determined on farms by weighing. However, some problems can be encountered during weighing, such as calibration not being accurate, or the device not operating correctly. In addition, animals may be under stress during weighing and can cause damage to both themselves and those around them. Thus, farmers prefer to allocate separate places for weighing, employees and financial operations. In weighing animals, researchers devised barometric methods, based on the correlation between body measurements (BMs) and LW (Eker Reference Eker1958; Negretti et al. Reference Negretti, Bianconi, Bartocci, Terramoccia and Verna2008). To overcome the difficulties posed by biometric examinations, researchers recently developed the use of new measuring instruments such as ultrasound, digital image analysis and thermal cameras (Berger & Miller Reference Berger and Miller2003; Burke et al. Reference Burke, Nuthall and McKinnon2004; Negretti et al. Reference Negretti, Bianconi, Bartocci, Terramoccia and Verna2008; Ozkaya & Bozkurt Reference Ozkaya and Bozkurt2008; Stajnko et al. Reference Stajnko, Brus and Hocevar2008; Tasdemir et al. Reference Tasdemir, Urkmez and Inal2011a,Reference Tasdemir, Urkmez and Inalb). However, ultrasound technology was not found to be beneficial in predicting LW from BMs (Berger & Miller Reference Berger and Miller2003). Studies have shown that image analysis was an effective measuring instrument for the prediction of LW (Negretti et al. Reference Negretti, Bianconi, Bartocci, Terramoccia and Verna2008; Tasdemir et al. Reference Tasdemir, Urkmez and Inal2011a,Reference Tasdemir, Urkmez and Inalb). Ozkaya & Bozkurt (Reference Ozkaya and Bozkurt2008) reported that the prediction ability of digital image analysis was weak when the animals have a large frame like the Holstein. However, Tasdemir et al. (Reference Tasdemir, Urkmez and Inal2011a,Reference Tasdemir, Urkmez and Inalb) indicated that there is a high correlation between LW and BMs that are obtained with digital image analysis on the Holstein cows. There is no information on the predicted LW of calves by using digital image analysis. Therefore, the aim of the current study was to determine LW from BMs, following digital image analysis of female Holstein calves.
MATERIALS AND METHODS
The data for the current study consisted of 41 female Holstein calves at the Research Farm of the Suleyman Demirel University Agricultural Research and Application Center. The calves were weighed using a digital scale (Delta, Istanbul, Turkey). The BMs, described by Ozkaya & Bozkurt (Reference Ozkaya and Bozkurt2008), were measured at birth, at weaning (8 weeks of age) and at 24 weeks of age. All procedures were approved by the Institutional Animal Care and Use Committee.
Measurements of calves
Actual BMs were taken while the animals were standing in a squeeze chute after weighing. The BMs were taken twice for each animal at each time point by the same person and were averaged. The digital scale was checked for accuracy before each weighing. The measurements taken were as follows: wither height (WH): distance from the ground to the top of the withers directly above the centre of the shoulder; body length (BL): distance from the point of the shoulders to the ischium; chest depth (CD): distance from the sternum area immediately caudal to the forelimbs to the top of the thoracic vertebra; hip height (HH): the distance from the ground to the top of the hips directly above the centre of hip; hip width (HW): the widest point at the centre of the stifle.
Digital images and image analysis
Images were captured using a digital camera (NIKON S2500), set to a standard quality resolution (4000 × 3000 pixels). Lighting conditions, the location of the camera and camera settings were tested so as to be the same and constant for all the calves. At the beginning of the digital image analysis, calibration was conducted using reference card (10 × 15 mm), described by Ozkaya & Bozkurt (Reference Ozkaya and Bozkurt2008). Images were downloaded from the camera to a computer file and processed using Image Pro Plus 6.0 software to determine BMs of calves from the images.
Statistical analysis
In a previous study, Ozkaya (Reference Ozkaya2012) determined the accuracy of BMs in Holstein female calves using digital image analysis. The best prediction equations for LW were obtained from BMs including BL, WH, CD, HH and HW. Descriptive statistics and regression analysis of LW on each of the independent variables were performed using the regression analysis procedure of MINITAB (Minitab 2001). Correlation coefficients were also obtained among parameters.
The multi-linear regression model used in the present study is as follows:
 $$Y + b_0 + b_1 X_1 + b_2 X_2 + {\cdots} + b_n X_n + e_{ij} $$
where Y is the dependent variable, b 0 is the intercept, b 1, b 2,…, b n are the regression coefficients, X 1, X 2,…, X n are dependent variables (BL, WH, CD, HH and HW, respectively) and e ij is the residual term.
Polynomial regression analysis of LW on BL, WH, CD, HH and HW were performed. Linear, quadratic and cubic effects of independent variables on LW were included in the following model:
 $$Y_i + b_0 + b_1 X_i + b_2 X_i^2 + b_3 X_i^3 + e_i $$
where Y i is the LW observation of an ith animal, b 0 is the intercept, b 1, b 2, b 3 are the corresponding linear, quadratic and cubic regression coefficients, X i is the independent variables (BL, WH, CD, HH and HW), and e i is the residual term.
RESULTS
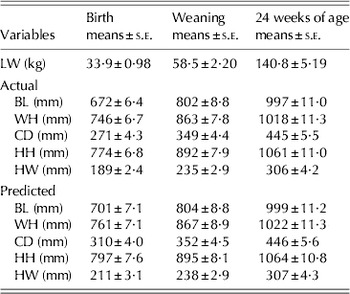
The descriptive statistics of LW and BMs, which were obtained with both actual and digital image analysis, are shown in Table 1.
Descriptive statistics of LW and BMs (n = 41)

Actual, it was taken from animal using measurement stick; Predicted, it was obtained from photos using digital image analysis.
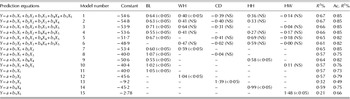
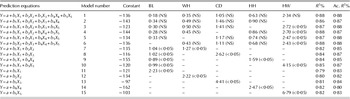
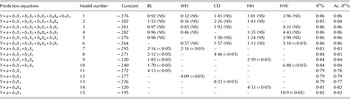
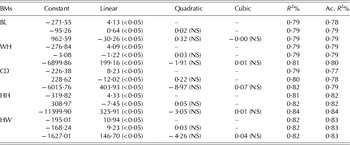
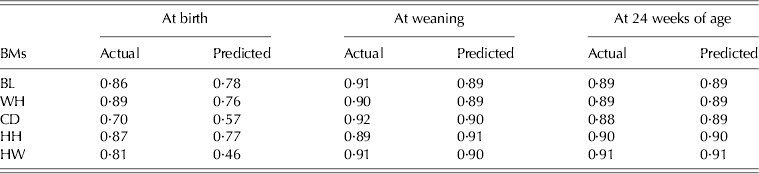
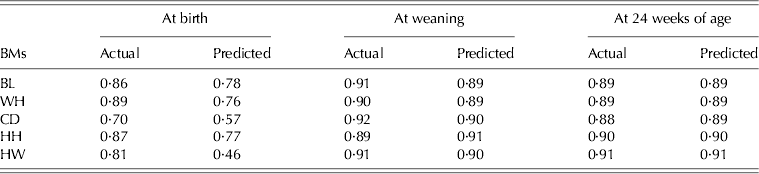
Regressions of LW on various BMs at birth, weaning and 24 weeks of age using digital image analysis are shown in Tables 2–4. The results of LW on linear, quadratic and cubic effects of BMs at 24 weeks of age are presented in Table 5, and Table 6 shows the correlation coefficients of traits.
Prediction equations of LW and linear effects of selected BMs at birth by digital image analysis (n = 41). P values in parentheses. NS = not significant

Ac. R 2, obtained from actual BMs.
Prediction equations of LW and linear effects of selected BMs at weaning by digital image analysis (n = 41). P values in parentheses. NS = not significant

Ac. R 2, obtained from actual BMs.
Prediction equations of LW and linear effects of selected BMs at 24 weeks of age by digital image analysis (n = 41). P values in parentheses. NS = not significant

Ac. R 2, obtained from actual BMs.
Linear, quadratic and cubic effects of BMs obtained with digital image analysis at 24 weeks of age (n = 41). P values in parentheses. NS = not significant

Ac. R 2, obtained from actual BMs.
Pearson correlations between LW and BMs (n = 41)
By using all BMs, the maximum R 2 value was obtained at 0·67 (Table 2). The inclusion of BL, WH and HH in the equation increased R 2 in every step of the regression. The R 2 values were 0·57, 0·57 and 0·59 in models 11, 12 and 14, respectively (Table 2). CD and HW had little effect when included in the model. Comparing the R 2 value obtained between predicted and actual BMs, the actual R 2 values were higher than those obtained using digital image analysis.
Table 2 shows that digital image analysis was poor at estimating the prediction of LW at birth.
The R 2 value at weaning was found to be higher than at birth (Table 3). The regression equations were obtained both through actual measured values and as a result of digital image analysis (Table 3). The highest R 2 values were obtained in model 1 (0·88) and model 6 (0·88); these values were found to be very similar to the results calculated with actual BMs (both 0·88). Therefore, models 1 and 6 were found to be very close to each other. Comparing single BMs in terms of R 2, HH and HW give the best prediction compared to other BMs. It could be concluded that HH and HW were a good predictor for weaning weight. It was evident that a 10 mm change in BL, WH and HH resulted in smaller weight changes (2·23, 2·22 and 2·47 kg, respectively) compared to other BMs.
Table 4 shows the regression equations estimated for the 24 weights of calves at 24 weeks. The highest R 2 was obtained from model 1 (0·86). The R 2 values obtained from models 1 to 6 were found to be more similar to those calculated with actual BMs. In models 3–5, the R 2 values were all 0·86. Comparing the single BMs in terms of R 2, HH and HW give the best predictor compared to the other BMs (0·81 and 0·82, respectively). It could be concluded that HH and HW were good predictors for weight at 24 weeks of age, as for weaning weight also. It was evident that a 10 mm change in BL, WH and HH resulted in less significant weight change (4·13, 4·09 and 4·33 kg, respectively) compared to other BMs.
Table 5 shows the R 2 and coefficients by regressing LW (at 24 weeks of age) against BMs. The R 2 value from the regressions indicates that BL was strongly related to LW considering the cubic coefficient terms (0·84). The quadratic and cubic terms were not significant for any BM, either actual or those predicted by using digital image analysis. In linear coefficient terms, the high R 2 value was found in HW (0·82). The quadratic coefficient term was found to be similar in HH and HW (both 0·82). In all linear, quadratic and cubic coefficient terms, the R 2 values were found to be very close to each other for actual BMs and also those obtained by using digital image analysis without CD.
The R 2 value that was obtained by digital image analysis was found to be higher than those calculated by actual BMs in CD (Table 5).
The correlation coefficients between LW and BMs in the current study were found to be high and significant at weaning and at 24 weeks of age (P < 0·01) (Table 6). The highest correlation coefficient was obtained between LW and HH at the weaning age, which was r = 0·91. Also, the highest correlation coefficients were obtained between LW and HW at 24 weeks of age, which was r = 0·91.
DISCUSSION
The prediction equation included in all BMs showed a high R 2 value at birth, weaning and at 24 weeks of age. The LW of the female Holstein calves could be predicted accurately with the equation that included all BMs. Many researchers also reported that all BMs could be used satisfactorily to determine LW of calves of different cattle breeds (Heinrichs et al. Reference Heinrichs, Rogers and Cooper1992; Tuzemen et al. Reference Tuzemen, Yanar, Akbulut, Ugur and Aydin1995; Wilson et al. Reference Wilson, Egan and Terosky1997; Ulutas et al. Reference Ulutas, Saatci and Ozluturk2001); however, the BMs in those studies were not determined by digital image analysis, as used in the present study. Ozkaya & Bozkurt (Reference Ozkaya and Bozkurt2008) indicated that the prediction ability of digital image analysis was poor when the animal has a large frame (such as the Holstein) as opposed to that obtained in Brown Swiss and crossbred cattle. However, the current study showed that the prediction ability of digital image analysis increases as the calves grow. Tasdemir et al. (Reference Tasdemir, Urkmez and Inal2011a) indicated that the prediction ability of digital image analysis was high in the estimation of LW of Holstein cows. In another study, Negretti et al. (Reference Negretti, Bianconi, Bartocci, Terramoccia and Verna2008) reported that computerized image analysis was an effective measuring system for determination of LW of buffalo species. Ozkaya (Reference Ozkaya2012) indicated that the digital image analysis provides very close agreement and reality for prediction of BMs of Holstein female calves.
In the current study, single regression equations (BL, WH, CD, HH and HW) were used to estimate LW in Holstein calves accurately at weaning and at 24 weeks of age. Tasdemir et al. (Reference Tasdemir, Urkmez and Inal2011a) reported a similar result for the same breed. However, Ozkaya & Bozkurt (Reference Ozkaya and Bozkurt2008) reported that BL can be used to estimate LW accurately in both Brown Swiss and crossbred.
Tasdemir et al. (Reference Tasdemir, Urkmez and Inal2011a) and Ozkaya & Bozkurt (Reference Ozkaya and Bozkurt2008) indicated that the R 2 value in the LW estimated linear, quadratic and cubic terms were high and the relationship between LW and independent variables were not significant in quadratic and cubic terms, and the findings of the current study agree. The linear term is sufficient to predict LW from BMs using digital image analysis.
The correlation coefficients between LW and BMs were significant. This result was in line with findings of Ozkaya & Bozkurt (Reference Ozkaya and Bozkurt2008), Negretti et al. (Reference Negretti, Bianconi, Bartocci, Terramoccia and Verna2008) and Tasdemir et al. (Reference Tasdemir, Urkmez and Inal2011a), who reported high correlation coefficients. The highest correlation coefficient was determined between the LW and the BL measured at the birth of the calves (r = 0·78). Likewise, Bozkurt et al. (Reference Bozkurt, Aktan and Ozkaya2007) and Ozkaya & Bozkurt (Reference Ozkaya and Bozkurt2008) reported that the correlation coefficient between LW and BL was 0·80 and 0·79, respectively. Also, Ozkaya & Bozkurt (Reference Ozkaya and Bozkurt2008) reported that the correlation between LW and BL was 0·54 for the Holstein. Tuzemen et al. (Reference Tuzemen, Yanar, Akbulut, Ugur and Aydin1995) and Yanar et al. (Reference Yanar, Tuzemen, Ozhan, Aydin and Ugur1995) reported that the correlation coefficient between LW and BL was 0·38 and 0·41, respectively. However, digital image analysis was not used in these studies.
All correlation values between LW and BMs were found to be statistically significant (P < 0·05), both those obtained from actual and digital images. Ozkaya & Bozkurt (Reference Ozkaya and Bozkurt2008) reported that the correlation coefficient between LW and HH was 0·44, 0·72 and 0·80 for slaughtered Holstein, Brown Swiss and crossbred, respectively. Bozkurt et al. (Reference Bozkurt, Aktan and Ozkaya2007) and Negretti et al. (Reference Negretti, Bianconi, Bartocci, Terramoccia and Verna2008) indicated that a high correlation was found between LW and WH.
CONCLUSION
In the current study, it was shown that digital image analysis appears to be a very reliable system for the estimation of LW of the female Holstein calves at weaning and at 24 weeks of age. Compared to traditional measuring methods, using digital image analysis would reduce the problems, cost, difficulties, employers’ risk and stress encountered during measuring and weighing of calves. It will be of a great advantage for farmers and researchers to record data that can be used for long-term future analysis and statistical studies.
The authors thank the Suleyman Demirel University Agricultural Research and Application Center for the funding of this study.