



1. Introduction
Compressible turbulence is of great relevance in many natural phenomena and engineering applications, such as in supersonic interstellar turbulence (Padoan & Nordlund Reference Padoan and Nordlund2002; Scalo & Elmegreen Reference Scalo and Elmegreen2004; McKee & Ostriker Reference McKee and Ostriker2007; Federrath et al. Reference Federrath, Roman-Duval, Klessen, Schmidt and Mac Low2010; Hennebelle & Falgarone Reference Hennebelle and Falgarone2012) and in the flow around hypersonic aircraft. While incompressible turbulent flows are characterized by the nonlinear interactions among vortices within a wide range of scales (Frisch Reference Frisch1995), compressible turbulence is even more complex due to the appearance of the shocklet structures (Samtaney, Pullin & Kosović Reference Samtaney, Pullin and Kosović2001; Pan, Padoan & Kritsuk Reference Pan, Padoan and Kritsuk2009; Wang et al. Reference Wang, Shi, Wang, Xiao, He and Chen2011). Substantial progress has been made recently in better understanding compressible turbulence, such as the scaling and statistics (Kritsuk et al. Reference Kritsuk, Norman, Padoan and Wagner2007; Schmidt, Federrath & Klessen Reference Schmidt, Federrath and Klessen2008; Wang et al. Reference Wang, Shi, Wang, Xiao, He and Chen2012), and two-point correlations (Galtier & Banerjee Reference Galtier and Banerjee2011; Wagner et al. Reference Wagner, Falkovich, Kritsuk and Norman2012; Banerjee & Galtier Reference Banerjee and Galtier2013). It is now believed that an inertial energy cascade also exists in compressible turbulence (Aluie Reference Aluie2011; Aluie, Li & Li Reference Aluie, Li and Li2012; Kritsuk, Wagner & Norman Reference Kritsuk, Wagner and Norman2013; Wang et al. Reference Wang, Yang, Shi, Xiao, He and Chen2013a ).
Turbulent statistics are known to be intermittent, and the structure functions exhibit anomalous scaling (Frisch Reference Frisch1995), which has also been observed in compressible turbulence (Kritsuk et al. Reference Kritsuk, Norman, Padoan and Wagner2007; Schmidt et al. Reference Schmidt, Federrath and Klessen2008; Galtier & Banerjee Reference Galtier and Banerjee2011; Wagner et al. Reference Wagner, Falkovich, Kritsuk and Norman2012). For incompressible turbulence, Lagrangian study, i.e. investigation of statistical properties by following particles advected by turbulence, has provided many interesting and valuable results in the past few years (Toschi & Bodenschatz Reference Toschi and Bodenschatz2009). For very weakly compressible turbulence with Mach number of order 0.3, both the Eulerian and the Lagrangian statistics are very close to those of the incompressible flow (Benzi et al. Reference Benzi, Biferale, Fisher, Kadanoff, Lamb and Toschi2008, Reference Benzi, Biferale, Fisher, Lamb and Toschi2010). Recent research at much higher Mach number, however, has revealed that the compressibility has a pronounced influence on the statistics (Konstandin et al. Reference Konstandin, Federrath, Klessen and Schmidt2012; Yang et al. Reference Yang, Wang, Shi, Xiao, He and Chen2013).
The statistics of compressible turbulence depends not only on the flow parameters such as the Mach number and the Reynolds number, but also on the nature of the external driving force. Federrath (Reference Federrath2013) conducted numerical simulations at very high Mach number of order 17 for both solenoidal (divergence-free) driving and compressive (curl-free) driving. Compressive driving produces a much more intermittent density distribution than solenoidal driving. Similar behaviour has been reported at lower Mach number of order 5 in Konstandin et al. (Reference Konstandin, Federrath, Klessen and Schmidt2012), in which the authors discovered that the structure functions have more intermittent scalings for compressive driving than solenoidal driving. More interestingly, the results revealed that the Lagrangian statistics show stronger intermittency than the Eulerian ones but have weaker dependence on different types of forcing. While for ideal gas turbulence purely driven by a solenoidal force at a Mach number of approximately 1 the structure functions of the whole velocity are very close to those of the incompressible case, the structure functions of the compressive velocity component exhibit much stronger intermittent scalings (Wang et al. Reference Wang, Shi, Wang, Xiao, He and Chen2012).
All of the above results provide useful knowledge about how the compressibility affects the intermittency in turbulent flow. However, it is still not clear how the turbulent statistics respond as the Mach number approaches unity from a smaller value. Since this regime corresponds to the transition from an incompressible flow to a flow state where the compressibility starts to affect the flow properties, investigation in this regime will provide valuable insights into the effects of compressibility on turbulent statistics. In the present study we conduct a series of numerical simulations in the aforementioned regime with different driving forces. We focus on the Lagrangian structure functions (LSFs) by tracking passive tracers advected by turbulence. The
 $p$
th order LSF is defined as
 $S_{p}({\it\tau})=\langle [{\it\delta}u({\it\tau})]^{p}\rangle$
, where
 ${\it\delta}u({\it\tau})=u(t+{\it\tau})-u(t)$
is the increment of a Cartesian component of tracer velocity over a time lag
 ${\it\tau}$
.
Before we proceed to the results, we would like to point out that recently there were debates on the physical meaning of single-particle LSFs and the existence of inertial scalings in those LSFs (Falkovich et al. Reference Falkovich, Xu, Pumir, Bodenschatz, Biferale, Boffetta, Lanotte and Toschi2012; Lanotte et al. Reference Lanotte, Biferale, Boffetta and Toschi2013). Some alternatives to traditional LSFs have been proposed in the past few years (e.g. Huang et al. Reference Huang, Biferale, Calzavarini, Sun and Toschi2013; Lévêque & Naso Reference Lévêque and Naso2014). Nevertheless, LSFs have been extensively used in the Lagrangian study of turbulence and have provided useful information about the intermittent statistics of turbulence, e.g. see the review of Toschi & Bodenschatz (Reference Toschi and Bodenschatz2009) and numerous references therein. Furthermore, in the current study LSFs will serve as a tool to highlight the difference between compressible and incompressible flows, and the effects of the strength of the compressibility.
This paper is organized as follows. In § 2 we will briefly describe the numerical simulations and flow fields. In § 3 the intermittency will be discussed by using Lagrangian statistics. Finally, conclusions will be given in § 4.
2. Numerical simulations
Three-dimensional compressible turbulence for an ideal gas is simulated in a periodic box of
 $(2{\rm\pi})^{3}$
by using a hybrid scheme (Wang et al.
Reference Wang, Wang, Xiao, Shi and Chen2010). Namely, for the convective term an eighth-order compact scheme is used in the smooth region away from the shocklets and a seventh-order weighted essentially non-oscillatory scheme is used near the shocklets. For time advancing we employ an explicit low-storage second-order Runge–Kutta method. The flow is driven by a large-scale force which can be applied to both solenoidal and compressive components of the velocity field. More details about the numerical method are reported in Wang et al. (Reference Wang, Yang, Shi, Xiao, He and Chen2013a
). Four cases are simulated with different driving forces and turbulent Mach numbers
 $M_{t}=U_{\mathit{rms}}/c$
, where
 $U_{\mathit{rms}}$
is the root-mean-square (r.m.s.) value of the velocity magnitude and
 $c$
is the mean speed of sound. The resolution is fixed at
 $512^{3}$
. The parameters for the simulations are listed in table 1. Cases S045, S075 and S104 are driven by purely solenoidal forces. They have different values of
 $M_{t}$
and similar Taylor microscale Reynolds numbers
 $R_{{\it\lambda}}$
. Case C069 is driven by a combination of compressive and solenoidal forces with a ratio of 4:1.
Parameters of the numerical simulations. Columns from left to right: case name, the ratio of the solenoidal force to the compressible force, the turbulent Mach number, the Taylor microscale Reynolds number, the viscous time scale and the integral time scale. In the case names the leading letter indicates purely solenoidal driving (S) or the driving force dominated by the compressive component (C), and the following three digits indicate the Mach number.

A Lagrangian module has been developed for particle tracking (Yang et al.
Reference Yang, Wang, Shi, Xiao, He and Chen2013). For each case, after the flow reaches the statistically steady state, a million passive tracers are seeded uniformly and advected by the background flow. The flow information at the exact locations of particles is obtained by a trilinear interpolation of the values at surrounding grid points. The particle locations are then updated by using the same time-marching scheme as the Eulerian solver. The trilinear interpolation is adequate in our simulations because (1) our mesh size is slightly smaller than the Kolmogorov scale and (2) linear interpolation may avoid any unphysical oscillation near shocklets where the flow quantities change abruptly. The flow then evolves for a time period of approximately
 $11T^{E}$
. Here,
 $T^{E}=\sqrt{3}L/u_{\mathit{rms}}$
is the large-eddy turnover time, where
 $L$
is the integral length scale. During the last
 $8T^{E}$
, two sets of tracer data are stored. One set of data covers the whole
 $8T^{E}$
period with a sampling rate of approximately
 $0.1{\it\tau}_{{\it\eta}}$
, where
 ${\it\tau}_{{\it\eta}}=({\it\nu}/{\it\epsilon})^{1/2}$
denotes the Kolmogorov time scale, with
 ${\it\nu}$
being the mean kinematic viscosity and
 ${\it\epsilon}$
the energy-dissipation rate per unit mass. Another set of data consists of several segments, all of which last a time period of
 $0.4{\it\tau}_{{\it\eta}}$
and are separated by
 $T^{E}/3$
from one another. Within each segment the sampling rate is approximately
 $0.01{\it\tau}_{{\it\eta}}$
. From the former dataset we calculate the Lagrangian statistics for large time scales, which are usually averaged over a time period of approximately
 $5T^{E}$
and include in total
 $4\times 10^{7}$
data points. The statistics of small time scales are calculated from the latter dataset, which covers a time period of approximately
 $3T^{E}$
and contains
 $10^{7}$
data points.
Contours of
 $\log ({\it\rho}/{\it\rho}_{0})$
on the midplane of the domain for (a) case S045, (b) case S075, (c) case S104 and (d) case C069. Due to the small density variation in case S045, the colour map in (a) has half of the value range compared with the others.

In figure 1 we show the contours of the logarithm of density
 $\log ({\it\rho}/{\it\rho}_{0})$
on one slice, where
 ${\it\rho}_{0}$
is the mean density. For case S045 with solenoidal driving at the smallest Mach number, the density is non-uniform but no distinct shocklet is observed. As the Mach number increases, the inhomogeneity of the density is enhanced and the shocklets become stronger. These shocklets are still localized in space, i.e. the size of the shocklets is much smaller than the domain size. For case C069 with hybrid driving, the morphology of the shock structures is totally different from those with solenoidal force. Large-scale shocks develop and extend through the entire domain. The flow field is divided into blocks by these large shock structures, and within each block the variation of density is relatively weak.
3. Lagrangian statistics
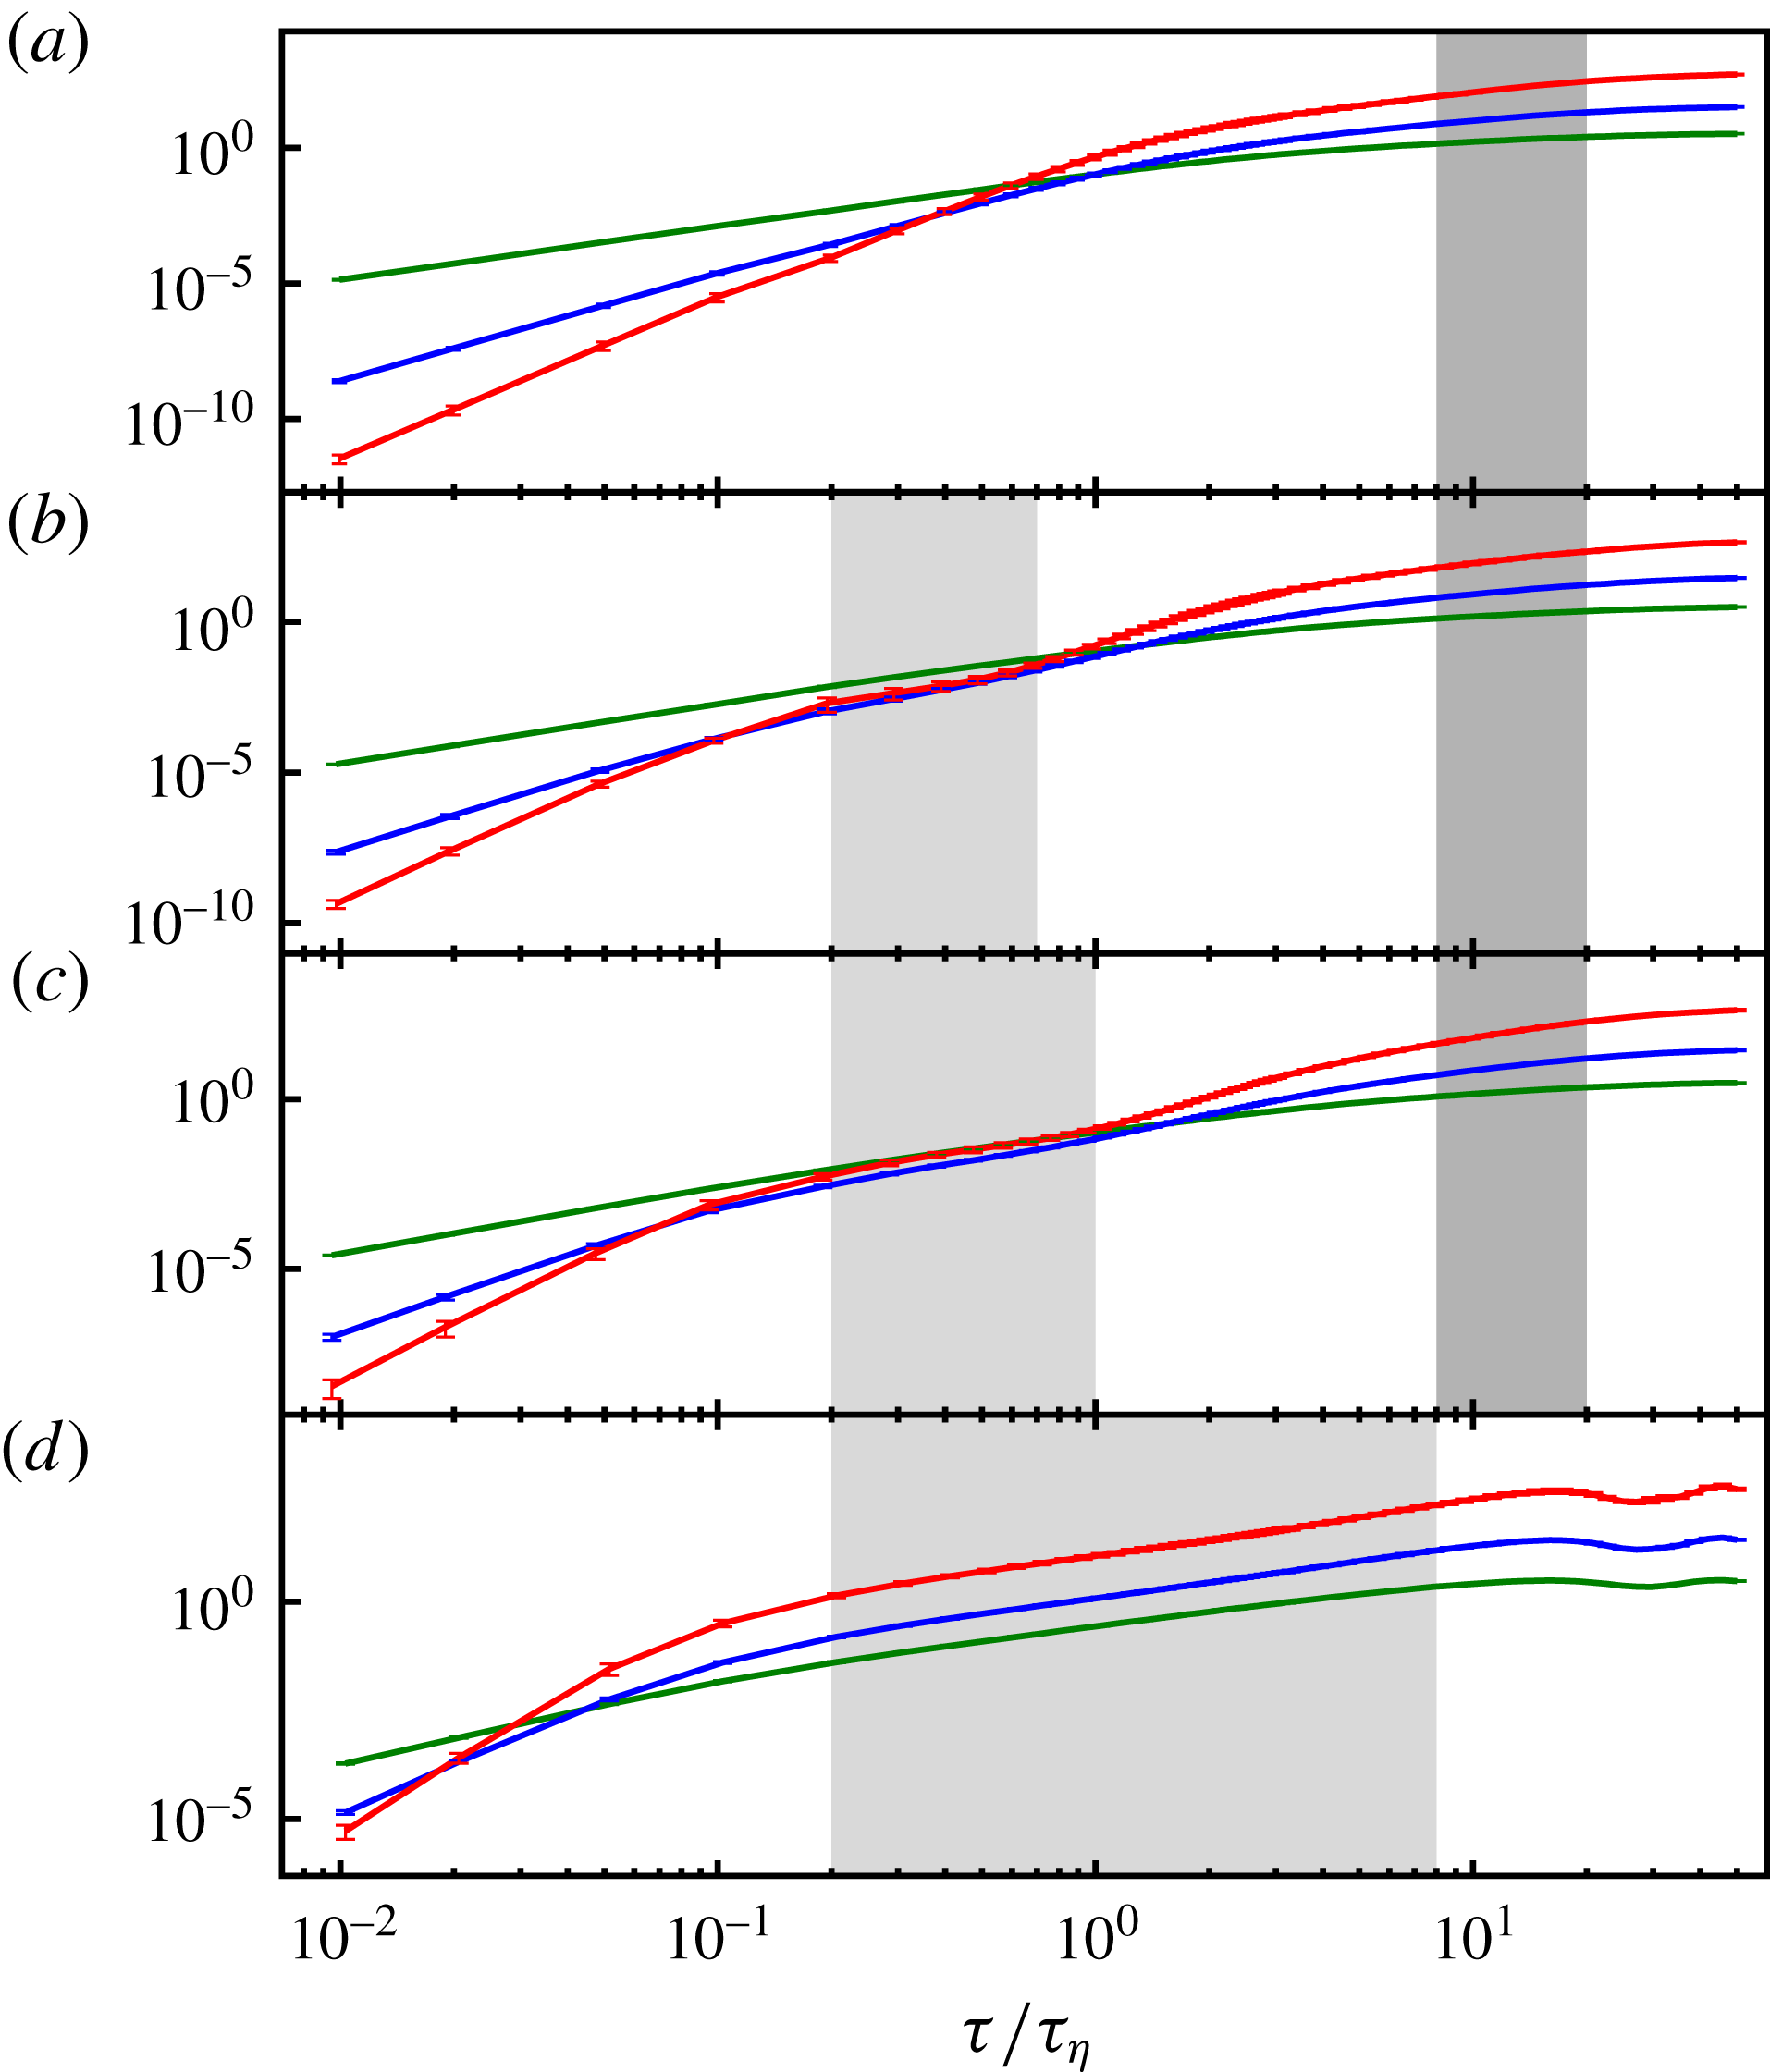
Different force schemes have profound influences on the behaviour of the LSFs, as illustrated in figure 2, where we plot the LSFs up to the sixth order. For case S045, the LSFs are quite similar to those of the incompressible turbulence, since at such a low Mach number the compressibility effect is negligible, which has also been confirmed by simulations with different numerical schemes (Benzi et al.
Reference Benzi, Biferale, Fisher, Kadanoff, Lamb and Toschi2008). As
 $M_{t}$
increases, the LSFs at
 ${\it\tau}>10{\it\tau}_{{\it\eta}}$
show no visible changes. However, a new self-similar region emerges below the Kolmogorov time scale and expands as
 $M_{t}$
increases. For case C069, the LSFs exhibit a self-similar region in the range
 $0.2{\it\tau}_{{\it\eta}}<{\it\tau}<8{\it\tau}_{{\it\eta}}$
and saturate for larger
 ${\it\tau}$
. The shape is very similar to those at higher
 $M_{t}$
(Konstandin et al.
Reference Konstandin, Federrath, Klessen and Schmidt2012). All of these results indicate that for the Mach number considered here a purely solenoidal driving only has notable effects on the LSFs at short time scale, while a compressive driving can change the behaviour of the LSFs from the sub-Kolmogorov time scale to much larger scales.
Even-order LSFs for (a) case S045, (b) case S075, (c) case S104 and (d) case C069: green,
 $p=2$
; blue,
 $p=4$
; red,
 $p=6$
. The error bar is estimated by the standard deviation of the temporary fluctuation. The dark grey shade marks the range where the relative scaling exponent
 ${\it\zeta}_{p}$
is calculated and the light grey shade marks the range where
 ${\it\xi}_{p}$
is calculated.
We performed an extended self-similarity (ESS) analysis (Benzi et al.
Reference Benzi, Ciliberto, Tripiccione, Baudet, Massaioli and Succi1993) and calculated the local slope
 ${\it\chi}_{p}=\text{d}\log (S_{p}({\it\tau}))/\text{d}\log (S_{2}({\it\tau}))$
. In figure 3 we plot the curves of
 ${\it\chi}_{p}$
for
 $p=4$
and 6. All of the curves approach the dimensional non-intermittent value
 $p/2$
as
 ${\it\tau}$
decreases to zero. This confirms that our Lagrangian simulation has sufficient time resolution. For case S045, the curve shares similar characteristics to those for incompressible turbulence (Arnèodo et al.
Reference Arnèodo, Benzi, Berg, Biferale, Bodenschatz, Busse, Calzavarini, Castaing, Cencini, Chevillard, Fisher, Grauer, Homann, Lamb, Lanotte, Lévèque, Lüthi, Mann, Mordant, Müller, Ott, Ouellette, Pinton, Pope, Roux, Toschi, Xu and Yeung2008; Biferale et al.
Reference Biferale, Bodenschatz, Cencini, Lanotte, Ouellette, Toschi and Xu2008; Toschi & Bodenschatz Reference Toschi and Bodenschatz2009). A dip appears at approximately
 ${\it\tau}\approx 3{\it\tau}_{{\it\eta}}$
, which is caused by small-scale vortex filaments (Biferale et al.
Reference Biferale, Boffetta, Celani, Lanotte and Toschi2005; Bec et al.
Reference Bec, Biferale, Cencini, Lanotte and Toschi2006). We refer to this as the vortex dip. Interestingly, a new dip emerges at sub-Kolmogorov time scale and becomes deeper when
 $M_{t}$
increases, as shown by the curves of cases S075 and S104. Meanwhile the vortex dip becomes shallower and eventually invisible in the curve of case S104. Thus, a new type of intermittency develops at small time scale when the compressibility is strong enough. For case C069, the situation is totally different. As
 ${\it\tau}$
increases from small time scale,
 ${\it\chi}_{p}$
quickly drops to near unity and stays at this low value over a relatively wide range of time scales, and then slowly increases before the LSFs saturate. This new dip, starting from sub-Kolmogorov time scale, will be referred to as the shocklet dip. We will show below that it can be related to shocklets.
Extended self-similarity local slope
 ${\it\chi}_{p}$
for
 $p=4$
and 6: green, case S045; blue, case S075; red, case S104; grey, case C069. The error bar is estimated by the standard deviation of the temporary fluctuation and is only shown at every other data point for clarity. For case C069,
 ${\it\chi}_{p}$
is computed in the range of
 ${\it\tau}<12{\it\tau}_{{\it\eta}}$
before the LSFs saturate.

Our results indicate that two different types of self-similarities may exist at different time scales. Thus, two relative scaling exponents can be extracted for both self-similar regions. For case S045, only one relative scaling exponent
 ${\it\zeta}_{p}$
is calculated by a linear fitting of
 $(\log (S_{2}({\it\tau}))\log (S_{p}({\it\tau})))$
at
 $8<{\it\tau}/{\it\tau}_{{\it\eta}}<T_{max}=20$
with
 $T_{max}$
comparable to
 $T^{E}$
. This region corresponds to the plateau at the scales above the vortex dip in the
 ${\it\chi}_{p}$
curves, as shown in figure 3. Another relative scaling exponent
 ${\it\xi}_{p}$
is calculated by a linear fitting at
 $0.2<{\it\tau}/{\it\tau}_{{\it\eta}}<0.7$
for case S075 and
 $0.2<{\it\tau}/{\it\tau}_{{\it\eta}}<1.0$
for case S104. For case C069, we only calculate
 ${\it\xi}_{p}$
over the region
 $0.2<{\it\tau}/{\it\tau}_{{\it\eta}}<8.0$
. These regions are marked by grey shade in figure 2. The exponents are shown in figure 4. One may expect that
 ${\it\zeta}_{p}$
will recover the value of the incompressible flow as
 $M_{t}$
decreases to zero. This is exactly the case in our results, as shown in figure 4, where
 ${\it\zeta}_{p}$
from our simulations is compared with the values reported in Benzi et al. (Reference Benzi, Biferale, Fisher, Lamb and Toschi2010). For cases S045 and S075 with lower
 $M_{t}$
,
 ${\it\zeta}_{p}$
takes a value very close to that of the incompressible case, although our simulations have smaller Reynolds numbers. For higher
 $M_{t}$
such as case S104,
 ${\it\zeta}_{p}$
is considerably higher than the incompressible value at high order. This indicates that compressibility starts to affect the overall turbulent statistics over a wide range of time scales.
Extended self-similarity relative scaling exponents up to
 $p=8$
for
 ${\it\zeta}_{p}$
(red upward triangles) and
 ${\it\xi}_{p}$
(blue downward triangles) for (a) case S045, (b) case S075, (c) case S104 and (d) case C069. The grey circles in the plots for cases S045, S075 and S104 mark the values for the incompressible case with
 $Re_{{\it\lambda}}\sim 600$
(Benzi et al.
Reference Benzi, Biferale, Fisher, Lamb and Toschi2010). For cases S045 and C069, only the applicable exponents are shown.

The relative exponent
 ${\it\xi}_{p}$
calculated in the new self-similar region shows totally different behaviour compared with
 ${\it\zeta}_{p}$
. It is slightly larger than
 ${\it\zeta}_{p}$
for
 $p=1$
and smaller than
 ${\it\zeta}_{p}$
for
 $p>2$
, indicating a much stronger intermittency. It saturates when
 $p>4$
for cases S075 and S104. The saturated exponent
 ${\it\xi}_{\infty }$
, which is calculated by averaging
 ${\it\xi}_{p}$
over
 $p=5$
–8, is approximately 1.47 for case S075 and 1.19 for case S104. For case C069,
 ${\it\xi}_{p}$
does not saturate completely but increases very slowly when
 $p>4$
. We define
 ${\it\xi}_{\infty }={\it\xi}_{8}\approx 1.19$
for case C069. Based on multi-fractal theory, the saturation of the exponent suggests that the tails of the probability density function (PDF)
 $P({\it\delta}u,{\it\tau})$
should collapse for different values of
 ${\it\tau}$
in the self-similar region when normalized by
 ${\it\tau}^{{\it\xi}_{\infty }}$
(Benzi et al.
Reference Benzi, Biferale, Fisher, Kadanoff, Lamb and Toschi2008; Wang et al.
Reference Wang, Yang, Shi, Xiao, He and Chen2013b
). We plot in figure 5 the normalized PDF
 ${\it\tau}^{-{\it\xi}_{\infty }}P$
for case S104 within
 ${\it\tau}/{\it\tau}_{{\it\eta}}\in (0.2,1.0)$
and for case C069 within
 ${\it\tau}/{\it\tau}_{{\it\eta}}\in (0.2,8.0)$
, i.e. the region where
 ${\it\xi}_{p}$
is evaluated. Indeed, the tails of the normalized PDFs collapse. It is remarkable that for case C069 the peak of the normalized PDFs at
 ${\it\delta}u=0$
decreases for several orders as
 ${\it\tau}/{\it\tau}_{{\it\eta}}$
increases, while the tails are still very close to one another for the entire range of
 ${\it\tau}/{\it\tau}_{{\it\eta}}\in (0.2,8.0)$
.
Probability density functions of
 ${\it\delta}u/u_{\mathit{rms}}^{c}$
normalized by
 ${\it\tau}^{{\it\xi}_{\infty }}$
, where
 $u_{\mathit{rms}}^{c}$
is the r.m.s. value of the velocity component: (a)
 ${\it\tau}/{\it\tau}_{{\it\eta}}\in (0.2,1.0)$
for case S104 and (b)
 ${\it\tau}/{\it\tau}_{{\it\eta}}\in (0.2,8)$
for case C069. The colour changes from blue to red as
 ${\it\tau}$
increases.

It has been revealed that the exponents of the Eulerian structure functions saturate due to the appearance of the front-like or shocklet structures (Benzi et al.
Reference Benzi, Biferale, Fisher, Kadanoff, Lamb and Toschi2008; Wang et al.
Reference Wang, Yang, Shi, Xiao, He and Chen2013b
). From the Lagrangian point of view, when a passive tracer moves through a shocklet it gains a velocity increment which is determined by the strength of the shocklet. In a homogeneous flow, a reasonable assumption is that the probability of a tracer encountering a shocklet is proportional to the time lag
 ${\it\tau}$
, which gives
 ${\it\delta}u\sim \text{constant}\cdot {\it\tau}$
. Therefore, the saturated value of the exponent should be very close to 1 if the shocklets in the flow have similar strength and tracers only penetrate shocklets once in the time interval considered. This argument is consistent with our numerical results. For a short time interval, it is likely that tracers encounter shocklets at most once, and thus the local relative exponent should be close to 1. Indeed, in figure 3 we observe that with solenoidal driving force the local minimum of
 ${\it\chi}_{p}$
within the shocklet dip approaches 1 as
 $M_{t}$
increases, while the
 ${\it\chi}_{p}$
of case C069 equals 1 at approximately
 ${\it\tau}={\it\tau}_{{\it\eta}}$
. For the three cases with solenoidal driving force, the major portion of the flow field is dominated by vortical structures, and the LSFs are similar to those of the incompressible cases at large time scales. However, the effects of compressibility do emerge at higher
 $M_{t}$
. With hybrid driving, however, shocks are more pronounced and dramatically change the LSFs even at large time lags.
Now it is clear that the shocklet dip in the local slope curves is related to the shocklet structures in flow. It is worth pointing out that the vortex dip and the shocklet dip have different shapes and respond differently to their relevant control parameters. For incompressible flow, the location and shape of the vortex dip are universal and have minor dependences on the Reynolds number (Arnèodo et al.
Reference Arnèodo, Benzi, Berg, Biferale, Bodenschatz, Busse, Calzavarini, Castaing, Cencini, Chevillard, Fisher, Grauer, Homann, Lamb, Lanotte, Lévèque, Lüthi, Mann, Mordant, Müller, Ott, Ouellette, Pinton, Pope, Roux, Toschi, Xu and Yeung2008). The shocklet dip reported here, on the other hand, expands over time scales as
 $M_{t}$
increases or shocklets become dominant. This is caused by the different natures of the extreme velocity differences induced by vortex filaments and shocklets. For a tracer trapped by a vortex filament, the largest velocity difference occurs at the time lag during which the tracer travels half of the circle around the vortex filament, regardless of the strength of the vortex filament. However, when a tracer penetrates a shocklet, the velocity differences over a time lag are predominantly determined by the strength of the shocklet, provided that the tracer is located on different sides of the shocklet at the beginning and end of that time lag. As the shocklet becomes stronger, its influence lasts for a longer time period.
4. Conclusions
In this work we reported several interesting results about the intermittent statistics and the anomalous scaling of LSFs for compressible homogeneous turbulence, which provide new insights into the compressibility origin of turbulent intermittency. A series of 3D numerical simulations were conducted for different turbulent Mach numbers
 $M_{t}$
and different types of driving force. When the flow is purely driven by a solenoidal force, the LSFs are very close to those of incompressible turbulence at small
 $M_{t}$
. For large
 $M_{t}$
, the LSFs exhibit a new self-similar region at the sub-Kolmogorov time scale, which is characterized by a saturated relative scaling exponent and is attributed to shocklet structures. This region expands to larger time scales and the saturated exponent decreases towards 1 as
 $M_{t}$
increases. The behaviour of the LSFs is still very close to that for incompressible flow at larger time scales. When
 $M_{t}$
is high enough, say approximately 1, compressibility starts to affect the statistics at both small and large time scales.
The nature of the driving force also has profound influences on the LSFs. When a driving force dominated by a compressive component is applied, very strong shock structures emerge at relatively smaller
 $M_{t}$
compared with the flow solely driven by a solenoidal force, and the LSFs only have a single self-similar region ranging from the sub-Kolmogorov time scale to much larger time scales before the LSFs saturate. This self-similar region is caused by strong shocks, and the relative exponent saturates for high-order LSFs. We also demonstrated that the saturation of the relative exponent in the compressibility-related self-similar region can be explained by a simple tracer–shocklet interaction model. Our results indicated that for time lags in this region the PDFs of the velocity increments collapse after proper normalization, which is consistent with multi-fractal theory; a similar phenomenon has been reported for Eulerian statistics.
Another issue that is not discussed in the present study is the effect of the Reynolds number, since all of our simulations have similar
 $Re_{{\it\lambda}}$
. Some conjectures may be made based on the current results and their differences compared with incompressible turbulence. For solenoidal driving with high enough Mach number, the new self-similar region at small time scales is dominated by compressible effects, since for incompressible turbulence one would expect no self-similar behaviour at such small time scales. Thus, the Reynolds number should have a minor influence on the existence of this region. For fixed
 $Re$
, as the Mach number increases the new self-similar region starts to affect the statistics at large time scales. While higher
 $Re$
indicates wider scale separation in the flow, the change of the LSFs at large time scales may only appear at higher Mach number as
 $Re$
becomes larger. When the driving force is dominated by the compressive component, the morphology of the shocklet is totally different from the solenoidal driving case, and compressibility changes the LSFs from sub-Kolmogorov scales to much larger scales. The effect of
 $Re$
in such flow is not clear at this stage. More simulations with different values of
 $Re$
are needed to fully understand the effects of the Reynolds number in the future.
Acknowledgements
The authors appreciate the useful comments from the anonymous referees. This work was supported partially by the National Natural Science Foundation of China (NSFC grants 11221061 and 91130001) and the National Basic Research Program of China (grant 2013CB834100). Y.Y. appreciates the partial support by NSFC grant 11274026. Y.S. also acknowledges the support by NSFC grant U1330107. The simulations were carried out at the Tianhe-1A supercomputing facility at the National Supercomputer Center in Tianjin, China.



