I. INTRODUCTION
The Fe–6.5 wt% Si magnetic material has excellent soft magnetic properties such as the highest magnetic permeability, minimum core loss, Reference Arai and Ishiyama1 and almost zero magnetostriction, Reference Takada, Abe, Masuda and Inagaki2 which make the material especially suitable for magnetic cores of inductive devices working at high frequency. However, the ductility of the steel is too poor to produce sheets by conventional rolling. The application of the material is therefore hindered. To overcome the poor workability of the alloy, preparation routes such as chemical vapor deposition (CVD) Reference Yamaji, Abe, Takada, Okada and Hiratani3 and fast quenching ribbon Reference Tsuya4 were used. But the vital drawbacks of these methods are their high cost and low production rate. Therefore, the spray forming process, a near net shape solution Reference Kasama, Moreira, Botta, Kiminami and Bolfarini5 and soft magnetic composite materials, Reference Shokrollahi and Janghorban6 the combination of magnetic powders and insulators, are developed to provide materials with high permeability, excellent magnetic saturation, and high electrical resistivity. Reference Sowter7
Both of the methods are based on the gas atomization process, which is commonly used to fabricate powders because of its low cost and mass production. The microstructures of gas-atomized powders are strongly related to their particle sizes, which in turn are believed to have an apparent effect on the magnetic performance. Reference Bayraml, Gölgelioğlu and Ertan8 The microstructure evolution is very important because it provides valuable information for the powder production, for example the secondary dendrite arm spacing (SDAS) is closely associated with particle size and cooling rates. The characterization of powder microstructure is of fundamental importance to optimize the atomization parameters, which are important to control the production process. Many research studies have been reported on various alloys, such as Cu–Sn Reference Tiedje, Hansen and Pedersen9,Reference Freyberg, Buchholz, Uhlenwinkel and Henein10 and Al–Si and Al–Cu, Reference Levi and Mehrabian11 Al–Fe, Reference Boettinger, Bendersky and Early12 super alloy, Reference Xu, Cui, Li, Xu, Li and Hu13 and amorphous Al-based alloy. Reference Zheng, Lin, Zhou and Lavernia14 On the other hand, the microstructure of the droplet is believed to be strongly affected by the undercooling before nucleation, Reference Li, Wu, Fukuda and Ando15 and this effect only becomes significant when the size of the droplet is around 10 µm or smaller. Reference Boettinger, Bendersky and Early12 Since it is impossible to measure the undercooling and nucleation of a flying droplet in atomizing chamber, numerical modeling is believed to be an effective approach to reveal thermal-physics of powder atomization, and numerous models have been developed, Reference Levi and Mehrabian16–Reference Zheng, Lin, Zhou and Lavernia25 in which the effects of atomization parameters on the solidification of the droplets were addressed. By combining the heat transfer analysis with classic heterogeneous nucleation theory, the whole solidification process of the droplet is predictable. This work tends to conduct research on the microstructure characterization and thermal history calculation of the gas-atomized Fe–6.5% Si droplets. The results can be helpful to optimize the processing parameters of Fe–6.5 wt% Si magnetic powders.
II. EXPERIMENTAL DETAILS
Industry-grade pure iron (99.5%), silicon (99.9%), and nitrogen (99.9%) were used as starting materials and atomizing gas. The melting and atomization was done in a two-chamber vertical device. 10 kg Fe and Si raw materials were first induction melted in the upper chamber under 10−3 bar vacuum and kept for 10 min to reach homogeneity at ∼1800 K (100 K above the liquidus), which is monitored by a Ray-tek infrared two-color pyrometer. The molten alloys were then poured into a crucible, preheated to the same temperature and goes down through the tip of the tube; the stream was disintegrated into droplets by the impact of high-pressure nitrogen gas from a close-coupled nozzle. Powders were then collected and sieved into eight size fractions for further analyses: <38, 38–53, 53–63, 63–75, 75–105, 105–150, 150–180, and >180 μm. Only powders below 180 μm were considered, because powders larger than 180 μm contained too many flakes or satellite particles.
The crystalline phases of the as-atomized powders were determined by x-ray diffraction (XRD) using monochromatic Cu Kα radiation produced by a Rigaku D/max-2550 diffractometer (Japan). The powders were first embedded in epoxy resin, in a 10 mm copper tube, and then the sample was mechanically polished and etched using 5% (volume fraction) natal. The observation of cross-sectional microstructures and surface morphology was carried out on an APOLO300 scanning electron microscope equipped with energy dispersive x-ray spectroscopy (EDX).
III. EXPERIMENTAL RESULTS
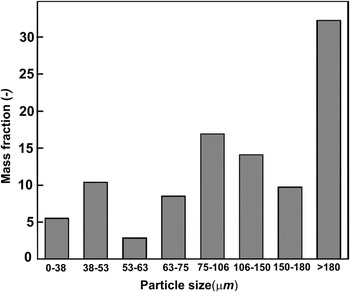
Figure 1 shows the particle size distribution of an atomization experiment, and the average particle diameter is d 50 = 127 µm. In fact, the particle size distribution shows two local maxima: particles with 38–53 µm diameter and 75–106 µm diameter. The size distribution of the atomized powder particles depends on processing parameters such as gas pressure, melt overheating, heat capacity, and thermal conductivity of the atomizing gas, as well as the physical properties of the melting material. As it was mentioned in the experimental part, particles with diameters >180 µm were not further considered because of their irregular shapes.
Mass fraction of particles as a function of as-atomized Fe–6.5 wt% Si alloy powders.

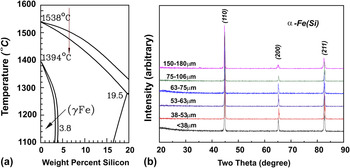
From the Fe–Si phase diagram Reference Okamoto26 in Fig. 2(a), the α-Fe (Si) solid solution phase is expected. The room temperature XRD patterns of the as-atomized particles are shown in Fig. 2(b); a single phase α-Fe (Si) solid solution with no apparent differences indicating that phase formation is independent of solidification process. This result is consistent with what we can expect from phase diagram.
(a) The Fe-rich part of Fe–Si phase diagram, where the red arrow shows the current composition, and (b) XRD patterns for as-atomized Fe–6.5 wt% Si atomized powders.

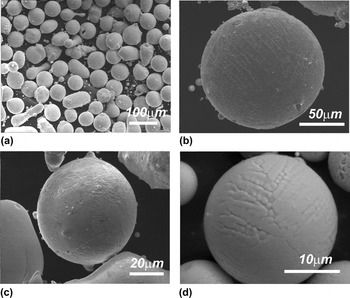
Direct observations of the as-atomized particles showed that the powders were mainly spherical in shape [Fig. 3(a)]. The size of the selected particles is about 140 µm [Fig. 3(b)], 60 µm [Fig. 3(c)], and 25 µm [Fig. 3(d)], respectively. Large and medium particles usually have many satellite particles attached during the solidification process in the turbulent gas flow. The morphology of the particles and their surfaces can be deduced from Figs. 3(b)–3(d). The dendritic, elongated dendritic, and equiaxed-type microstructures were observed. The micrometer-sized dendrite morphology indicates a relatively fast growth. Reference Trivedi and Somboonsuk27
Surface morphologies of atomized particles. (a) The overall spherical shape and the dendrite growth morphology of particles with diameters of (b) 140 µm, (c) 60 µm, and (d) 25 µm, are illustrated.

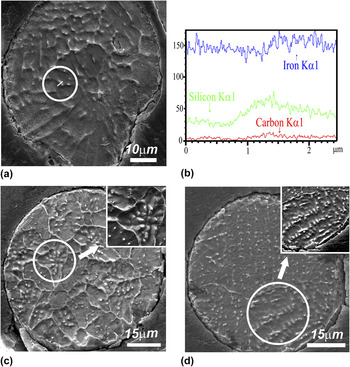
The SDASs were measured using the cross-sectional image, as shown in Fig. 4. The dendrite patterns of the cross-sectional image as shown in Fig. 4(a) are not apparent because the distribution coefficient k in Fe–Si system is 0.8, very close to unity, causing less Si segregation as shown by the EDX results in Fig. 4(b). The EDX measurement was conducted in the encircled area of Fig. 4(a). The concentration of Si in white dots is higher than the surrounding interdendritic areas. The typical equiaxed dendrites and elongated dendrites of the Fe–Si alloy are indicated by Figs. 4(c) and 4(d).
(a) Cross-sectional images of Fe–Si particles and (b) EDX result of a line scan through an interdendritic area [encircled in Fig. 4(a)]. (c) Typical equiaxed dendritic and (d) elongated dendritic patterns are shown. Insets are the zoomed regions shown in (c) and (d).

IV. MODEL DESCRIPTION
To show the effect of atomization parameters on the microstructure, the droplet cooling model is briefly introduced here. The melt is firstly disintegrated into fine droplets by the impact of high-pressure inert gas jets, and then droplets are accelerated and cooled down during flight in gas flow. By calculating the heat and momentum exchange of a droplet and gas, combined with classical nucleation theory, the cooling curve of a single droplet is traceable. The overall solidification of a droplet includes: cooling of liquids fully to its nucleation temperature, recalescence until the production of internal heat equals the heat transfer from the droplet surface, and segregated solidification to solidus temperature. First, the droplet cools down to its nucleation temperature T N. By safely neglecting the radiation effect, the heat exchange by convection is formulated as Reference Lee and Ahn20
 $$C_{\rm{L}} {{{\rm{d}}T_{\rm{d}} } \over {{\rm{d}}t}} = - {{6h} \over {{\rm{\rho }}_{\rm{d}} D}}\left( {T_{\rm{d}} - T_{\rm{g}} } \right)\quad ,$$
where C L, T d, h, ρd, D, T d, T g are liquid specific heat, droplet temperature, heat transfer coefficient, density, diameter of the droplet, the droplet temperature, and temperature of the gas, respectively. At the end of this stage, T d undercools to nucleation temperature,
 $${T_{\rm{N}}} = {T_{\rm{L}}} - \Delta {T_{{\rm{het}}}}\quad ,$$
where T L is the temperature of liquid state droplet, and ΔT het, the undercooling for heterogeneous nucleation can be expressed as Reference Mathur, Apelian and Lawley19
 $$\Delta {T_{{\rm{het}}}} = \Delta {T_{{\rm{hom}}}}{\rm{exp}}\left( { - 2.2 \times {{10}^{12}}{V_{\rm{d}}}} \right)\quad ,$$
According to the nucleation theory, Reference Hirth28 ΔT hom, the undercooling for homogeneous nucleation can be evaluated as Reference Zeoli, Gu and Kamnis24
 $$\Delta T_{\hom }^2 = {{16{\rm{\pi }}{{\rm{\sigma }}_m}^3{\Omega _v}^2{T_{\rm{L}}}^2} \over {3{k_{\rm{B}}}\left( {{T_{\rm{L}}} - {T_{{\rm{hom}}}}} \right){H_{\rm{f}}}^2{\rm{ln}}\left( {{{10}^{44}}{V_{\rm{d}}}{{\Delta {T_{{\rm{hom}}}}} \over {\dot T}}} \right)}}\quad ,$$
where σ
m
, Ω
v
, k
B, H
f, V
d,
 $\dot T$
are solid–liquid interface energy, atomic volume, Boltzmann constant, latent heat of fusion, volume of the droplet, and cooling rate, respectively.
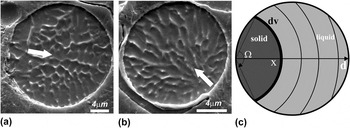
Figures 5(a) and 5(b) illustrate examples of a single nucleation event within the droplet at the surface; the growth direction is shown by arrows. Figure 5(c) shows the preserved curvature of the solidification front from the surface, which is an imaginary envelope of primary dendrite stems. Reference Levi and Mehrabian16 During recalescence, the front moves at a very high speed, and the heat of fusion released heat up the droplet to its liquidus almost adiabatically within less than 10−5 S. Then, in the segregation growth stage, the dendrite network forms driven by heat extraction and the SDASs are determined by the cooling rate of the droplet.
Solidification processes with single nuclei at the surface of a droplet. (a) and (b) – Images of cross sections, arrows deduce the directions of solidification. (c) Schematic illustration of the solidification front.

The heat flow equation during recalescence for a solidifying droplet is given as below
 $${C_{pd}}{{{\rm{d}}{T_{\rm{d}}}} \over {{\rm{d}}t}} = \Delta {H_{\rm{d}}}{{{\rm{d}}{f_{\rm{s}}}} \over {{\rm{d}}x}} \cdot {{{\rm{d}}x} \over {{\rm{d}}t}} - {{6h} \over {{{\rm{\rho }}_{\rm{d}}}}}\left( {{T_{\rm{d}}} - {T_{\rm{g}}}} \right)\quad ,$$
where
 ${C_{pd}} = \left( {1 - {f_{\rm{s}}}} \right){C_{\rm{L}}} + {C_{\rm{S}}}\,{f_{\rm{s}}}$
and
 ${\rm{}}\Delta H_{\rm{d}} = \Delta H_{\rm{f}} - \left( {C_{\rm{L}} - C_{\rm{S}} } \right)\left( {T_{\rm{L}} - T_{\rm{d}} } \right)$
are the integrated specific heat and latent heat of fusion, respectively. The quantities ΔH
f, f
s, T
d, ρd, D, h, T
g are latent heat per unit mass, solid fraction, the instantaneous temperature, density, and diameter of the droplet, heat transfer coefficient, and gas temperature, respectively.
The moving rate of the solid phase along the axis in Fig. 5(c) can be formulated as Reference Levi and Mehrabian16
 $${{{\rm{d}}x} \over {{\rm{d}}t}} = {K_{\rm{i}}}\left( {{T_{\rm{L}}} - {T_{\rm{d}}}} \right)\quad ,$$
where K i is the solid–liquid interface mobility. Also from Fig. 5(c), the volume fraction of the solidified cap can be calculated as
 $${f_{\rm{s}}} = 4{\left( {{x \over D}} \right)^3} - 3{\left( {{x \over D}} \right)^4}\quad .$$
In this stage, the drastic release of heat of fusion heats up the droplet to the vicinity of its melting point. By setting
 ${\textstyle{{{\rm{d}}{T_{\rm{d}}}} \over {{\rm{d}}t}}} = 0$
, recalescence ends at the temperature T
r with the solid fraction f
r. Then, the segregated solidification continues, ruled by
 $$C_{pd} {{{\rm{d}}T_{\rm{d}} } \over {{\rm{d}}t}} = \Delta H_{\rm{d}} {{{\rm{d}}f_{\rm{s}} } \over {T_{\rm{d}} }} \cdot {{{\rm{d}}T_{\rm{d}} } \over {{\rm{d}}t}} - {\raise0.7ex\hbox{${6h}$} \!\mathord{\left/ {\vphantom {{6h} {{\rm{\rho }}_{\rm{d}} }}}\right.\kern-\nulldelimiterspace}\!\lower0.7ex\hbox{${{\rm{\rho }}_{\rm{d}} }$}}\left( {T_{\rm{d}} - T_{\rm{g}} } \right)\quad ,$$
where the solid fraction has a different expression with the recalescence stage
 $$f_{\rm{s}} = 1 - \left( {1 - f_{\rm{r}} } \right)\left[ {{{T_{\rm{M}} - T_{\rm{r}} } \over {T_{\rm{M}} - T_{\rm{d}} }}} \right]^{{\raise0.7ex\hbox{$1$} \!\mathord{\left/ {\vphantom {1 {1 - k}}}\right.\kern-\nulldelimiterspace}\!\lower0.7ex\hbox{${1 - k}$}}} \quad ,$$
where T M is the melting temperature of a pure solvent, here it refers to iron.
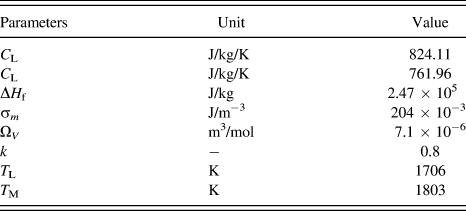
Then the solidification ends when T d reaches its solidus temperature. The parameter set used for calculation is presented in Table I.
Thermo-physical properties of Fe–6.5 wt% Si alloy. Reference Okamoto26,Reference Kurz and Fisher29,Reference Chang and Chen30

V. RESULTS DISCUSSION
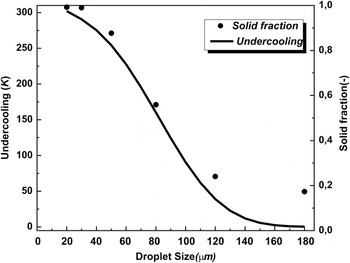
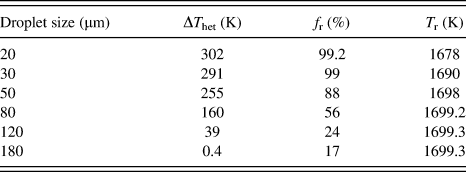
From Eqs. (1)–(9), the undercooling and solid fraction as a function of the droplet size is obtained in Fig. 6 and Table II. It is apparently seen that as the droplet size decreases to 20 µm, the undercooling (solid line in Fig. 6) reaches 302 K, very close to the reported maximum value of iron, 295 K, reported by Turnbull. Reference Turnbull and Cech31 Also, the solid fraction, as shown in dots, during recalescence is strongly affected by the prior undercooling of the droplet. Comparing to Al–4.5 wt% Cu alloy, Reference Lee and Ahn20 in the same 20 µm droplet, the solid fraction was reported to be around 23%, much smaller than that of Fe–6.5 wt% Si, and the reasons are attributed to the different physical properties of the alloys, such as latent heat of fusion, partition coefficient k, and the liquidus and solidus temperatures.
Melt undercooling and solid fraction as a function of droplet size.

Calculated undercooling, the solid fraction, and temperature at the end of recalescence for droplets of different sizes.

Referring to Fig. 4, the microstructure variation of the droplets is also strongly affected by the undercooling. In Fig. 4(c), the equiaxed dendritic morphology can be found in large particles. According to the work of Herlach,
Reference Herlach, Eckler, Karma and Schwarz32
the grain refined equiaxed microstructure, coming from the fragmentation of dendrites in the undercooled melt, is strongly related to the melt undercooling during solidification when the characteristic break-up time
 ${\rm{\Delta }}{t_{{\rm{bu}}}}\left( {{\rm{\Delta }}T} \right)$
must be smaller than the plateau duration time
 ${\rm{\Delta }}{t_{{\rm{pl}}}}\left( {{\rm{\Delta }}T} \right)$
. The latter becomes shorter as the cooling rate grows larger, which is the case in smaller droplets. On the other hand,
 ${\rm{\Delta }}{t_{{\rm{bu}}}}\left( {{\rm{\Delta }}T} \right)$
of certain undercooling is a constant. As a result, the higher cooling rate achieved in smaller droplets will lessen the chance of fragmentation as in larger droplets [Fig. 4(c)]. Also, as listed in Table I, the solid fraction at the end of recalescence f
r decreases from 99.2% in 20 µm to 17% in 180 µm, and the temperature T
r increases from 1678 to 1699 K, indicating the lower possibility of dendrite fragmentation in smaller droplets. This result is coincident with our observations that the fine-grained equiaxed structures are mostly found in large droplets.
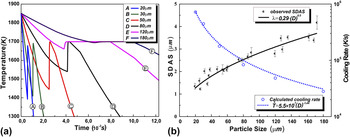
The calculated cooling curves and the cooling rate are given as a function of the droplet size. As shown in Fig. 7(a), the cooling procedure of the droplet includes three parts: liquid state cooling, recalescence, and segregation solidification. The cooling rate in Fig. 7(b) here refers to the postrecalescence stage of solidification when the SDA is formed. The cooling rate of the droplet at postrecalescence state is very high, ranging from 104 to 106 K/s in magnitude.
(a) Cooling curves of different sized droplets and (b) SDAS and cooling of the droplets.

The postrecalescence cooling rate of the droplet can be estimated by combining the observed SDAS as a function of the droplet size,
 ${\rm{\lambda }} = 0.29 \cdot {D^{0.5}}$
. Then, one can readily obtain the relationship between SDAS and cooling rate,
 ${\rm{\lambda }} = 74.2 \cdot {\left( {\dot T} \right)^{ - 0.347}}$
. The relationship of the SDAS as a function of cooling rate is obtained in gas-atomized iron-based stainless steel,
Reference Pryds and Pedersen33
 ${\rm{\lambda }} = 49.3 \cdot \left( {\dot T} \right)^{ - 0.3}$
and Cu–Sn,
Reference Tiedje, Hansen and Pedersen9
 ${\rm{\lambda }} = 37.31 \cdot {\left( {\dot T} \right)^{ - 0.338}}$
, indicating that the result of this work lies within the typical range of the gas atomization process.
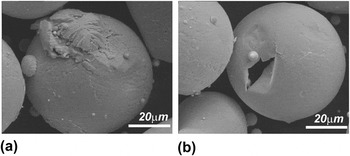
After the initiation of the dendrites, the ripening effect became significant to influence the microstructure of the droplet as evidenced in Fig. 8. When a droplet is broken up by collision during solidification, the coarsening ended by the separation of dendrites and interdendritic liquids, as shown in Fig. 8(a), the SDA of broken part is therefore thinner than that of a fully solidified droplet below. The same thing happened for the hollow droplet shown in Fig. 8(b). The melt jetted out from a crack of solidified shell, and one can see the very fine dendrite pattern comparing to the full droplet beside. Therefore, to describe the microstructure evolution of the droplet, the coarsening effect must be taken into account here.
(a) The microstructure of the normal solidified droplet compared with (a) a broken piece and (b) a hollow shell to show the coarsening effect.

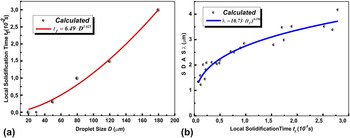
The plot of local solidification time versus droplet size is presented in Fig. 9(a) and its effect on the SDAS is also shown in Fig. 9(b), using the power law fitted relationship for droplets size and local solidification time. The SDAS varies with nearly the cubic root of local solidification time, which agrees quite well with the dendrite coarsening mechanism,
Reference Kattamis and Flemings34,Reference Marsh and Glicksman35
in which the SDAS is proportional to
 $t_{\rm{f}}^{{\rm{1/3}}}$
.
(a) The calculated and fitted local solidification times for different droplet sizes and (b) the SDAS as a function of local solidification time.

VI. CONCLUSION
The Fe–6.5 wt% Si gas-atomized particles were fabricated and characterized, and the microstructure morphology of the particle is characterized by the SDAS as a function of droplet size,
 ${\rm{\lambda }} = 0.29 \cdot {D^{0.5}}$
. By applying the numerical model, the microstructure is further related to the solidification process of the droplet.
-
(1) The undercooling achieved prior to solidification can be very large and greatly influences the solid fraction at the end of recalescence.
-
(2) The cooling rate at the postrecalescence stage plays a critical role in the formation of SDA and is also very important for the “plateau” duration time, which decides the formation of the equiaxed dendritic morphology. The calculated result of the SDAS as a function of cooling rate
 ${\rm{\lambda }} = 74.2 \cdot {\left( {\dot T} \right)^{ - 0.347}}$
compares fairly well to other gas-atomized alloys.
-
(3) The development of the SDA is characterized as a coarsening growth by relating the SDAS to the cubic root of local solidification time,
${\rm{\lambda }} = 10.73 \cdot {\left( {{t_f}} \right)^{0.296}}$
.


ACKNOWLEDGMENT
Appreciation is expressed to Dr. W. Löser for many valuable discussions and for his constructive comments on the manuscript. The authors would like to acknowledge the financial support received from China National Natural Science Foundation (No. 51074104), China National Basic Research Development Project (973 Program: No. 2010CB630802), and Innovation and Creativity Fund of Shanghai University. Instrumental Analysis & Research Center of Shanghai University provided facility for the study of the microstructures.