



1. Introduction
Richtmyer–Meshkov instability (RMI) occurs when a perturbed interface separating two fluids of different densities is impulsively accelerated by shock waves (Richtmyer Reference Richtmyer1960; Meshkov Reference Meshkov1969). It has attracted extensive attention for decades (Zhou Reference Zhou2017a,Reference Zhoub; Zhou et al. Reference Zhou, Clark, Clark, Glendinning, Skinner, Huntington, Hurricane, Dimits and Remington2019; Zhou et al. Reference Zhou2021; Zhou Reference Zhou2024) due to its crucial role in significant scientific and engineering fields such as inertial confinement fusion (ICF) (Nuckolls et al. Reference Nuckolls, Wood, Thiessen and Zimmerman1972; Lindl et al. Reference Lindl, Landen, Edwards, Moses and Team2014), supernova explosion (Arnett et al. Reference Arnett, Bahcall, Kirshner and Woosley1989; Kuranz et al. Reference Kuranz2018) and scramjet (Billig Reference Billig1993; Yang, Kubota & Zukoski Reference Yang, Kubota and Zukoski1993). Classical RMI induced by a single shock, referred to as single-shock RMI in this work, was first theoretically modelled by Richtmyer (Reference Richtmyer1960) and later experimentally verified by Meshkov (Reference Meshkov1969). In subsequent decades of research, single-shock RMI was found to be sensitive to initial conditions such as initial amplitude (Rikanati et al. Reference Rikanati, Oron, Sadot and Shvarts2003; Wang et al. Reference Wang, Wang, Zhai and Luo2023a), interface morphology (Pandian, Stellingwerf & Abarzhi Reference Pandian, Stellingwerf and Abarzhi2017; Liang et al. Reference Liang, Zhai, Ding and Luo2019), shock intensity (Holmes et al. Reference Holmes, Dimonte, Fryxell, Gittings, Grove, Schneider, Sharp, Velikovich, Weaver and Zhang1999; Puranik et al. Reference Puranik, Oakley, Anderson and Bonazza2004) and Atwood number (Dimonte & Ramaprabhu Reference Dimonte and Ramaprabhu2010; Chen et al. Reference Chen, Xing, Wang, Zhai and Luo2023).
Notably, interface instability in practical applications is generally triggered by multiple shock waves. In ICF, the shock wave propagating towards the convergence centre would reflect back and re-impact the interfaces separating the ablator from deuterium–tritium ice and deuterium–tritium ice from deuterium–tritium gas. Therefore, RMI induced by two shock waves propagating in opposite directions, termed reflected-reshock RMI in the present study, has also garnered significant attention (Collins & Jacobs Reference Collins and Jacobs2002; Balakumar et al. Reference Balakumar, Orlicz, Tomkins and Prestridge2008, Reference Balakumar, Orlicz, Ristorcelli, Balasubramanian, Prestridge and Tomkins2012; Lombardini et al. Reference Lombardini, Hill, Pullin and Meiron2011; Balasubramanian et al. Reference Balasubramanian, Orlicz, Prestridge and Balakumar2012). Specifically, substantial research has focused on investigating the influence of reshock conditions on post-reshock flow evolution. Reflected-reshock RMI at a single-mode interface was numerically investigated by Ukai, Balakrishnan & Menon (Reference Ukai, Balakrishnan and Menon2011). The results showed that the post-reshock amplitude growth rate is weakly dependent on pre-reshock interface geometry but exhibits a linear relationship with the interface jump velocity induced by the reshock. Experimentally, Leinov et al. (Reference Leinov, Malamud, Elbaz, Levin, Ben-Dor, Shvarts and Sadot2009) studied reflected-reshock RMI at an interface with randomly distributed small-scale perturbations. It was observed that the post-reshock evolution of the mixing zone is independent of its pre-reshock width but is strongly influenced by the reflected shock intensity. Subsequently, Balasubramanian et al. (Reference Balasubramanian, Orlicz, Prestridge and Balakumar2012) investigated reflected-reshock RMI at a single-mode gas curtain with various reshock timings using simultaneous planar laser-induced fluorescence (PLIF) and particle image velocimetry (PIV) techniques. The results clearly illustrated changes in mixing evolution and their dependence on the pre-reshock interface complexity. Later, Reilly et al. (Reference Reilly, McFarland, Mohaghar and Ranjan2015) explored the influence of reshock timing on reflected-reshock RMI at a membraneless inclined planar interface, finding that a more developed pre-reshock interface leads to a more mixed post-reshock evolution. Using simultaneous PLIF and PIV techniques, Mohaghar et al. (Reference Mohaghar, Carter, Musci, Reilly, McFarland and Ranjan2017, Reference Mohaghar, Carter, Pathikonda and Ranjan2019) studied the effects of initial interface perturbation and shock intensity on the post-reshock mixing. The results indicated that the post-reshock flow maintains (loses) memory of the large-scale (small-scale) perturbation, and its evolution is related to the incident shock intensity. Recently, Guo et al. (Reference Guo, Cong, Si and Luo2022a,Reference Guo, Si, Zhai and Luob) conducted experiments on reflected-reshock RMI using well-defined initial interfaces created by the soap-film technique, revealing that the post-reshock evolution is sensitive to the pre-reshock interface profile. Additionally, it was observed that the high-amplitude effect of the pre-reshock interface promotes the mode interaction and enhances the nonlinear effects.
In addition to reflected-reshock RMI, interface instability induced by shock waves propagating in the same direction, referred to as ‘S-RMI’ in this study, is also prevalent in practical applications. For instance, in ICF, a drive scheme with shock waves propagating in the same direction is commonly employed to achieve the required drive pressure for ignition while maintaining the target shell at a relatively low entropy (Betti & Hurricane Reference Betti and Hurricane2016; Zhang et al. Reference Zhang2020; Abu-Shawareb et al. Reference Abu-Shawareb2022). Given that interface perturbation can be significantly amplified in the prior evolution process, the additional shock impact may lead to virulent perturbation growth, thereby substantially reducing energy gain and potentially resulting in ignition failure (Dimonte & Ramaprabhu Reference Dimonte and Ramaprabhu2010). Therefore, investigating S-RMI is of great significance. However, currently, research on S-RMI remains scarce and insufficient compared with that on single-shock RMI and reflected-reshock RMI.
Theoretically, Mikaelian (Reference Mikaelian1985) first proposed a linear superposition model to predict the linear amplitude growth rate of a twice-shocked interface ( $\dot {a}_2^l$, where
 $\dot {a}$ represents the amplitude growth rate, with subscript ‘2’ and superscript ‘
 $l$’ denoting parameters of twice-shocked interface and in the linear evolution period, respectively). Numerically, Charakhch'yan (Reference Charakhch'yan2000, Reference Charakhch'yan2001) found that the linear superposition model is valid if reshock occurs at the linear evolution stage of the once-shocked interface. In contrast, if reshock occurs in the nonlinear evolution stage of the once-shocked interface, the linear superposition model is invalid, and the reshock-induced linear amplitude growth rate (
 $\Delta \dot {a}$) depends weakly on the scaled pre-reshock amplitude (
 $ka_1^r$, where
 $k$ and
 $a$ are wavenumber and amplitude, respectively, with subscript ‘1’ and superscript ‘
 $r$’ denoting parameters of once-shocked interface and at the onset of reshock, respectively). Based on this observation, Charakhch'yan (Reference Charakhch'yan2000, Reference Charakhch'yan2001) proposed an empirical model to forecast
 $\dot {a}_2^l$ in S-RMI with reshock occurring in the nonlinear evolution stage of the once-shocked interface. Subsequently, Karkhanis et al. (Reference Karkhanis, Ramaprabhu, Buttler, Hammerberg, Cherne and Andrews2017) numerically explored the ejecta phenomenon on the free surface of metal impulsively accelerated by two successive shocks, which can be treated as a limiting case of S-RMI. It was found that if reshock occurs in the nonlinear evolution stage of the once-shocked interface, the pre-reshock bubble deviates from a single-mode one and its profile effect can be described using the effective wavelength (Cherne et al. Reference Cherne, Hammerberg, Andrews, Karkhanis and Ramaprabhu2015). Additionally, a model proposed for the ejecta phenomenon induced by a single shock (Cherne et al. Reference Cherne, Hammerberg, Andrews, Karkhanis and Ramaprabhu2015) can also reasonably predict the reshock-induced ejecta production. Further, Karkhanis & Ramaprabhu (Reference Karkhanis and Ramaprabhu2019) found that the development of the post-reshock bubble can be accurately predicted by a potential flow model proposed for single-shock RMI (Mikaelian Reference Mikaelian1998). Additionally, an empirical model that accounts for both nonlinearity and compressibility (Karkhanis et al. Reference Karkhanis, Ramaprabhu, Cherne, Hammerberg and Andrews2018), also proposed for single-shock RMI, offers reasonable prediction for the terminal growth rate of the post-reshock spike. Williams & Grapes (Reference Williams and Grapes2017) investigated the double-shock ejecta production in simulations considering material failure. It was found that if the spall failure occurs before reshock, the post-first-shock pressure field is subjected to perturbations with high amplitude and irregular structure. These perturbations were observed to have a significant influence on the post-reshock surface development. Recently, Wu et al. (Reference Wu, He, Wang, Sun and Wang2023) conducted a numerical investigation into the effect of the time interval between two shock impacts on the ejecta production from twice-shocked Sn. It was observed that if the time interval is short, the model proposed for ejecta induced by a single shock (Cherne et al. Reference Cherne, Hammerberg, Andrews, Karkhanis and Ramaprabhu2015) can well predict the reshock-induced ejecta mass when the profile effect of the pre-reshock interface is considered. However, when the time interval is long, the model significantly underestimates the reshock-induced ejecta mass even after considering the profile effect of the pre-reshock interface. This underestimation was ascribed to the promotion of reshock-induced ejecta generation by the first-shock-induced ejecta.
Experimentally, Dimonte et al. (Reference Dimonte, Frerking, Schneider and Remington1996) first observed the S-RMI phenomenon in the investigation of RMI induced by strong radiation-driven shocks. However, their focus was primarily on the effects of high Mach number and high initial amplitude on perturbation evolution, with less attention given to S-RMI. To study the ejecta on a twice-shocked metal, Buttler et al. (Reference Buttler2014a,Reference Buttlerb) developed an explosively driven tool that can generate two successive shocks. However, this experimental tool has limitations in studying S-RMI due to the complexity of the multi-physics coupling, challenges in generating controllable shocks and difficulties in diagnosing detailed experimental information (Wang et al. Reference Wang, Cao, Chen, Zhai and Luo2022). Relative to laser-driven or explosion-driven experiments, a shock-tube experiment offers a relatively simple physical environment and enables fine observation of flow evolution. Recently, Wang et al. (Reference Wang, Cao, Chen, Zhai and Luo2022) designed a shock-tube facility capable of generating controllable successive shocks while ensuring that the interface would not be heavily affected by waves other than two primary shocks throughout the experiment. Using this facility, S-RMI on a single-mode light–heavy interface with reshock occurring in the linear evolution stage of the once-shocked interface was studied. It was found that  $\dot {a}_2^l$ can be accurately predicted by the linear superposition model. Additionally, a nonlinear model proposed for single-shock RMI (Zhang & Guo Reference Zhang and Guo2016) provides a reasonable prediction for the weakly nonlinear evolution of the twice-shocked interface.
For ICF, the time interval between two successive shocks impacting an interface, as well as the intensity of the second shock, generally varies among different ignition schemes (Park et al. Reference Park2014; Betti & Hurricane Reference Betti and Hurricane2016; Smalyuk et al. Reference Smalyuk2019). In other words, S-RMI occurring in ICF has diverse pre-reshock interface evolution states and second shock intensities (referred to as reshock conditions for clarity). Therefore, it is necessary and interesting to investigate the effects of reshock conditions on post-reshock interface evolution. Previous numerical studies (Charakhch'yan Reference Charakhch'yan2000, Reference Charakhch'yan2001; Karkhanis et al. Reference Karkhanis, Ramaprabhu, Buttler, Hammerberg, Cherne and Andrews2017; Karkhanis & Ramaprabhu Reference Karkhanis and Ramaprabhu2019; Wu et al. Reference Wu, He, Wang, Sun and Wang2023) have provided some insights into the evolution laws of S-RMI with various pre-reshock interface evolution states, but relevant experimental research is still lacking. Furthermore, to our knowledge, there is currently no available investigation on the effect of the second shock intensity on post-reshock interface evolution. What is the dependence of the post-reshock interface evolution on reshock conditions? Can existing linear and nonlinear models correctly describe the evolution of the twice-shocked interface under diverse reshock conditions? These issues remain unclear, which motivates the present study. In this work, S-RMI with diverse reshock conditions is investigated via shock-tube experiments. The pre- and post-reshock flow features are first qualitatively discussed. Subsequently, the evolution law of the once-shocked interface and the characteristics of the pre-reshock interface are investigated. Following this, the dependence of the post-reshock linear amplitude evolution on reshock conditions is analysed, and models for predicting  $\dot {a}_2^l$ are examined. Finally, the post-reshock nonlinear evolution law under different reshock conditions is investigated, and the applicability of an existing nonlinear model to forecast the evolution of the twice-shocked interface is explored.
2. Experimental methods
Experiments are performed in the specific shock-tube facility (Wang et al. Reference Wang, Cao, Chen, Zhai and Luo2022) illustrated in figure 1(a). The facility mainly includes two driver sections (A and B), a driven section, a transitional section, a stable section, a test section, two acrylic devices (I and II) and electronically controlled membrane rupture equipment. The principle of the facility in generating successive shocks, as well as varying the second shock intensity and the time interval between two shock impacts, has been illustrated in previous work (Wang et al. Reference Wang, Cao, Chen, Zhai and Luo2022), where readers can find further details. The soap-film technique, which has been extensively verified (Liu et al. Reference Liu, Liang, Ding, Liu and Luo2018; Liang et al. Reference Liang, Zhai, Ding and Luo2019), is used to create the initial single-mode interface. As shown in figure 1(b), the transparent interface formation devices (1 and 2) are manufactured by combining two acrylic plates with pedestals. The formation process of the soap-film interface was detailed in previous work (Wang et al. Reference Wang, Wang, Zhai and Luo2023a) and is omitted here. The flow evolution is recorded by high-speed schlieren photography. The high-speed video camera (FASTCAM SA5, Photron Limited) operates at a frame rate of 50 000 frames per second, with an exposure time of  $1\,\mathrm {\mu }$s. The spatial resolution of the schlieren images is approximately 0.39 mm pixel
 $^{-1}$. In the following, the specific schemes for varying the reshock conditions in experiments are described in detail.
Sketches of the shock-tube facility for generating two successive shocks (a) and the interface formation devices (b).

2.1. Manipulation of pre-reshock interface evolution state
For a once-shocked interface with a small initial amplitude, its evolution can be approximately divided into five successive stages: linear stage (interface evolves symmetrically), weakly nonlinear stage (interface evolves asymmetrically), moderately nonlinear stage (bubble and spike structures appear and become significant), strongly nonlinear stage (roll-up structures emerge) and turbulent mixing stage (multiscale vortices appear and materials are mixed intensely). Throughout the evolution process, the amplitude of the once-shocked interface continuously increases and its profile gradually deviates from a single-mode configuration (Collins & Jacobs Reference Collins and Jacobs2002; Liu et al. Reference Liu, Liang, Ding, Liu and Luo2018). The pre-reshock interface serves as the ‘initial interface’ for the second shock–interface interaction, and the combined effect of its high amplitude and non-single-mode profile on post-reshock evolution is collectively referred to as its shape effect.
In the present work, four evolution states of the pre-reshock interface (linear, weakly nonlinear, moderately nonlinear and strongly nonlinear) are considered to explore its shape effect on the post-reshock flow evolution. The evolution state of the pre-reshock interface depends primarily on factors including the initial amplitude ( $a_0$), perturbation wavelength (
 $\lambda$), time interval between two shock impacts (
 $\Delta t$), first shock intensity and post-first-shock Atwood number (
 $A_1=(\rho ^d_1-\rho ^u_1)/(\rho ^d_1+\rho ^u_1)$, where
 $\rho$ is the density and superscripts ‘
 $u$’ and ‘
 $d$’ denote parameters of gases upstream and downstream of the interface, respectively). In this study, the evolution state of the pre-reshock interface is manipulated by altering
 $a_0$,
 $\lambda$ and
 $\Delta t$ to realize reshocks occurring at different evolution stages of the once-shocked interface. The adjustment of
 $a_0$ and
 $\lambda$ can be easily realized due to the flexibility of the soap-film technique in interface generation. Time interval
 $\Delta t$ is varied by altering the distance between the generation positions of two shocks (
 $L$).
2.2. Alteration of second shock intensity
Previous studies on single-shock RMI (Sadot et al. Reference Sadot, Rikanati, Oron, Ben-Dor and Shvarts2003; Guo et al. Reference Guo, Zhai, Ding, Si and Luo2020; Wang et al. Reference Wang, Wang, Zhai and Luo2023b) showed that the interface shape effect and the secondary compression effect introduced by transverse waves are coupled and jointly influence interface evolution. For S-RMI, it can be inferred that the pre-reshock interface shape effect and the secondary compression effect also couple and together affect the evolution of the twice-shocked interface. Consequently, to isolate the pre-reshock interface shape effect on post-reshock evolution, S-RMI with a very weak second shock is considered to minimize the secondary compression effect. In addition, S-RMI with weak and moderately strong second shocks are also considered to study how the twice-shocked interface evolves under the coupling of these effects.
The first shock is generated between the driven section and driver section B, containing air with pressures of 101.3 and 202.7 kPa, respectively. The polyester membrane separating the two sections has a thickness of  $12.5\,\mathrm {\mu }$m, and the Mach number of the first shock impacting the interface (
 $M_1$) is measured as
 $1.17\pm 0.01$. According to previous work (Wang et al. Reference Wang, Cao, Chen, Zhai and Luo2022), the Mach number of the second shock impacting the interface (
 $M_2$) is positively correlated with that of the second shock initially generated between driver sections A and B (
 $M_{2i}$). The relation between
 $M_{2i}$ and flow parameters (Glass & Hall Reference Glass and Hall1959) is given by
 \begin{equation} \frac {p_{a}}{p_{b}} = \left[1+\frac {2\gamma_{b}}{\gamma_{b}+1}(M_{2i}^2-1)\right] \left[1-\frac {\gamma_{a}-1}{\gamma_{b}+1}\frac{c_{b}}{c_{a}} \left(M_{2i}-\frac{1}{M_{2i}}\right)\right]^{{-2\gamma_{a}}/{(\gamma_{a}-1)}}, \end{equation}
where subscripts ‘ $a$’ and ‘
 $b$’ denote parameters of fluids in driver sections A and B, respectively;
 $p$,
 $\gamma$ and
 $c$ represent the pressure, specific heat ratio and sound speed of the gas, respectively. Therefore,
 $M_2$ can be modulated by changing the gas composition and pressure in driver section A. To generate a weak second shock, air is used as the gas in driver section A, with
 $p_{a}$ of 405.3 kPa. The corresponding membrane separating driver sections A and B has a thickness of
 $30\,\mathrm {\mu }$m, and
 $M_2$ is measured as
 $1.14\pm 0.01$. For producing a very weak second shock, SF
 $_6$, which is considerably heavier than air, is utilized in driver section A, with
 $p_{a}$ of 278.6 kPa. The thickness of the corresponding membrane is
 $10\,\mathrm {\mu }$m, and
 $M_2$ is measured as
 $1.03\pm 0.01$. To generate a moderately strong second shock, helium, which is significantly lighter than air, is employed in driver section A, with
 $p_{a}$ of 683.9 kPa. The corresponding membrane has a thickness of
 $60\,\mathrm {\mu }$m, and
 $M_2$ is measured as
 $1.40\pm 0.02$.
In summary, three series of experiments with different second shock intensities (very weak, weak and moderately strong) are performed, each of which considers four pre-reshock interface evolution states (linear, weakly nonlinear, moderately nonlinear and strongly nonlinear). For clarity, the series of experiments with very weak, weak and moderately strong second shocks are labelled as cases VW, W and MS, respectively. Further, cases VW, W and MS with  $ka_{1,{e}}^r=f$ (subscript ‘
 $e$’ denotes parameters extracted from experiments) are referred to as cases VW-
 $f$, W-
 $f$ and MS-
 $f$, respectively. Some important parameters for the 12 experimental cases with diverse reshock conditions are summarized in table 1. The gas component downstream of the initial interface,
 $A_1$, and the post-reshock Atwood number (
 $A_2=(\rho ^d_2-\rho ^u_2)/(\rho ^d_2+\rho ^u_2)$) are determined by assuming that the upstream gas is pure air and matching the experimental and theoretical velocities of the once-shocked interface (
 $u_{1,{e}}$ and
 $u_{1,{o}}$, with subscript ‘
 $o$’ denoting parameters predicted by one-dimensional gas dynamics theory). The results of the shock and interface velocities, along with the Atwood numbers, suggest favourable experimental repeatability.
Some important parameters for experiments with diverse reshock conditions:  $L$, distance between the generation positions of two shocks;
 $\Delta t$, time interval between two shock impacts;
 $\lambda$ and
 $ka_0$, perturbation wavelength and scaled initial amplitude, respectively;
 $v_{1,{e}}^{i}$ and
 $v_{2,{e}}^{i}$, experimental velocities of the first and second incident shock waves, respectively;
 $u_{1,{e}}$ and
 $u_{1,{o}}$ (
 $u_{2,{e}}$ and
 $u_{2,{o}}$), velocities of once-shocked (twice-shocked) interface obtained from experiments and predicted by one-dimensional gas dynamics theory, respectively;
 $\phi$, mass fraction of SF
 $_6$ at the downstream side of the initial interface;
 $A_1$ and
 $A_2$, post-first-shock and post-reshock Atwood numbers, respectively;
 $M_1$ (
 $M_2$), Mach number of the first (second) shock impacting the interface. Units of length, time and velocity are mm,
 $\mathrm {\mu }$s and m s
 $^{-1}$, respectively, and similarly hereinafter.

3. Results and discussion
3.1. Flow features and interface morphology
Schlieren images obtained from the experiments of cases VW, W and MS are shown in figures 2, 3 and 4, respectively. The temporal origin ( $t=0\,\mathrm {\mu }$s) is defined as the moment when the first incident shock (IS
 $_1$) reaches the mean position of the initial interface. Note that the initial interface appears thick due to the sinusoidal filaments embedded on the interface formation device for constraining the soap film. Furthermore, the second incident shock (IS
 $_2$) in cases VW is not prominent in the experimental images due to its low intensity, and thus it is delineated by a blue dashed line for emphasis. It is evident that in cases with
 $ka_{1,{e}}^r<0.4$, the pre-reshock interface shows an almost symmetric profile, suggesting that it remains within the linear evolution stage. For cases with
 $0.4< ka_{1,{e}}^r<1.0$, the pre-reshock interface no longer evolves symmetrically, signifying that it has entered the weakly nonlinear evolution stage. In cases with
 $1.0< ka_{1,{e}}^r<1.5$, the emergence of the bubble and spike structures indicates that the pre-reshock interface has progressed into the moderately nonlinear evolution stage. In contrast, for cases with
 $ka_{1,{e}}^r>1.5$, the appearance of the roll-up structures indicates that the pre-reshock interface has advanced into the strongly nonlinear evolution stage.
Experimental schlieren images of cases VW: (a) VW-0.35, (b) VW-0.70, (c) VW-1.13 and (d) VW-1.78. Here IS $_1$ and IS
 $_2$ (TS
 $_1$ and TS
 $_2$) are the first and second incident (transmitted) shock waves, respectively. Numbers represent time in
 $\mathrm {\mu }$s.

Experimental schlieren images of cases W: (a) W-0.32, (b) W-0.71, (c) W-1.19 and (d) W-1.88.

Experimental schlieren images of cases MS: (a) MS-0.33, (b) MS-0.58, (c) MS-1.12 and (d) MS-1.89. Here  ${\rm RS}_2$ is the second reflected shock.

Case W-0.32 is taken as an example to illustrate the evolution process of S-RMI with reshock occurring at the linear or weakly nonlinear evolution stage of the once-shocked interface. As illustrated in figure 3(a), when IS $_1$ encounters the initial interface, the first transmitted shock (TS
 $_1$) and the first reflected shock (RS
 $_1$) are generated, in which RS
 $_1$ is difficult to identify clearly due to its weak intensity. Meanwhile, the once-shocked interface starts to evolve gradually under the drive of the baroclinic vorticity deposited by IS
 $_1$ and the pressure perturbations introduced by disturbed TS
 $_1$ and RS
 $_1$. When reshock occurs, the second transmitted shock (TS
 $_2$) and the second reflected shock (RS
 $_2$) are generated (
 $539\,\mathrm {\mu }$s), with RS
 $_2$ being too weak to be observed. Subsequently, the amplitude and asymmetry of the twice-shocked interface increase gradually, followed by the formation of distinct bubbles and spikes (
 $939\,\mathrm {\mu }$s). Notably, the twice-shocked interface evolves significantly faster than the once-shocked interface, indicating that the reshock promotes the interface instability. Then, case W-1.88 is taken as an example to illustrate the evolution process of S-RMI with reshock occurring at the moderately or strongly nonlinear evolution stage of the once-shocked interface. Due to the high amplitude of the pre-reshock interface, TS
 $_2$ is highly disturbed and its wavefront rapidly evolves into a series of Mach reflection configurations (
 $1067\,\mathrm {\mu }$s). The reflected shocks in the Mach reflection configurations, also referred to as transverse waves, continuously interact with the twice-shocked interface until TS
 $_2$ moves away from the latter, introducing the secondary compression effect (Motl et al. Reference Motl, Oakley, Ranjan, Weber, Anderson and Bonazza2009; McFarland, Greenough & Ranjan Reference McFarland, Greenough and Ranjan2013; Guo et al. Reference Guo, Zhai, Ding, Si and Luo2020). For S-RMI on a light–heavy interface considered in the present work, the secondary compression effect would inhibit (promote) the growth of bubbles (spikes) as they evolve towards the downstream (upstream) direction. With the further evolution of the twice-shocked interface, the roll-up structures on both sides of the spikes become more pronounced (
 $1347\,\mathrm {\mu }$s). Simultaneously, the spike stems narrow while the bubbles expand in the spanwise direction.
Comparing the evolution of S-RMI with similar pre-reshock interface evolution states but various second shock intensities, several distinct features emerge when the second shock is stronger. First, the twice-shocked interface evolves more rapidly. Second, the transverse waves are stronger, and the separation of TS $_2$ from the twice-shocked interface is slower. Third, the bubbles are flatter while the spikes are more slender. Specifically, in cases MS-1.12 and MS-1.89, the heads of the bubbles gradually flatten out and occupy nearly the entire space along the spanwise direction in the late stages. Similar bubble and spike evolutions were observed in previous studies on single-shock RMI with significant secondary compression effect (Motl et al. Reference Motl, Oakley, Ranjan, Weber, Anderson and Bonazza2009; Stanic et al. Reference Stanic, Stellingwerf, Cassibry and Abarzhi2012; Guo et al. Reference Guo, Zhai, Ding, Si and Luo2020). Overall, the qualitative results show that the evolution of the twice-shocked interface is related to both the pre-reshock interface evolution state and the second shock intensity.
3.2. Amplitude evolution
Temporal variations of the scaled perturbation amplitude ( $ka$) measured from experiments for cases VW, W and MS are shown in figures 5(a), 5(b) and 5(c), respectively. It is observed that the reshock promotes the perturbation amplitude growth, with a more pronounced effect when
 $ka_{1,{e}}^r$ is larger and/or the second shock is stronger. In all cases, the amplitude growth of the twice-shocked interface first undergoes a quasi-linear stage and then enters the nonlinear stage. The following discussion and analysis will address the three fundamental issues of S-RMI: the evolution law of the once-shocked interface, the quasi-linear evolution of the twice-shocked interface and the nonlinear evolution of the twice-shocked interface.
Temporal variations of scaled perturbation amplitude obtained from experiments: (a) cases VW; (b) cases W; (c) cases MS.

3.2.1. Evolution law of once-shocked interface
Understanding the evolution law of the once-shocked interface is essential for investigating S-RMI since the pre-reshock interface serves as the ‘initial interface’ for reshock. For the linear amplitude growth rate of the once-shocked interface ( $\dot {a}_{1}^{l}$), the impulsive model proposed by Richtmyer (Reference Richtmyer1960) is used to provide a theoretical reference (
 $\dot {a}_{1,{i}}^{l}$, with subscript ‘
 $i$’ denoting parameters predicted by the impulsive model) for the experimental result (
 $\dot {a}_{1,{e}}^{l}$). For the once-shocked interface, the impulsive model can be written as
 \begin{equation} \dot{a}_{1,{i}}^{l} = C_1 k a_0 A_1 u_{1,{o}}, \end{equation}
where  $C_1= 1 - u_{1,{o}} / v_{1,{e}}^{i}$ is the first shock compression factor, with
 $v_{1}^{i}$ being the velocity of IS
 $_1$. Here
 $\dot {a}_{1,{e}}^{l}$ is determined by linearly fitting the early-time variation of the once-shocked interface amplitude (
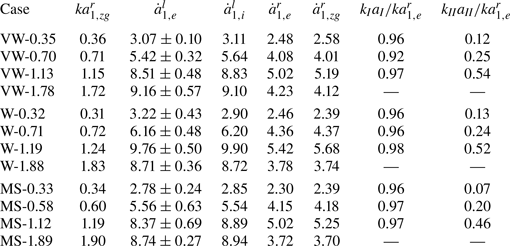
 $a_1$) measured from experiments. As shown in table 2,
 $\dot {a}_{1,{e}}^{l}$ agrees well with
 $\dot {a}_{1,{i}}^{l}$.
Experimental and theoretical results for the evolution of the once-shocked interface:  $a_{1,{zg}}^r$, pre-reshock amplitude predicted by the ZG model;
 $\dot {a}_{1,{e}}^{l}$ and
 $\dot {a}_{1,{i}}^{l}$, linear amplitude growth rates of the once-shocked interface obtained from experiments and predicted by impulsive model, respectively;
 $\dot {a}_{1,{e}}^{r}$ and
 $\dot {a}_{1,{zg}}^{r}$, pre-reshock amplitude growth rates obtained from experiments and predicted by ZG model, respectively;
 $k_{I} a_{I}$ and
 $k_{II} a_{II}$, scaled amplitudes of the fundamental and second-order modes, respectively.
Referring to previous studies (Liu et al. Reference Liu, Liang, Ding, Liu and Luo2018; Chen et al. Reference Chen, Xing, Wang, Zhai and Luo2023), the theoretical model constructed by Zhang & Guo (Reference Zhang and Guo2016) (ZG model) is employed to provide a theoretical reference for the nonlinear evolution law of the once-shocked interface, which can be written as
 \begin{equation} \dot{a}_{1,{zg}}^{b/s}(t) = \frac{\dot{a}_{1,{i}}^{l}}{1 + \theta_{1}^{b/s} k \dot{a}_{1,{i}}^{l}t}. \end{equation}
Here,
 \begin{equation} \theta_{1}^{b/s}=\frac{3}{4}\frac{(1 \pm A_1)(3 \pm A_1)}{3 \pm A_1 + \sqrt{2}(1 \pm A_1)^{1/2}} \frac{4(3 \pm A_1) + \sqrt{2}(9 \pm A_1)(1 \pm A_1)^{1/2}}{(3 \pm A_1)^2 + 2\sqrt{2} (3\mp A_1)(1\pm A_1)^{1/2}}, \end{equation}
with superscripts ‘ $b$’ and ‘
 $s$’ denoting parameters of the bubble and spike, respectively, and subscript ‘
 $zg$’ representing parameters predicted by the ZG model. The ZG model is applied once the start-up process (Yang, Zhang & Sharp Reference Yang, Zhang and Sharp1994; Lombardini & Pullin Reference Lombardini and Pullin2009) concludes, and the duration of this process (
 $t_1^*$) as well as
 $a_1$ at
 $t=t_1^*$ (
 $a_1^*$) are calculated using methods proposed by Lombardini & Pullin (Reference Lombardini and Pullin2009). Figure 6(a) shows the temporal variations of
 $a_1$, obtained from experiments and predicted by the ZG model, in dimensionless form. Here,
 $t$ and
 $a_1$ are normalized as
 $\tau _1=k\dot {a}_{1,{i}}^{l} (t-t_1^*)$ and
 $\alpha _1=k (a_1-a_1^*)$, respectively. Moreover, the temporal variations of the bubble and spike amplitudes of the once-shocked interface in dimensionless form (
 $\alpha _{1}^b$ and
 $\alpha _{1}^s$) are shown in figure 6(b). The scaling collapses the results of all experiments, indicating that the once-shocked interface exhibits similar evolution laws across different cases. Besides, the ZG model provides excellent predictions for the evolutions of the overall, bubble and spike amplitudes of the once-shocked interface across all cases.
Experimental and theoretical results of the amplitude evolutions of the once-shocked interface (a) and its bubble and spike (b).

Next, the characteristics of the pre-reshock interface are explored. Determining the pre-reshock interface profile is highly challenging in experiments using the explosion-driven scheme to generate successive shocks (Buttler et al. Reference Buttler2014a,Reference Buttlerb). In contrast, in the present work, the pre-reshock interface profile can be clearly captured. Fast Fourier transform is applied to obtain the modal information (amplitude, phase and frequency) of the pre-reshock interface. Since fast Fourier transform is inapplicable when the interface cannot be expressed by a single-valued function, only the results of the cases with reshock occurring at the linear, weakly nonlinear and moderately nonlinear stages are provided. In addition, since the magnitudes of the third-order and other higher-order modes are negligible relative to that of the fundamental mode before the roll-up structures emerge (Liu et al. Reference Liu, Liang, Ding, Liu and Luo2018), only the results of the fundamental and second-order modes are presented. The wavenumbers (amplitudes) of the fundamental and second-order modes are represented as  $k_{I}$ and
 $k_{II}$ (
 $a_{I}$ and
 $a_{II}$), respectively. Note that
 $k_{I}$ and
 $k_{II}$ are equivalent to
 $k$ and
 $2k$, respectively. Table 2 shows the ratios of the scaled amplitudes of the fundamental and second-order modes to that of the overall pre-reshock interface (
 $k_{I} a_{I}/ka_{1,{e}}^r$ and
 $k_{II} a_{II}/ka_{1,{e}}^r$). For cases with reshock occurring at the linear evolution stage of the once-shocked interface,
 $k_{II} a_{II}/ka_{1,{e}}^r$ is notably lower than
 $k_{I} a_{I}/ka_{1,{e}}^r$ and
 $ka_{1,{e}}^r$ still satisfies the small-amplitude criterion (i.e.
 $ka\ll 1$). In contrast, in cases where reshock occurs at the nonlinear evolution stage of the once-shocked interface,
 $k_{II} a_{II}/ka_{1,{e}}^r$ is generally higher than 0.2 and
 $ka_{1,{e}}^r$ deviates from the small-amplitude criterion. Overall, the evolution state of the pre-reshock interface reflects the extent to which it deviates from a small-amplitude single-mode one. In previous research on reflected-reshock RMI (Balasubramanian et al. Reference Balasubramanian, Orlicz, Prestridge and Balakumar2012; Reilly et al. Reference Reilly, McFarland, Mohaghar and Ranjan2015; Guo et al. Reference Guo, Cong, Si and Luo2022a,Reference Guo, Si, Zhai and Luob), it was found that the morphology and amplitude of the pre-reshock interface affect the post-reshock flow evolution. Therefore, it can be preliminarily inferred that in S-RMI, the shape effect of the pre-reshock interface would also influence the post-reshock perturbation development, warranting further detailed investigation.
Finally, the amplitude growth rate of the once-shocked interface at the onset of reshock, i.e. the pre-reshock amplitude growth rate ( $\dot {a}_1^r$), which contributes to
 $\dot {a}_2^l$, is investigated. The experimental
 $\dot {a}_1^r$ (
 $\dot {a}_{1,{e}}^r$) is obtained by fitting the pre-reshock amplitude evolution of the once-shocked interface, and its theoretical reference (
 $\dot {a}_{1,{zg}}^{r}$) is calculated using the ZG model. Table 2 shows that
 $\dot {a}_{1,{zg}}^{r}$ closely matches
 $\dot {a}_{1,{e}}^r$, further indicating the effectiveness of using the ZG model to predict the evolution of the once-shocked interface. Additionally,
 $\dot {a}_{1,{zg}}^{r}$ is compared with
 $\dot {a}_{1,{i}}^{l}$. In cases where reshock occurs at the linear evolution stage of the once-shocked interface, the difference between
 $\dot {a}_{1,{zg}}^{r}$ and
 $\dot {a}_{1,{i}}^{l}$ is limited. However, in cases with reshock occurring at the nonlinear evolution stage of the once-shocked interface, the discrepancy between
 $\dot {a}_{1,{zg}}^{r}$ and
 $\dot {a}_{1,{i}}^{l}$ is significant, suggesting that the nonlinearity of the pre-reshock amplitude growth may also affect the post-reshock interface evolution. Overall, for S-RMI with reshock occurring at the nonlinear evolution stage of the once-shocked interface, further investigation is needed to ascertain whether and how the shape of the pre-reshock interface and its nonlinear amplitude growth affect the perturbation evolution of the twice-shocked interface.
3.2.2. Quasi-linear amplitude growth of twice-shocked interface
To predict  $\dot {a}_2^l$, Mikaelian (Reference Mikaelian1985) first proposed the linear superposition model which assumes that both
 $\dot {a}_{1}^{l}$ and
 $\Delta \dot {a}$ can be predicted by the impulsive model and that
 $\dot {a}_2^l$ is equal to their linear superposition. The model can be written as
 \begin{equation} \dot{a}_{2,{ls}}^l=\dot{a}_{1,{i}}^{l}+\Delta \dot{a}_{i}=\dot{a}_{1,{i}}^{l}+C_2 k a_{1,zg}^r A_2 (u_{2,{o}} - u_{1,{o}}), \end{equation}
where  $\Delta \dot {a}_{i}$ denotes
 $\Delta \dot {a}$ predicted by the impulsive model;
 $u_{2,{o}}$ is the velocity of the twice-shocked interface predicted by one-dimensional gas dynamics theory;
 $C_2=1-(u_{2,{o}}-u_{1,{o}})/(v_{2,{e}}^{i}-u_{1,{o}})$ is the reshock compression factor, with
 $v_{2,{e}}^{i}$ being the velocity of IS
 $_2$ obtained from experiment; and
 $a_{1,zg}^r$ represents
 $a_{1}^r$ predicted by the ZG model and can be written as
 \begin{equation} a_{1,zg}^r=a_1^*+\int_{t_1^*}^{\Delta t} \frac{{\dot a}_{1,{zg}}^{b}(t)+{\dot a}_{1,{zg}}^{s}(t)}{2} {\rm d} t. \end{equation}
As shown in tables 1 and 2,  $u_{2,{o}}$ and
 $ka_{1,{zg}}^r$ agree well with their experimental counterparts. Notably, since the linear superposition model assumes that
 $\Delta \dot {a}$ can be predicted by the impulsive model, it is theoretically valid only when the pre-reshock interface still satisfies the small-amplitude criterion. Building upon the linear superposition model, Wang et al. (Reference Wang, Cao, Chen, Zhai and Luo2022) proposed a modified model that additionally considers the high-amplitude effect of the pre-reshock interface (H model). The H model can be expressed as
 \begin{equation} \dot{a}_{2,{h}}^l=\dot{a}_{1,{i}}^{l}+R_{dr} \Delta \dot{a}_{i}= \dot{a}_{1,{i}}^{l}+R_{dr} C_2 k a_{1,{zg}}^r A_2 (u_{2,{o}} - u_{1,{o}}), \end{equation}
where  $R_{dr}=1/[1+(k a_{1,zg}^r/3)^{4/3}]$ is the theoretical reduction factor proposed by Dimonte & Ramaprabhu (Reference Dimonte and Ramaprabhu2010) for describing the high-amplitude effect in single-shock RMI at a single-mode interface. Note that other theoretical reduction factors proposed for single-shock RMI (Rikanati et al. Reference Rikanati, Oron, Sadot and Shvarts2003; Buttler et al. Reference Buttler2012; Probyn et al. Reference Probyn, Williams, Thornber, Drikakis and Youngs2021) are not considered in this study as their values closely approximate that of
 $R_{dr}$ (Wang et al. Reference Wang, Wang, Zhai and Luo2023b). The H model has been demonstrated to outperform the linear superposition model for predicting
 $\dot {a}_2^l$ in S-RMI with a weak second shock and
 $ka_{1,{e}}^r<2/3$ (Wang et al. Reference Wang, Cao, Chen, Zhai and Luo2022). Based on the H model, we propose a further modified model that accounts for the nonlinearity of the pre-reshock amplitude growth (NH model), which can be written as
 \begin{equation} \dot{a}_{2,{nh}}^l=\dot{a}_{1,zg}^{r}+R_{dr} \Delta \dot{a}_{i}= \dot{a}_{1,zg}^{r}+ R_{dr} C_2 k a_{1,zg}^r A_2 (u_{2,{o}} - u_{1,{o}}). \end{equation}
The  $\dot {a}_{2}^{l}$ obtained from experiments (
 $\dot {a}_{2,{e}}^{l}$) and predicted by the linear superposition, H and NH models (
 $\dot {a}_{2,{ls}}^l$,
 $\dot {a}_{2,{h}}^l$ and
 $\dot {a}_{2,{nh}}^l$) are provided in table 3 for comparison. These models exhibit poorer performance when the nonlinearity of the pre-reshock interface evolution is more significant and/or the second shock is stronger. Moreover, none of these models are universally applicable under the considered reshock conditions. Nevertheless, the NH model generally offers the most accurate prediction for
 $\dot {a}_{2,{e}}^{l}$, highlighting the need to account for both the shape effect of the pre-reshock interface and the nonlinearity of its evolution. For cases VW, the secondary compression effect is weak, and the deviation of
 $\dot {a}_{2,{e}}^{l}$ from
 $\dot {a}_{2,{nh}}^l$ can directly reflect the applicability of
 $R_{dr}$ in describing the shape effect of the pre-reshock interface. In cases VW-0.35 and VW-0.70, the NH model accurately predicts
 $\dot {a}_{2,{e}}^{l}$, suggesting that
 $R_{dr}$ can well describe the pre-reshock interface shape effect when reshock occurs at the linear or weakly nonlinear evolution stage of the once-shocked interface. However, in cases VW-1.13 and VW-1.78, the NH model overestimates
 $\dot {a}_{2,{e}}^{l}$, indicating that
 $R_{dr}$ is inadequate to describe the shape effect of the pre-reshock interface when it deviates significantly from a small-amplitude single-mode one. This overestimation may be attributed to the non-single-mode profile of the pre-reshock interface (Liang et al. Reference Liang, Zhai, Ding and Luo2019; Luo et al. Reference Luo, Liu, Liang, Ding and Wen2020). For cases W, the NH model predicts
 $\dot {a}_{2,{e}}^{l}$ well (poorly) when reshock occurs at the linear (nonlinear) evolution stage of the once-shocked interface. It is worth noting that
 $R_{dr}$ is close in magnitude to the reduction factor derived for RMI in incompressible flow (Velikovich & Dimonte Reference Velikovich and Dimonte1996). Therefore, the failure of
 $R_{dr}$ to describe the reduction of the experimental
 $\Delta {\dot {a}}$ (
 $\Delta {\dot {a}}_{e}$) relative to
 $\Delta {\dot {a}}_{i}$ in case W-0.71 should be attributed to the secondary compression effect, which is negligible in case W-0.32 (VW-0.70) due to the low
 $ka_{1,{e}}^r$ (
 $M_2$). For cases W-1.19 and W-1.88, the combined influence of the pre-reshock interface shape effect and the secondary compression effect on
 $\Delta {\dot {a}}_{e}$ results in
 $\dot {a}_{2,{e}}^{l}$ being significantly lower than
 $\dot {a}_{2,{nh}}^l$. In cases MS, the coupling of these two effects has a more significant influence on
 $\Delta {\dot {a}}_{e}$ compared with that in cases W, and the secondary compression effect is non-negligible even when reshock occurs at the linear evolution stage of the once-shocked interface. Overall, both the pre-reshock interface shape effect and the secondary compression effect suppress the post-reshock linear amplitude growth and they would couple with each other. Furthermore,
 $R_{dr}$ fails to accurately describe the reduction in
 $\Delta {\dot {a}}_{e}$ relative to
 $\Delta {\dot {a}}_{i}$ when either effect is significant.
Experimental and theoretical results related to the pre-reshock amplitude evolution and post-reshock linear amplitude growth:  $\dot {a}_{2,{e}}^{l}$,
 $\dot {a}_{2,{ls}}^{l}$,
 $\dot {a}_{2,{h}}^{l}$ and
 $\dot {a}_{2,{nh}}^{l}$,
 $\dot {a}_{2}^{l}$ obtained from experiments and predicted by linear superposition, H and NH models, respectively;
 $a_{1,{zg}}^{r,b}$ and
 $a_{1,{zg}}^{r,s}$ (
 $\dot {a}_{1,{zg}}^{r,b}$ and
 $\dot {a}_{1,{zg}}^{r,s}$), amplitudes (amplitude growth rates) of the pre-reshock bubble and spike predicted by the ZG model, respectively;
 $\dot {a}_{2,{e}}^{l,b}$ and
 $\dot {a}_{2,{e}}^{l,s}$, post-reshock linear amplitude growth rates of the bubble and spike extracted from experiments, respectively;
 $\dot {a}_{2,{em}}^{l,b}$,
 $\dot {a}_{2,{em}}^{l,s}$ and
 $\dot {a}_{2,{em}}^{l}$, post-reshock linear amplitude growth rates of the bubble, spike and overall interface predicted by the EM model, respectively.

Developing a theoretical model capable of accurately predicting  $\dot {a}_{2,{e}}^{l}$ under various reshock conditions is desirable. However, providing a rigorous description of the coupling of the pre-reshock interface shape effect and secondary compression effect is challenging. Therefore, we seek to propose an empirical model based on the present experimental results. Due to nonlinearity, the bubble and spike generally have different amplitudes and amplitude growth rates before reshock. Consequently, their post-reshock linear amplitude growth rates (
 $\dot {a}_{2}^{l,b}$ and
 $\dot {a}_{2}^{l,s}$) should also differ and require separate consideration. Building on the NH model, an empirical model considering the coupling of the pre-reshock interface shape effect and the secondary compression effect (EM model) is proposed, which can be written as
 \begin{align} \dot{a}_{2,{em}}^{l} &= \frac{\dot{a}_{2,{em}}^{l,b}+\dot{a}_{2,{em}}^{l,s}}{2} \nonumber\\ & = \frac{[\dot a_{1,{zg}}^{r,b}+R_{em}^b C_2 k a_{1,zg}^{r,b} A_2 (u_{2,o} - u_{1,o})]+[\dot a_{1,zg}^{r,s}+R_{em}^s C_2 k a_{1,zg}^{r,s} A_2 (u_{2,o} - u_{1,o})]} {2}, \end{align}
where
 $$\begin{gather} R_{em}^b = \frac{1}{1+\left\{ka_{1,zg}^{r,b}\dfrac{\sqrt {5 [1+(u_{2,o} - u_{1,o})/ (v_{2,o}^{t} - u_{2,o})]} }{2}\right\}^2}; \end{gather}$$
 $$\begin{gather}R_{em}^s = \frac{1}{1+\left\{ka_{1,zg}^{r,s}\dfrac{\sqrt {5 [1+(u_{2,o} - u_{1,o})/ (v_{2,o}^{t} - u_{2,o})]} }{4}\right\}^2}. \end{gather}$$
Here,  $\dot {a}_{2,{em}}^{l,b}$ and
 $\dot {a}_{2,{em}}^{l,s}$ correspond to
 $\dot {a}_{2}^{l,b}$ and
 $\dot {a}_{2}^{l,s}$ predicted by the EM model, respectively;
 $a_{1,zg}^{r,b}$ and
 $a_{1,zg}^{r,s}$ (
 $\dot a_{1,zg}^{r,b}$ and
 $\dot a_{1,zg}^{r,s}$) represent the amplitudes (amplitude growth rates) of the pre-reshock bubble and spike predicted by the ZG model, respectively;
 $R_{em}^b$ and
 $R_{em}^s$ are the empirical factors utilized to describe the reduction in the reshock-induced linear amplitude growth rates of the bubble and spike, respectively; and
 $v_{2,o}^{t}$ denotes the velocity of TS
 $_2$ predicted by the one-dimensional gas dynamics theory. In
 $R_{em}^b$ (
 $R_{em}^s$),
 $ka_{1,zg}^{r,b}$ (
 $ka_{1,zg}^{r,s}$) is employed to depict the shape effect of the pre-reshock bubble (spike), while
 $(u_{2,o}- u_{1,o})/ (v_{2,o}^{t} - u_{2,o})$ is introduced to describe the secondary compression effect. Notably, the form of the latter is referenced to a parameter used to characterize the dependence of linear amplitude evolution on shock intensity in single-shock RMI studies (Holmes et al. Reference Holmes, Dimonte, Fryxell, Gittings, Grove, Schneider, Sharp, Velikovich, Weaver and Zhang1999; Glendinning et al. Reference Glendinning2003). Experimental
 $\dot {a}_{2}^{l,b}$ and
 $\dot {a}_{2}^{l,s}$ (
 $\dot {a}_{2,{e}}^{l,b}$ and
 $\dot {a}_{2,{e}}^{l,s}$) are determined via using the position of the unperturbed interface, calculated by the one-dimensional gas dynamics theory, to distinguish the bubble and spike. As shown in table 3,
 $\dot {a}_{2,{em}}^{l,b}$,
 $\dot {a}_{2,{em}}^{l,s}$ and
 $\dot {a}_{2,{em}}^{l}$ align well with
 $\dot {a}_{2,{e}}^{l,b}$,
 $\dot {a}_{2,{e}}^{l,s}$ and
 $\dot {a}_{2,{e}}^{l}$, respectively, demonstrating the validity of the EM model under various reshock conditions considered in this study.
The dependence of  $\Delta {\dot {a}}$ on
 $ka_1^r$ is further analysed by introducing a correlation coefficient defined as
 \begin{equation} \psi=\frac{\Delta{\dot{a}}}{A_2 (u_{2,o} - u_{1,o})}. \end{equation}
The variation rate of  $\psi$ with
 $ka_1^r$, i.e.
 $\partial \psi /\partial ka_1^r$, clearly illustrates the correlation between
 $\Delta {\dot {a}}$ and
 $ka_1^r$. If
 $|\partial \psi /\partial ka_1^r|$ is close to
 $0$ (
 $1$), it indicates a weak (strong) correlation between
 $\Delta {\dot {a}}$ and
 $ka_1^r$. Additionally, a positive (negative)
 $\partial \psi /\partial ka_1^r$ suggests a positive (negative) correlation between
 $\Delta {\dot {a}}$ and
 $ka_1^r$. The results for
 $\psi$ and
 $\partial \psi /\partial ka_1^r$ obtained from experiments (
 $\psi _{e}$ and
 $\partial \psi _{e}/\partial ka_1^r$), along with the corresponding predictions from the EM model (
 $\psi _{em}$ and
 $\partial \psi _{em}/\partial ka_1^r$), are shown in figure 7. It can be observed that the correlation between
 $\Delta {\dot {a}}$ and
 $ka_1^r$ changes from strongly positive to weakly positive and then to weakly negative as
 $ka_1^r$ increases, regardless of the intensity of the second shock. This indicates that
 $\Delta {\dot {a}}$ is non-monotonically related to
 $ka_1^r$, and that this relationship is primarily due to the shape effect of the pre-reshock interface. Additionally, the correlation between
 $\Delta {\dot {a}}$ and
 $ka_1^r$ is weaker when the second shock is stronger, due to the suppression of the secondary compression effect on post-reshock amplitude evolution.
Variations of  $\psi$ (a) and
 $\partial \psi /\partial ka_1^r$ (b) with
 $ka_1^r$.

3.2.3. Nonlinear amplitude growth of twice-shocked interface
Following a short period of linear growth, the amplitude of the twice-shocked interface enters the nonlinear evolution stage. Currently, a rigorous theory for describing the post-reshock nonlinear amplitude evolution is still lacking. In previous studies on S-RMI (Karkhanis et al. Reference Karkhanis, Ramaprabhu, Buttler, Hammerberg, Cherne and Andrews2017; Karkhanis & Ramaprabhu Reference Karkhanis and Ramaprabhu2019; Wang et al. Reference Wang, Cao, Chen, Zhai and Luo2022), some nonlinear models proposed for single-shock RMI have been utilized to predict the nonlinear perturbation growth of the twice-shocked interface. Wang et al. (Reference Wang, Cao, Chen, Zhai and Luo2022) found that the ZG model is applicable to predict the post-reshock amplitude evolution when the second shock is weak and reshock occurs at the linear evolution stage of the once-shocked interface. In this work, the ZG model is similarly adopted to offer a theoretical reference for the nonlinear perturbation growth of the twice-shocked interface, which can be rewritten as
 \begin{equation} \dot{a}_{2,{zg}}^{b/s}(t) = \frac{\dot{a}_{2,{em}}^{l,b/s}}{1 + \theta_2^{b/s} k \dot{a}_{2,{em}}^{l,b/s} t}, \end{equation}
where
 \begin{equation} \theta_2^{b/s}=\frac{3}{4}\frac{(1 \pm A_2)(3 \pm A_2)}{3 \pm A_2 + \sqrt{2}(1 \pm A_2)^{1/2}} \frac{4(3 \pm A_2) + \sqrt{2}(9 \pm A_2)(1 \pm A_2)^{1/2}}{(3 \pm A_2)^2 + 2\sqrt{2}(3\mp A_2)(1\pm A_2)^{1/2}}. \end{equation}
Figure 8 illustrates the temporal variations of the bubble and spike amplitudes of the twice-shocked interface ( $a_2^b$ and
 $a_2^s$) in dimensionless form. The evolution time and amplitude of the bubble/spike are normalized as
 $\tau _2^{b/s}=k \dot {a}_{2,{em}}^{l,b/s}(t-t_{2}^{b*/s*})$ and
 $\alpha _2^{b/s}=k(a_2^{b/s}-a_2^{b*/s*})$, respectively, in which
 $t_{2}^{b*/s*}$ indicates the moment when the linear growth of
 $a_2^{b/s}$ starts in the experiment, and
 $a_2^{b*/s*}$ is the corresponding
 $a_2^{b/s}$ at
 $t=t_2^{b*/s*}$. As the ZG model does not account for the initial amplitude effect, its predictions for cases with similar second shock intensities but different
 $ka_{1,{e}}^r$ are highly consistent. Accordingly, only two theoretical lines, corresponding to the bubble and spike of the twice-shocked interface, respectively, are provided in each figure. The scaling effectively collapses the results of cases with similar second shock intensities. For cases VW and W, the ZG model accurately predicts the overall bubble and spike evolutions. However, for cases MS, the ZG model overestimates the bubble growth while underestimating the spike development from the intermediate to late stages. These results suggest that the ZG model can reasonably describe the post-reshock nonlinear amplitude evolution when the second shock is very weak/weak, and the secondary compression effect could alter the nonlinear evolution law of the twice-shocked interface when the second shock reaches a certain intensity. Specifically, the high pressure generated by interactions among transverse shock waves inhibits (promotes) the bubble (spike) growth, leading to the overestimation (underestimation) of the ZG model.
Experimental and theoretical results on the amplitude evolutions of the bubble and spike of the twice-shocked interface: (a) cases VW, (b) cases W and (c) cases MS.

Further, we attempt to propose an empirical nonlinear model based on the ZG model and present experimental results, aiming to effectively describe the post-reshock nonlinear evolution law under all reshock conditions considered. For the evolutions of the bubble and spike of the twice-shocked interface, the empirical model (mZG model), obtained after many attempts, can be respectively written as
 \begin{equation} \dot{a}_{2,{mzg}}^{b}(t) = \frac{\dot{a}_{2,{em}}^{l,b}}{1 + \theta_2^b k \dot{a}_{2,{em}}^{l,b} F^b t} \end{equation}
and
 \begin{equation} \dot{a}_{2,{mzg}}^{s}(t) = \frac{\dot{a}_{2,{em}}^{l,s} F^s}{1 + \theta_2^s k \dot{a}_{2,{em}}^{l,s} F^s t}. \end{equation}
Here,  $F^b=1+(u_{2,o}-u_{1,o})/3(v_{2,o}^t-u_{2,o})$ and
 $F^s=1+(u_{2,o}-u_{1,o})/5(v_{2,o}^t-u_{2,o})$ represent the empirical factors for describing the secondary compression effect on the post-reshock growths of the bubble and spike, respectively. As illustrated in figure 8, the mZG model accurately predicts the overall bubble and spike evolutions for all cases, demonstrating its ability to precisely describe the nonlinear evolution law of the twice-shocked interface under the reshock conditions considered.
4. Conclusions and perspective
Richtmyer–Meshkov instability induced by two successive shock waves propagating in the same direction (S-RMI) under diverse reshock conditions is studied through shock-tube experiments. We aim to explore how the evolution law of the twice-shocked interface depends on the interface evolution state before reshock and second shock intensity.
Qualitatively, the reshock promotes the interface instability, and its effect is related to both the pre-reshock interface evolution state and second shock intensity. When the secondary compression effect introduced by transverse shock waves is significant, the heads of the bubbles gradually flatten out and eventually occupy nearly the entire space along the spanwise direction in the late stages.
Quantitatively, the linear and nonlinear amplitude evolutions of the once-shocked interface can be effectively predicted by the impulsive model (Richtmyer Reference Richtmyer1960) and the nonlinear model proposed by Zhang & Guo (Reference Zhang and Guo2016) (ZG model), respectively. Besides, when reshock occurs at the moderately or strongly nonlinear evolution stage of the once-shocked interface, the pre-reshock interface no longer satisfies the small-amplitude criterion and deviates notably from a single-mode profile. For the linear evolution of the twice-shocked interface, models fail to provide accurate prediction when the pre-reshock interface has entered the moderately or strongly nonlinear evolution stage and/or the second shock reaches a certain intensity. This failure arises from the inadequacy of existing reduction factors in describing the pre-reshock interface shape effect and the secondary compression effect when either is significant. On the basis of the present experimental results and considering bubble and spike separately, an empirical linear model that accounts for the coupling of the pre-reshock interface shape effect and secondary compression effect is proposed. Furthermore, the reshock-induced amplitude growth rate exhibits a non-monotonic dependence on the scaled pre-reshock amplitude, primarily ascribed to the shape effect of the pre-reshock interface. This correlation weakens when the second shock is stronger due to the more pronounced secondary compression effect. For the nonlinear evolution of the twice-shocked interface, the ZG model offers reasonable predictions when the second shock is very weak/weak. However, when the second shock is moderately strong, the ZG model overestimates the bubble growth and underestimates the spike evolution under the influence of the significant secondary compression effect. Building on the current experimental findings and the ZG model, we propose an empirical nonlinear model that accurately describes the nonlinear evolution law of the twice-shocked interface under the reshock conditions considered.
This study investigates S-RMI with diverse pre-reshock interface evolution states and second shock intensities. However, the current experiments are conducted with roughly the same Atwood number and the intensity of the strongest second shock is only moderately strong. Extensive studies on single-shock RMI have shown that the instability evolution and predictive capabilities of models are related to both the sign and magnitude of the Atwood number (Jourdan & Houas Reference Jourdan and Houas2005; Matsuoka & Nishihara Reference Matsuoka and Nishihara2006a,Reference Matsuoka and Nishiharab; Mariani et al. Reference Mariani, Vandenboomgaerde, Jourdan, Souffland and Houas2008; Dimonte & Ramaprabhu Reference Dimonte and Ramaprabhu2010; Lombardini et al. Reference Lombardini, Hill, Pullin and Meiron2011; Chen et al. Reference Chen, Xing, Wang, Zhai and Luo2023; Wang et al. Reference Wang, Wang, Zhai and Luo2023a,Reference Wang, Wang, Zhai and Luob). In addition, it has been observed that the evolution law of single-shock RMI remains sensitive to shock intensity in the regime where Mach number exceeds 1.5 (Holmes et al. Reference Holmes, Dimonte, Fryxell, Gittings, Grove, Schneider, Sharp, Velikovich, Weaver and Zhang1999; Sadot et al. Reference Sadot, Rikanati, Oron, Ben-Dor and Shvarts2003; Puranik et al. Reference Puranik, Oakley, Anderson and Bonazza2004). Therefore, it can be inferred that variations in Atwood number and further enhancement of second shock intensity also affect the evolution law of the twice-shocked interface. Accordingly, the applicability of the empirical models proposed in this work to S-RMI with various Atwood numbers and stronger second shocks remains uncertain. To further evaluate and refine these models, experimental research on S-RMI across a broader range of reshock conditions will be conducted in the near future.
Furthermore, it is worth noting that both the large-scale perturbation evolution and small-scale material mixing contribute to the degradation of ICF implosion performance (Zhou Reference Zhou2017a,Reference Zhoub, Reference Zhou2024). Thus, investigations on the large-scale perturbation evolution and small-scale mixing are both essential. In the present work, the schlieren technique is employed to capture the large-scale wave and interface evolution. However, this method cannot provide additional quantitative flow information, such as the velocity and vorticity fields, and thus does not provide deeper insights regarding the small-scale mixing. Mixing diagnostics, such as PLIF, PIV and simultaneous PLIF/PIV techniques, have been utilized to study single-shock and reflected-reshock RMI at small scales (Balakumar et al. Reference Balakumar, Orlicz, Ristorcelli, Balasubramanian, Prestridge and Tomkins2012; Balasubramanian et al. Reference Balasubramanian, Orlicz, Prestridge and Balakumar2012; Mohaghar et al. Reference Mohaghar, Carter, Musci, Reilly, McFarland and Ranjan2017, Reference Mohaghar, Carter, Pathikonda and Ranjan2019; Mansoor et al. Reference Mansoor, Dalton, Martinez, Desjardins, Charonko and Prestridge2020; Sewell et al. Reference Sewell, Ferguson, Krivets and Jacobs2021). In future work, these more advanced diagnostics will be applied to reach an understanding of S-RMI from a more quantitative perspective, in the hope that our experiments can be more useful to the research community on shock waves and hydrodynamic instabilities.
Acknowledgements
The authors appreciate the valuable suggestions of the reviewers.
Funding
This work was supported by the National Natural Science Foundation of China (nos. 12102425, 12472228, 12372281, 91952205 and 12388101), Youth Innovation Promotion Association CAS, the Fundamental Research Funds for the Central Universities and Young Elite Scientists Sponsorship Program by CAST (no. 2023QNRC001).
Declaration of interests
The authors report no conflict of interest.



