Strong party discipline is a defining feature of legislative politics in Westminster systems.Footnote 1 In modern times, parliamentary divisions (‘roll calls’ in American parlance) are characterized as predictable affairs insofar as members of parliament (MPs) can be expected to vote in line with their parties’ explicit orders, and rebellion against the whip is a relatively rare event.Footnote 2 One consequence of party cohesion, in tandem with an electoral system that yields a ‘manufactured majority’ of seats,Footnote 3 is that governing parties almost never lose votes that are important to their legislative agenda. This arrangement facilitates the particular vision of responsible governmentFootnote 4 and accountabilityFootnote 5 that has allowed the unusual longevity and diffusion of the Westminster system from its home in Britain to other polities.Footnote 6
Given the centrality of cohesive parties to both the functioning of the Westminster system and to the normative justification of its use, it is unsurprising that a great deal of political science attention has been lavished upon them. Starting as early as the turn of the twentieth century,Footnote 7 scholarship has focused on the nineteenth century as a transitional time during which party cohesion – and thus the Westminster system – took hold in the House of Commons.Footnote 8 While researchers have come to a clear consensus that discipline did indeed increase, the central question of why MPs became more cohesive has lacked a convincing answer. Though we are not without theories,Footnote 9 demonstrating conclusively which particular mechanism explains the patterns we see has remained an elusive goal. To the extent that understanding parliamentary discipline in modern times is an important goal in political science,Footnote 10 and to the extent that modern politics relies upon it,Footnote 11 there is obvious interest in improving this state of affairs. This article represents such an improvement.
At its core, the question is: did parties become more cohesive primarily because MPs who were previously less disciplined became more disciplined as the century progressed, or was the increase in cohesion due to more disciplined types of individuals entering the Commons while less disciplined types left it? The former story implies that change was mostly due to factors acting on existing members – like increasingly efficient whipping, a greater sense of solidarity, better agenda control by leaders or responsiveness to a party-oriented electorate. We denote this an ‘inducements’ account, insofar as extant members were encouraged to behave differently. The latter story suggests that newcomers to the chamber brought with them cohesion, while a rebellious old guard was replaced by natural wastage. We denote this a ‘replacement’ account, insofar as the turnover of latent traits drives any changes in cohesion. It is both fundamental and difficult to determine how much each of these mechanisms contributed to the development of cohesive parties in the House of Commons. Previous work has been unable to decisively resolve the issue in part because of methodological shortcomings, but mostly due to issues of data availability. Here, we solve both problems using novel statistical methods, panel data analysis and a new collection of roll-call records.
Our data consists of every one of the 20,262 roll calls cast between 1836 and 1910. We have a record of every member’s decision on every division. By combining this voting information with a new dataset that incorporates extensive individual-level covariates on the thousands of MPs serving during this time, we are able to explore discipline in more nuanced ways than previous studies that used aggregated statisticsFootnote 12 ever could. Similarly, we are able to chart the changes in cohesion over a much broader period than the intensive, but time-limited studiesFootnote 13 preceding ours. In short, we have the best of both worlds: micro data as a long time series. In the first part of the article, we characterize cohesion over time using relative distribution methods,Footnote 14 which give a more complete account of how cohesion changed from parliament to parliament than is possible with means and standard deviations. These methods are both non-parametric and robust to outliers (a common occurrence in histories of legislative voting). In the second part of the article we use panel data methods to assess the possible mechanisms by which the changes in cohesion occurred.
We find that voting cohesion began high in the 1830s, waned in the 1840s and then grew thereafter. This observation is commensurate with earlier accounts, though we are able to be much more precise in our discussion of changes. Importantly, we show that cohesion was always relatively high in absolute terms for the average MP, and that by the 1860s, almost all growth in aggregate party-line voting was due to the disappearance of a rebellious left tail from the distribution of cohesion. We then show that this folding in of the rebel tail is not due to new blood entering the House of Commons or from older less-malleable types retiring out. Instead, we demonstrate that sitting MPs became more cohesive as the Victorian age wore on, examining ministerial promotion as one inducements-based explanation for increasingly cohesive voting. This pattern is consistent with theories of endogenous change, in which internal reforms and incentivesFootnote 15 matter more than sociological adjustments to MP stock.Footnote 16
Our article continues as follows: in the next section we review the literature pertinent to the question at hand and set up our empirical tasks; we then introduce the data with which we will address those tasks. Following this, we use relative distribution methods to characterize the change in cohesion over time. We then assess the role of replacement and evaluate one possible inducements channel. The final section concludes.
LITERATURE AND ORIENTATION
Scholars have cited the period between the first Reform Act of 1832 and the fourth Reform Act of 1918 as the key period of development for both the Westminster system and the British polity as a whole.Footnote 17 Central to this story is increased party cohesion in legislative voting, and scholarly interest has focused on two distinct but related questions therein. First, researchers have sought to document how roll-call behavior changed in a descriptive sense. Secondly, they have sought to understand exactly why it did so.
Scholars have described changing cohesion using different tools,Footnote 18 typically concentrating on aggregate measures like ‘proportion of divisions in which the two (major) parties opposed one another’, or on simple averages – like the proportion of divisions in which given MPs voted with their whips.Footnote 19 Cox summarizes the consensus finding of the literature when he notes that ‘For the Conservatives, there is a sharp decline [in the 1830s and 1840s]… a plateau in the 1850s; and a sharp recovery [later]….’Footnote 20 Meanwhile, ‘[f]or the Liberals, there is a much smaller decline… followed by an erratic increase’.Footnote 21 While univariate averages are helpful for outlining general trends, using them alone conceals other potentially important distributional features that characterize the nature of the change over time. For example, measures of central tendency say nothing per se about the relative proportion of the most and least cohesive members, nor about the magnitude of their loyalty and rebeliousness respectively. This means, for instance, that we cannot know whether a period of low party unity is due to a chamber of mostly independent voting haphazardly from the whips’ perspectiveFootnote 22 (resulting in a high variance spread around the mean), or if it is due to a small but persistent group of rebels – such as the Fourth Party – that actively seeks to vote against the party line (a left tail that drags mean cohesion down). In short, being able to describe the evolving features of roll-call voting in a more complete, subtle and precise manner tells researchers both where to look for possible causal relationships and how to interpret any evidence they find.
Whatever the descriptive statistics, it is unclear exactly why cohesive parties increasingly became the norm. Explaining the pattern obviously requires understanding both how MPs sorted themselves into parties and why they behaved the way they did once sorted. As previewed above, one way to organize work on emerging unity is into inducement or replacement accounts, the former dealing with encouragements for MPs with given (possibly latent) characteristics to behave in different ways, and the latter focusing on the role of new MPs entering the chamber over time. Scholars in the inducement tradition have, for example, emphasized the importance of material interests as prompts for voting in the 1840s;Footnote 23 others have noted the importance of rhetorical manipulation during the same period.Footnote 24 Related literatures point to electoral reform as ushering in the ‘triumph of partisan politics’ in the later Victorian era, with polarization of the electorate having knock-on consequences for the British House of Commons.Footnote 25 With a view to the broader time period and more attention to internal reform, CoxFootnote 26 provides a rare example of work that relies on data collected over a relatively long period to link external changes to suffrage and individual motivations for division behavior. His particular emphasis is on cabinet promotion opportunities as a reward for good behavior in the Commons, which is perhaps the prototypical inducement account.Footnote 27 Connected to such reasoning is a broader literature emphasizing the importance of campaign finance arrangements in a more modern democratic ageFootnote 28 and the need to avoid aggravating the central party administration.
In contrast to these researchers, scholars of replacement have pursued a different tack, noting changes in the personal socio-economic circumstances of MPs during this period, without paying particular attention to interests per se. Rush,Footnote 29 for example, describes the pronounced decline in members with aristocratic links as the century wore on,Footnote 30 and their commensurate replacement with businessmen and representatives of the (legal) professions.Footnote 31 The fundamental logic of such work appears in some of the accounts above too, albeit implicitly: Cox,Footnote 32 for example, notes the importance of ministerial ambition in explaining why men would seek to enter parliament in the second half of the Victorian age, with obvious implications for types of MPs that are likely to appear over time. Note too that accounts that rely on period-specific or class-specific inducementsFootnote 33 would presumably accept that as different individuals with different interests enter the Commons, voting behavior is likely to change. In part due to their obvious simplicity and plausibility, replacement stories have featured in accounts of roll-call behavior change well beyond Westminster systems: the conditional party government modelFootnote 34 relies in part on a post-Watergate surge of liberal Democrats in the US House of Representatives replacing more conservative southern representatives.
For foregoing scholars, deciding which account of the changes is more plausible (or in what proportion) – inducements vs. replacement – was a tall order, since it implicitly required the records of individual MP behavior, over a long time period. That is because the debate can only be resolved by knowing whether MPs became more disciplined during their career in the House, and whether or not that evolution outweighs (in a statistical sense) the effect of new members entering the Commons who were already more cohesive in type. Put more simply, we need panel data and previous (sometimes Herculean) efforts have either limited the scope to one or two parliaments with records at the MP levelFootnote 35 or have looked at a longer time period in aggregate terms without attention to unit (MP)-level variation.Footnote 36 Studies that collect disaggregated voting data over a considerable periodFootnote 37 do so by covering only certain years or certain divisions.
As we explain in the next two sections, we address the shortcomings of previous work in terms of descriptive analysis and inference: we bring to bear the entire universe of MP decisions on roll calls for the period 1836–1910 and new methods to study them. This allows us to better present the changing pattern of aggregate behavior, and to model cohesion within MP careers. Thus if we believe that latent preferences are essentially fixed, and can show that increased cohesion is not the product of replacement effects, we can go some way toward showing that an inducements story – in which whipping, rhetoric, agenda control, leadership and other such factors became more powerful motivational tools – is more convincing. More formally, our intention is to:
-
1. fully characterize the changes in party division behavior during this period, using methods that allow us to comment on the overall nature of unity over time, and the relative and absolute solidarity of the most and least cohesive members;
-
2. examine the association between entering or exiting the House of Commons and voting cohesion. If the replacement story has merit, fresh entrants ought to, ceteris paribus, be more disciplined than the mass of colleagues they join who are already incumbents, and departing MPs ought to be less so;
-
3. examine the association between seniority and cohesive voting for individual MPs over time. Inducements theories imply that the average individual MP should vote more in line with his party as his career progresses from parliament to parliament; if replacement theories have merit, this seniority effect should be small relative to the increase in average cohesion across members from parliament to parliament; and
-
4. examine with more complete data a question previously raised and studied by Cox:Footnote 38 did party cohesion increase partly because ministerial posts were offered to more loyal party voters?Footnote 39
We explain each of these tasks more fully in subsequent sections. Before doing so, note that while we recognize that there are other inducement mechanisms for good behavior, and in the discussion section we return to what those might be, this article focuses particularly on ministerial promotion for several reasons. First, because both the theoryFootnote 40 and empirics on cabinet personnel managementFootnote 41 are well studied, and part of a mature literature thought to explain much of the discipline seen in the House of Commons. Secondly, despite some pioneering efforts to measure leadership via less observable channels like the use of rhetoric,Footnote 42 obtaining reasonable estimates of the effects of other inducement mechanisms is prohibitively difficult – especially for historical data.
DATA
The current project requires roll-call votes of MPs in the House of Commons, or ‘divisions’ as they are known for this particular legislature. As noted, several authors have collected roll calls for the nineteenth century prior to our efforts, but we are much more comprehensive in both depth and breadth. In particular, we gathered every individual roll-call vote for the entire period of 1836–1910.
Our raw data was supplied by the History of Parliament Trust, which had commissioned a major digitization project to convert published division lists into machine-readable data. We linked MPs to covariates in a relational database, as described in Eggers and Spirling,Footnote 43 and we were compelled to undertake substantial disambiguation of names such that the roll calls could be used for the purposes below. An online appendix provides more details.
For reasons that will become clear below, we required the identity of the head (chief) whips for the two major parties (Liberals and Conservatives for this period) at any given time. We found annual listings of their identities in Cook and Keith and Butler and Butler,Footnote 44 but the precise resignation and promotion dates for these officers are unknown. While it is generally the case that government chief whips are made parliamentary secretary to the Treasury, obtaining dates for this office proved no easier. And in any case, there is no such aliased information for chief whips of non-government parties at this time. Some scholars have made efforts to expand and refine this information,Footnote 45 though in such schemes (educated) speculation is required to fill in missing details, especially for secondary whips. As a result, we occasionally found months of roll calls within years in which the particular whip cited in aggregate records did not appear to be serving as an MP (and we therefore assume that he was not in fact whip during this period). To circumvent this problem, we simply assumed that anyone who at some point served as a chief whip during the parliament in question represented the party line when voting in the way we specify below – that is, as a teller. Thus if there were two Tories serving as chief whips in Parliament A, we check the names of both against the relevant division lists (tellers) in order to update our understanding of the Conservative Party position on a given vote. Empirically, treating all chief whips who served in a period as embodying the party line on a given day may be correct or not (there is no way of knowing with the current data), but it is unlikely to cause problems for our measure below since, presumably, those who become chief whip vote in a way that is commensurate with that office immediately preceding or after their occupation of it.Footnote 46
A natural concern for scholars of parliaments pertains to the selection process by which propositions make it to a vote at all. By definition, our division records from the History of Parliament Trust do not include unobserved cases that were put to a voice vote (only) or were never pursued in the lobbies. It is certainly the case that there are both more divisions over time, and that there are more divisions that the government (and the opposition) whip over time: starting with around 30 per cent of the 300–700 divisions in the early period, rising to around 70 per cent of the 700 or so votes per parliament by the 1850s, and up to 90 per cent of 1,500-odd divisions by the end of the data. Ultimately though, our approach compares only like with like: that is, we are calculating parties’ cohesion based on votes on which the chief whip acts as a teller. Thus while it is true that private members found it much harder to introduce business after the Cabinet’s agenda reforms during the nineteenth and early twentieth centuries,Footnote 47 any private member bill without explicit government backing should not appear as one of our data points.
Measuring Cohesion
Measuring the cohesiveness of voting in British parliamentary parties is a long-standing methodological problem.Footnote 48 In contrast to most work on the subject, our goal in the current article is to shed light on how individuals behave with respect to their parties, and not on the aggregate behavior of parties per se.Footnote 49 We begin from the premise that an MP votes in line with his party when he votes the same as the chief whip, who acts as a ‘teller’ for that division.Footnote 50 Our measure of cohesion for a given MP at a given time is a simple proportion: the number of times he votes the same way as his whip, divided by all the times both he and his whip state a preference (that is, we ignore missing values in terms of calculating both the numerator and denominator of this measure). A discipline distribution or cohesion distribution as alluded to below is then just the aggregated set of all these individual scores, for all the relevant MPs in a session. We give more details of our measurement procedure in the online appendix.
Implicit here is the assumption that the chief whip receives orders directly (or as if directly) from his party leader. It could conceivably be the case that a particular roll call was not whipped, yet the chief whip chose to vote as a teller. In that case, voting with the chief whip overstates the degree of discipline pertaining to a specific MP. But such occurrences are likely to be extremely rare, since chief whips are agents of leadership throughout this period and are unlikely to waste time on more frivolous matters that come up for roll-call votes. Alternatively, it may be the case that, on a particular whipped roll call, the chief whip (or one of his close associates) fails to act as a teller for some idiosyncratic reason, yet gives instructions to the MPs (which we cannot observe). To the extent that voting behavior in such circumstances is similar to that in other whipped votes (and/or that these circumstances are rare), excluding these cases does not affect our results.
We restrict the analysis that follows to the two major governing parties at this time: the Conservatives and Liberals. While we have information on MPs from other parties, we typically do not know their whipping arrangements, and the process is especially complicated for some break-away factions like the Liberal Unionists, who sometimes voted with the Conservative whip in the nineteenth century. Thus our restriction avoids such ambiguities.
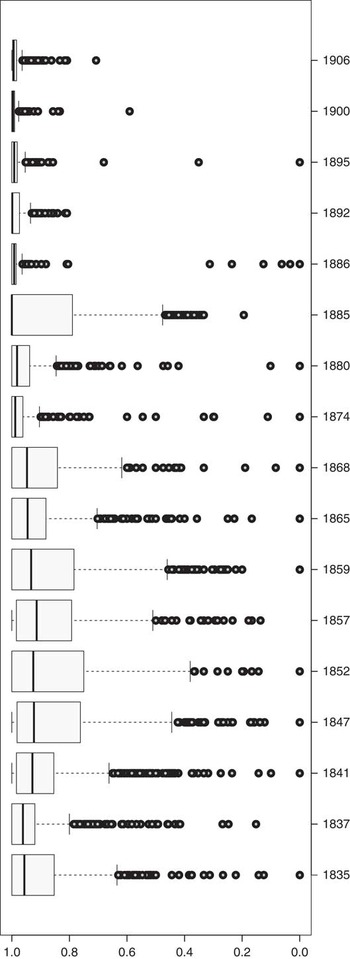
In Figure 1, we report boxplots representing the distribution of cohesion scores for MPs over time. Recall that the fundamental unit of analysis is a given MP’s agreement with his whip (that is, we are not plotting aggregated division-based scores here). The thick black bars represent medians, and it is clear that while median behavior becomes less disciplined in the 1840s,Footnote 51 it approaches 1 thereafter, reaching its zenith at the end of the data.Footnote 52 The gray points represent outliers who are least disciplined: MPs whose record puts them into the tail of their parliament’s distribution. Looking more closely, we see something of a discrete shift in cohesion around 1868, when the median jumps to just shy of its maximum, while the implied spread of discipline begins to pack much more tightly around the average. While the pattern observed – more disciplined MPs packed more tightly around a higher median – is relatively intuitive, we wish to be more formal about the changes to the distributions. In the next section, we do just that.
Aggregate discipline in the House of Commons over time: distributions of individual scores Note: Measure bounded between 0 and 1 (1=the most disciplined).

DESCRIBING THE RISE IN PARTY COHESION
Our first task is to compare the distribution of MPs’ obedience, unity and cohesiveness over time. To do this, we employ relative distribution methods, following Handcock and Morris.Footnote 53 The essence of the approach is to transform the data from two distributions – here, sets of MP agreement scores – into one distribution, such that we can compare them clearly and easily. The resulting relative distribution consists of the percentile rank that every member in the first dataset would have in the second. Suppose, for example, that we broke up our data from Figure 1 into two parts: the cohesion scores for the parliaments prior to 1874 and those for the parliament of 1874. Inspection suggests that, generally speaking, those in the earlier period would have relatively low percentile ranks in the second. We can be formal about this comparison, and Handcock and MorrisFootnote 54 suggest two ways to do so.Footnote 55 First, we can decompose any distribution change between two sets of data into a location and shape change component – and compare the relative contribution of each part. The location component refers to the notion of a shifted distribution, and answers the question ‘how much of the change between this era of MPs and another era of MPs is due to an increased or decreased median cohesion score?’ Any variation in the distributions that remains after taking into account this location change is due to changes in shape: that is, changes to the way the distribution looks as a whole – including its spread, range and so on. Our online appendix provides more intuitive details on these ideas. The other summary measure Handcock and Morris suggest pertains to the polarization of the distribution over time.Footnote 56 In our context, their polarization index refers to the extent to which there is more mass in the tails of the current parliament distribution than in the previous parliament. Thus when the index is rising, MPs are increasingly different from one another: support for the whip scores is spread increasingly thinly. By contrast, when the index is falling, MPs are increasingly gathering around the central tendency, whatever that location measure might be. Here we will focus on the polarization in the left tail, since this represents the least cohesive, most rebellious MPs in our data. These summary measures are robust to outliers, which is an important characteristic in the context of voting in parliament. Such approaches are implemented in the R statistical environment by Handcock and Aldrich, and we use their software in what follows.Footnote 57
Note that the approach here is non-parametric, meaning that one does not need to commit to, for example, looking at mean and variance shifts under the very dubious assumption that whip agreement scores are normal. A drawback, as with other non-parametric approaches, is that relative distribution methods tend to require large amounts of data. A second caution is that relative distribution approaches are sensitive to heaping,Footnote 58 which refers to the tendency of social scientific data to pile up in certain places on the continuous spectrum. Here, as time goes on, more and more MPs appear at, or close to, a whip agreement score of 1 (that is, full agreement). As a result, the accuracy of the entropy calculations – a measure of the distance between two distributions that can be decomposed into location and shape components – can suffer.Footnote 59 To ameliorate this problem, we compare a shifting set of parliaments in cohesion terms, thus maximizing our sample size and helping to smooth across transitions.
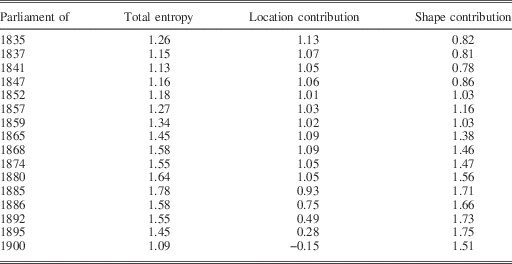
In Table 1 we report the estimated entropy difference between distributions, and then the location and shape components that contribute to it. Technically, the location and shape components should sum to the entropy for that transition, though this is not quite the case for all entries. Likely, this discrepancy is due to the heaping and ‘small’ data problems we mention above. In each case, we are comparing two sets of parliaments: all those before a certain date, and all those after that date. For example, the entry for 1847 treats the parliaments of 1835, 1837, 1841 and 1847 as one distribution, and then the parliaments of 1852, 1857, 1859, 1865,…, 1900, 1906 as the second distribution. Similarly, the entry for 1900 compares the distribution of all parliaments up to (and including) the parliament of 1906.
Relative Contribution of Median and Shape to Changing Distribution of Whip Agreement Scores over Time

Note: The location and shape contributions do not always sum to the (total) entropy because the data requirements of relative distribution methods are not fully met. However, the relative contribution of the components can still be compared in absolute terms.
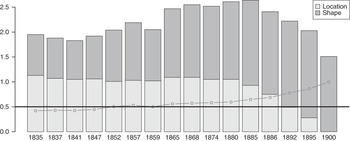
In Figure 2, we provide a barplot of the same information as in Table 1 except that we impose the rationality constraint that all negative values (of location contribution) are zero, and then treat the sum of the location and shape contributions as the total entropy. The broken line is the proportion of the entropy that is due to the shape distribution alone. The black horizontal line marks the point at which half of any change is due to the shape. When the broken line is above this point, as it is after the 1850s, the majority of any alteration to MP discipline arises from shape (rather than median) shifts. As can be seen from the plot, at the beginning of the century, location and shape changes have approximately equal responsibility for any changes to the cohesion distribution. After the 1850s, the shape contribution rapidly increases; by the end of the century, only the shape is changing.
Relative contribution of location and shape components in relative distributions for parliaments Note: Broken line demarcates the proportion of entropy due to shape contribution: note that it rises over time. The solid black horizontal line shows the 50 per cent mark for shape contribution: when the broken line crosses this horizontal line, more than half of the distributional change is due to shape changes. Notice that the bar for a given year reflects the comparison of all parliaments to that date with all that come after.

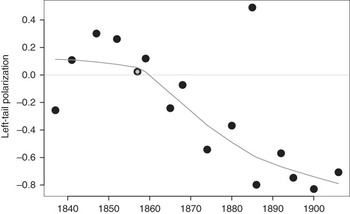
As noted above, we can also study the polarization of a distribution: essentially a measure of what proportion of its mass is in the center relative to the tails. Handcock and Morris suggest several such measures, in which a positive value implies more mass in the tails, and a negative value indicates more concentration around the median.Footnote 60 Here we focus on the polarization of the left tail. In terms of data arrangement, we now compare each current parliament to all previous ones.Footnote 61 Thus 1847 is compared to the parliaments of 1835, 1837 and 1841, which is considered one set of observations. Our idea here is to describe what happened to the most rebellious parts of the parties in the new parliament. Figure 2 presents the results. There, points represent the lower tail index; black points indicate that the index is statistically significant (meaning that any observed polarization of the distribution – that is, deviation in shape from the previous parliament – is sufficiently unlikely to have occurred by chance). As the solid lowess line combined with the points makes clear, after an initial period of flatness or possible increase, rebellion decreases over time. In practice, this means that rebeliousness becomes more common early on, but the rate of change is no longer increasing by the 1850s, and is actively decreasing (that is, there is less mass in the rebel tail) by the 1860s.
Figure 3 and Table 1 tell a consistent story: as the nineteenth century progressed, the distribution of discipline in the House of Commons became increasingly concentrated around its average and away from the left tail. In other words, for whatever reason, during the study period the norm was almost always to vote as the whips did; what changed was that a smaller and smaller proportion of MPs failed to obey this norm. In the next section, we delve into possible mechanisms for this change.Footnote 62
Share of the discipline distribution change in the left tail, over time Note: The comparison is current parliament to all previous ones at that point. Points represent index; black symbols imply effects with p<0.01, gray symbols imply otherwise. Note that the solid lowess line and points imply first increasing (or at least non-decreasing), then decreasing mass over time. This implies that the left tail is ‘emptying out’.

ASSESSING THE ROLE OF REPLACEMENT
If this decline of the rebellious left tail was due to the replacement of undisciplined MPs by other MPs who were more inclined to vote with their party, then analysis of MPs’ cohesion scores should reveal several patterns. In this section we assess the evidence for these patterns using panel data. We first compare the cohesion scores of new entrants to parliament and MPs who were on their way out of the chamber (joiners and leavers) to that of other MPs. We then use member fixed effects to categorize the long-term increase in cohesion into the part that could plausibly be due to replacement and the part that must be due to other factors.
Comparing Joiners and Leavers to other MPs
If the replacement story explains the decreased number of rebels in the left tail, we ought to see that (1) joiners vote with the party whips more diligently than other MPs of their party, and (2) leavers vote with the party whips less diligently than other MPs of the party.Footnote 63 We now carry out some simple tests of that prediction. Recall that each MP contributes a separate observation to the data; thus the analysis below deals with multiple observations for each MP, who is (possibly) serving in multiple parliaments. Before reporting our results, we acknowledge that our models below are stripped down to core variables, primarily pertaining to fixed effects for members and parliaments. Of course, we acknowledge that underlying such fixed effects, and in addition to them, other more subtle forces are likely at work in determining how cohesive particular MPs are – including their district characteristics, personal connections and histories in the legislature. Other work has made inroads into studying such associations,Footnote 64 but this is not our focus here.
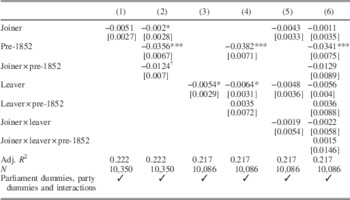
Table 2 reports regression results in which each MP’s per-parliament cohesion score is regressed on indicators for whether an MP is a joiner or a leaver in a given parliament, as well as an indicator for the parliament, an indicator for the MP’s party and the interaction of the two.Footnote 65 In Column 1 the only right-hand side variable, aside from parliament and party dummies, is an indicator for whether the MP is in his first parliament; the coefficient indicates that new MPs were, if anything, less cohesive overall than other MPs (controlling for the parliament, the MP’s party and the interaction between the two). When we interact our joiner indicator with a dummy for pre-1852 (Column 2), we see that joiners were no more or less likely to vote cohesively during the post-1852 period in which average cohesion increased; if joiners voted less cohesively on average, it was only during the early period, when average cohesion was stable or declining. Columns 3 and 4 indicate that MPs in the last parliament of their career (leavers) voted somewhat less cohesively than other MPs; in Column 4, the main effect of being a leaver is negative and significant at the 0.05 level. When we include both indicators in the regression (Columns 5 and 6), we cannot reject the null hypothesis that joiners and leavers were indistinguishable from other MPs in terms of voting cohesion. Not only are the effects not statistically significant, but the magnitudes of the point estimates are very small, suggesting that the cohesion scores of joiners and leavers did not differ from other MPs by more than about half a percentage point on average.
Are New MPs (Joiners) More Disciplined? Are Exiting MPs (Leavers) Less Disciplined?

Note: The dependent variable is a member’s cohesion score in a parliament. Heteroskedasticity-robust standard errors (in brackets) are clustered by member and parliament. ***p<0.001; **p<0.01; *p<0.05;
 $$^{\dag } $$
p<0.1.
In analysis reported in our online appendix, we carry out the same regressions separately by party to allow for the possibility that replacement may have explained rising cohesion in one party but not the other. We find some evidence that Conservative joiners were marginally more cohesive than other Conservative MPs in the later period (with a coefficient of 0.01), but this is counteracted by evidence that Liberal joiners were less cohesive. In neither party are leavers less cohesive than those who continued on. Taken together, these regressions do not tend to support a replacement story: only for Conservatives do we find that joiners voted more cohesively; the opposite is true for Liberals, and these effects (and all other point estimates) are fairly small in magnitude.
Assessing the Role of Replacement through Member Fixed Effects
We now adopt a slightly different approach to assessing the role of replacement in explaining the increase in party cohesion in this period. Above, we looked for more or less cohesive voting among MPs who enter or exit the Commons. Here our approach is to use member fixed effects to soak up MP-specific variation in cohesive voting; if replacement is an important part of the story, these member fixed effects should explain much of the long-term increase in average cohesion. In this section we assess whether this is the case.
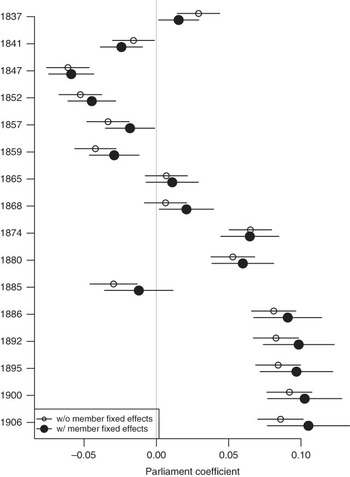
Our first approach is to see if the inclusion of member fixed effects reduces the magnitude of estimated time effects. We ran two regressions; in the first, members’ cohesion scores (parliament by parliament) are regressed only on parliament dummies to get a measure of average cohesion in each parliament. In the second, we carry out the same regression but we add member fixed effects. If replacement helps explain the increase in cohesion over time, the parliament dummies should be smaller in magnitude in the second regression, indicating that some of the over-time variation in average cohesion is explained by the replacement of undisciplined MPs by more disciplined ones. Figure 4, which plots the parliament dummies for the two regressions, indicates that this is not the case. If anything, the magnitude of the parliament effects is larger when member fixed effects are included. Consistent with the above analysis, this indicates that the sustained increase in party cohesion in the second half of the nineteenth century is not due to replacement effects. More formally, we can show that the average magnitude of the parliament dummies is about 4 per cent larger when we include member fixed effects than when we do not, and we are unable to reject the null hypothesis that the magnitude of the parliament dummies is unaffected by the inclusion of member fixed effects.Footnote 66
Do member fixed effects soak up the over-time variation in cohesion? Note: Point estimates and 95 per cent confidence intervals are plotted for the ‘parliament effect’ corresponding to each year shown. The white circles show the estimates for a regression in which cohesion scores are simply plotted on parliament dummies. The black circles show the estimates for the same regression with member fixed effects added. The fact that member fixed effects do not soak up much of the over-time variation is an indication that replacement does not account for the long-term increase in cohesion.

As an additional way of clarifying the role of replacement in explaining the change in discipline over this period, we carry out regressions to see how much of the overall change in cohesion can be linked to changes within an MP’s career. The reasoning is similar to that in the comparison of parliament effects above. If replacement is an important part of the explanation for the long-term increase in cohesion in the House of Commons, then we might expect to find that the cohesion score of the average MP does not change much within his career. If replacement is the key, then the important thing is the replacement of MPs who were intrinsically rebellious by MPs who were inclined to vote with their party. One implication of the replacement story, then, is that any increase in cohesion within an MP’s career should occur at a lower rate than the increase in overall cohesion. If this is not the case – that is, if the average individual MP became more cohesive at the same annual rate as the legislature overall – then this would seem to leave little room for replacement as an explanation of the long-term increase in cohesion.
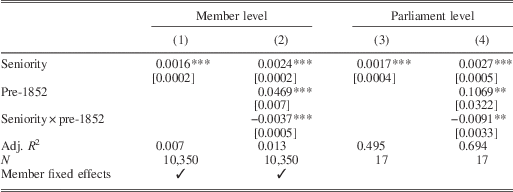
To carry out this test, we regress members’ cohesion scores (one for each parliament) on their seniority at the beginning of the parliament. By including member fixed effects, we measure the effect of seniority within an MP’s career; the MP’s baseline level of cohesiveness is soaked up by the fixed effect. These regression coefficients are reported in Columns 1 and 2 of Table 3. For comparison, in Columns 3 and 4 we report parliament-level regressions in which, having calculated average cohesion for MPs in each parliament, we regress cohesion on seniority (meaning years since 1835) in the same way as in the member-level regression.
How Does the Change in Cohesion within an MP’s Career Compare to the Change in Aggregate Cohesion over Time?

Note: The dependent variable in Columns 1 and 2 is a member’s cohesion score in a parliament; Seniority in those columns refers to the time between the MP’s entry into Parliament and the beginning of a given parliament. The dependent variable in Columns 3 and 4 is the average cohesion score of MPs (Liberals and Conservatives only) in a given parliament; Seniority in those columns refers to the time elapsed between 1835 and the beginning of the parliament. Standard errors (heteroskedasticity-robust and clustered by member and parliament in Columns 1 and 2) in brackets. ***p<0.001; **p<0.01; *p<0.05;
 $$^{\dag } $$
p<0.1.
The remarkable result of this analysis is that during the second half of the nineteenth century (the period during which overall cohesion increased), the change in cohesion within MPs’ careers is essentially the same as the change in average overall cohesion during the same period: the coefficients on Seniority in Table 3 in Columns 1 and 2 are basically the same as the corresponding coefficients in Columns 3 and 4. One implication of this is that all of the increase in average cohesion between 1852 and 1906 can be explained by changes that happen within individual MPs’ careers. Between 1852 and 1906 the mean cohesion score in parliament increased from 0.87 to 0.98, a gain of 0.11. But that is almost exactly equal to the implied gain from our model for an MP serving (hypothetically) the entire period under study: that is,
 $$\hat{\beta }_{{post{\minus}52}} {\times}(1906{\minus}1852)=0.13$$
, with a 0.95 per cent confidence interval of [0.10, 0.15].Footnote
67
To be clear, our argument is not that cohesion increased in the nineteenth century because average seniority increased. In fact, average seniority was, if anything, declining over the period we examine, with steady increases only in the period before the 1850s when cohesion was falling. Rather, our claim is that, because individual MPs became more disciplined at about the same rate as the body as a whole, replacement effects must have been minimal. To see the point more clearly, consider an alternative situation in which all of the increase in cohesion over time is due to replacement. In that case, if we ran a regression like the one reported in Columns 1 and 2 of Table 3 we would find a coefficient of zero on Seniority, with all of the variation in cohesion being soaked up by the member fixed effects. What we find instead is that the member fixed effects evidently explain relatively little of the change in cohesion over time, and thus that cohesion in the House of Commons appears to have increased because MPs voted more cohesively over the course of their careers (for whatever reason), not because undisciplined MPs were replaced by those who voted more cohesively.Footnote 68
ASSESSING AN INDUCEMENTS STORY: PROMOTION TO THE CABINET
We now turn to assessing one channel through which MPs may have been induced to vote with their party whips: the reward of office. Cox addresses this question by comparing the prior voting records of MPs who were awarded ministerial posts to those of MPs who were not awarded ministerial posts.Footnote 69 In analysis of Liberal ministers from 1880–85 and Conservative ministers from 1874–80, he obtains mixed results, and concludes that if ministerial ambition explains increasing party cohesion, it likely does so only for the 1890s and early 1900s. In this section we revisit the question with far more extensive data: every parliament, as opposed to one parliament per party.
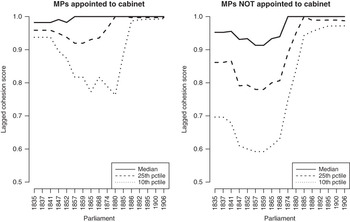
As an initial cut, we compare the distribution of cohesion scores over time of MPs appointed to cabinet positions and those not appointed to cabinet positions. Figure 5 depicts, for each parliament, three quantiles (0.5, 0.25 and 0.1) of cohesion scores for those who were subsequently appointed to the cabinet (left panel) and those who were not (right panel). In particular, we look at all cases in which an MP has not previously served in a cabinet office before that parliament and the MP’s party formed a government during that parliament. We then calculate the median (or 25th percentile or 10th percentile) cohesion score for these cases in the previous parliament (to reflect the idea that MPs may be promoted in a given parliament for loyal voting in the previous parliament). To smooth out the presentation, we compute the quantiles depicted for a given year based on data from all parliaments elected within fifteen years of that year.
Are more cohesive voters more likely to be promoted to the cabinet? Note: Figure indicates quantiles of cohesion scores for MPs who were appointed to the cabinet in a given parliament (left panel) and those who were not (right panel). To smooth the data, each estimate is based on all parliaments within fifteen years of the parliament indicated. MPs are included in the analysis only for parliaments in which they have not previously occupied a cabinet office and their party formed a government at some point during the parliament.

Figure 5 clearly shows that MPs who were not appointed to the cabinet voted less cohesively. Up until the 1870s at least, the median non-appointed MP consistently had a lower cohesion score than the median appointed MP (solid lines), and the same is even more clearly true for the other quantiles. (By the end of the century, cohesion is high enough that it is difficult to distinguish between the two groups of MPs).
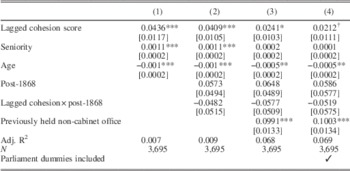
The initial comparison in Figure 5 of MPs who were and were not appointed to the cabinet suggests that party leaders may have rewarded loyal voting with subsequent appointments to cabinet office. Of course, these comparisons of distributions do not control for other differences between MPs who were and were not appointed.Footnote 70 It could be, for example, that MPs who voted more cohesively were also more senior or had served in other official capacities, and that controlling for these differences, the appointees and non-appointees may not differ in voting cohesion. We address some of these concerns in Table 4, which reports regressions in which a binary indicator for whether an MP was appointed to a cabinet position in a parliament is regressed on his lagged cohesion scores, other characteristics and (in Column 4) parliament dummies.Footnote 71 (Again, we restrict attention to MPs who had not previously held cabinet office and who belonged to a party that formed a government in a given parliament).
Are More Cohesive Voters More Likely to be Promoted to the Cabinet?

Note: The dependent variable is 1 if an MP occupied a cabinet office in a given parliament. MPs are included only if they have not previously occupied a cabinet office and if their party formed a government at some point during the parliament. Heteroskedasticity-robust standard errors (in brackets) are clustered by member and parliament. ***p<0.001; **p<0.01; *p<0.05; † p<0.1.
The results of Table 4 are consistent with party leaders offering cabinet positions somewhat more readily to MPs who had previously voted more loyally with party whips. The lagged cohesion score is a statistically significant predictor of the appointment decision in all specifications at the 0.1 level or better. (Also note the low adjusted R 2 across models). The best predictor of whether an MP will be appointed to cabinet office is whether he was previously appointed to non-cabinet office.Footnote 72 The coefficient on age indicates that, conditional on an MP’s seniority, younger MPs are somewhat more likely to be promoted to the cabinet.
It should be noted that the magnitude of the effect of cohesion on subsequent promotion to the cabinet is modest: a rebellious MP with a cohesion score of 0.5 who subsequently votes with perfect loyalty would increase his predicted probability of promotion by just 1 or 2 percentage points, depending on the model. Put differently, those who were and were not promoted differed in previous cohesion by a substantively small amount. Still, the lure of a ministerial post was strong enough that even a small preference for MPs with relatively loyal voting records may have been enough to apply decisive pressure on them to fall in line behind the party whips. A fuller record of data on voting and ministerial promotion thus indicates that ministerial posts were indeed awarded to more loyal MPs and – contrary to the specifics (though in line with the thrust) of Cox’s (Reference Cox1987) conjecture – the difference is particularly evident before the 1870s, when MPs were more rebellious on average.
However modest the effect size, given that the evidence for replacement is dubious, the fact that cohesion increased over time suggests that ministerial promotion became more valuable – or more responsive to behavior – during the period under study. Explaining exactly why this was is beyond the scope of our current efforts. Nonetheless, several reasons may be posited, all of which are interrelated: as the electorate became increasingly party oriented in the sense of Cox, it was the party leaders (rather than local MPs) who were de facto at the forefront of voters’ minds when they went to the ballot box.Footnote 73 One consequence presumably was that prime ministers became more powerful as previously local power bases eroded: they were able to pick members for their ministerial team subject to their performance in divisions, without hindrance from notable backbenchers or their allies. Simultaneously, party voting also encouraged a reorganization in Commons procedure, with more power residing in the cabinet and the opposition front bench.Footnote 74 It is to be expected that being a minister (rather than a relatively impotent backbencher) was increasingly a prize worth seeking – whatever behavior it required.
SUMMARY AND DISCUSSION
The foregoing sections showed the following:
-
1. Average cohesiveness – measured as the proportion of times an MP voted with his whip – was always relatively high, with a baseline of around 0.9 in the 1830s. It dipped in the 1840s, and increased to present-day levels thereafter.
-
2. Almost all the aggregate increase in cohesion in the second half of the nineteenth century was a product of the left tail of discipline scores receding into the main mass of the distribution: that is, rebels became fewer and further between over time.
-
3. Contrary to a replacement story, incoming MPs in this period were not more disciplined than other MPs, nor were exiting ones less so.
-
4. Contrary to a replacement story, and consistent with a number of inducement explanations, the average annual increase in cohesion within an MP’s career after 1850 is about the same as the average annual increase in the cohesion of Parliament as a whole in the same period.
-
5. Consistent with an inducement story, MPs who were promoted to the cabinet in a given parliament tended to have voted more cohesively in the prior parliament.
Abstracting away from the empirical detail, it is clear that legislative party cohesion is important for the functioning of Westminster democracies. Without it, the link between government policy making and voter preferences is broken. Understanding how this institutional arrangement came about has therefore been of critical importance to scholars of history and political science.Footnote 75 Here, we used a massive data collection to shed light on the central question of why members became more disciplined. We matched over 20,000 roll calls from 1836–1910 to individual MP records in order to calculate intra-career changes in cohesion for the first time. We compared accounts focusing on inducement effects – deriving, as we think they do, from a possibly large number of different sources, and encouraging (already-serving) MPs to behave differently in roll calls – to more sociological replacement effects, by which new personnel with new characteristics might drive the patterns we saw. In practice, we were able to reject essentially all claims that the latter school of thought might offer; by implication, endogenous sources of party cohesion offer more promising explanations. We showed that, at a descriptive level, the folding in of the rebellious left tail of the cohesion distribution drove cohesion, and that this general pattern was consistent over time and was not a product of cohort entry and exit dynamics.
Our findings have several broader implications. To the extent that an inducement account is correct and that parties’ changing strategies played a major role, there is evidence of institutional learning, in the sense that actors both learn from and effect the rules and procedures around them. Our focus here on the importance of formal and informal rules of behavior, albeit within a broader context of a changing electorate and other constraints, places this article within the rational choice institutionalism literature.Footnote 76 Secondly, we find that the House of Commons has been remarkably robust to new entrants in terms of procedure; this may mean that in order for certain new types of individuals serving as MPs (for example, womenFootnote 77 ) to have the hoped-for impact on the norms of behavior there, other changes to structural incentives may be required.Footnote 78 Thirdly, whatever the electoral consequences of the Second Reform Act (1867),Footnote 79 the legislative effects of this surge in the franchise appear to have been minimal in terms of average behavior as per Figure 1; parties were already on the way to modern practice by the 1850s. This is in line with suggestions from others,Footnote 80 although we have more comprehensive data to make the point.
We have documented one channel through which backbench troops may have been brought into line (the lure of ministerial promotion), and the evidence we found was modest but tangible. Of course, there are numerous other plausible theories, incluing socialization,Footnote 81 partisanship,Footnote 82 leaders’ increasing rhetorical skill,Footnote 83 agenda control by the executiveFootnote 84 or some combination of the above.Footnote 85 It is difficult to investigate such accounts using the kind of individual-level analysis we have used here, because these mechanisms tend to operate on entire cohorts of MPs. This makes it difficult to isolate the effects of a given mechanism from those of other over-time changes that took place simultaneously. However, such aggregate-level forces are undoubtedly important for explaining the patterns we have documented here, and future scholars may draw on our data to make progress. One option is to use parliamentary speech to get a sense of how MPs talked about votes over time, and possibly to see how this language compared to individual MPs’ voting behavior. Here, extant qualitative historical work on leaders and the culture of the Commons at the time may provide a useful resource.Footnote 86 We leave such efforts for future work.