1. Introduction
Mortality risk benefits constitute the largest component of the quantified benefits of U.S. government regulations (U.S. Office of Management and Budget, Office of Information and Regulatory Affairs, 2015). The value of a statistical life (VSL), which is the risk-money tradeoff for small changes in risk, serves as the benefits measure for monetizing mortality risk reductions. The value that any individual places on reducing mortality risks varies with individual preferences and financial resources. While there is a substantial literature generating revealed preference and stated preference estimates of the VSL for a variety of groups and circumstances, these values may be distorted by publication selection effects. Research on publication selection biases in labor market estimates of the VSL has found that bias-corrected labor market estimates of the VSL are as much as 80% lower than the average value of VSL estimates published in the economics literature (Ashenfelter & Greenstone, Reference Ashenfelter and Greenstone2004; Doucouliagos & Stanley, Reference Doucouliagos, Stanley and Giles2012).Footnote 1 But this shortcoming does not plague all estimates. Subsequent research has demonstrated that labor market VSL studies that rely on the U.S. Census of Fatal Occupational Injuries (CFOI) to calculate occupational fatality rates do not exhibit significant publication selection bias (Viscusi, Reference Viscusi2015; Viscusi & Masterman, Reference Viscusi and Masterman2017 ). In the absence of labor market VSL estimates for most countries other than the USA, the principal alternatives are to use benefit transfer methodsFootnote 2 to calculate a domestic VSL using values calculated with another country’s data ( Masterman & Viscusi, Reference Viscusi and Masterman2017, Reference Masterman and Viscusi2018) or to draw on the growing number of studies that calculate the VSL using stated preference methods (OECD, 2012; Robinson et al., Reference Robinson, Hammitt and O’Keeffe2018).Footnote 3 Stated preference estimates of the VSL have the limitation of being based on hypothetical choices but have the virtue of being highly tailorable to the particular context in which a researcher or policymaker wishes to identify the value of mortality risk reductions.
This article presents the first examination of whether published stated preference VSL studies exhibit significant publication selection bias. The meta-regression model documents the presence of significant publication selection effects, as the true expected value of a stated preference VSL estimate is substantially smaller than the average stated preference VSL in the distribution of published estimates after controlling for relevant covariates. The effect is larger than the effect that previous research has documented in labor market VSLs. Further analysis demonstrates that the bias varies across the VSL distribution with larger estimates exhibiting greater biases. Analyzing various categories demonstrates that no subset of stated preference VSLs are free of statistically significant publication selection biases. The biases are largest in non-peer reviewed publication outlets, health and traffic risk VSLs, and non-U.S. higher income economies. Because estimates from no subsample are free of bias, an income-adjusted VSL calculated using U.S. CFOI data remains the most reliable source of VSLs for benefit-cost analysis.
Prior to this study, the only test for publication selection bias in stated preference estimates of the VSL was Masterman and Viscusi (Reference Masterman and Viscusi2018), which focused on the income elasticity of the VSL and not VSL levels. That work demonstrated that publication selection bias inflated the VSL income elasticity in stated preference VSLs, a critical parameter for benefit transfer between countries or contexts (Lindhjem & Navrud, Reference Lindhjem and Navrud2008; Hammitt & Robinson, Reference Hammitt and Robinson2011). Several studies have performed meta-analyses to analyze the stated preference VSL literature (Dekker et al., Reference Dekker, Brouwer, Hofkes and Moeltner2011; Lindhjem et al., Reference Lindhjem, Navrud, Braathen and Biausque2011; OECD, 2012; Masterman & Viscusi, Reference Masterman and Viscusi2018), though more studies have focused primarily on labor market VSLs (Mrozek & Taylor, Reference Mrozek and Taylor2002; Viscusi & Aldy, Reference Viscusi and Aldy2003; Doucouliagos et al., Reference Doucouliagos, Stanley and Giles2012; Viscusi, Reference Viscusi2015, Reference Viscusi2018; Viscusi & Masterman, Reference Viscusi and Masterman2017 ). A few studies have analyzed the stated preference and labor market VSL literatures in the same meta-analysis dataset (de Blaeji et al., Reference de Blaeji, Florax, Rietveld and Verhoef2003; Kochi et al., Reference Kochi, Hubbell and Kramer2006). As the stated preference literature continues to grow and serve as a resource for benefit-cost analyses in low-income and middle-income countries, it is critical to determine the effect of publication selection on the distribution of stated preference VSLs. The evidence we present in this article demonstrates that policymakers and researchers should not rely on the set of published stated preference VSL estimates to perform benefit-cost analyses, as such estimates are systematically larger than bias-adjusted individual willingness to pay for mortality risk reductions. The evidence here adds to concerns with stated preference research, including hypothetical biases and the costly nature of well-designed studies.
The remainder of this article proceeds as follows. Section 2 presents our methodology. We test for publication selection bias using funnel plot analysis, weighted least squares (WLS) regression, and quantile regression. Section 2 also presents our meta-analysis data set. We utilize a sample of 1148 stated preference VSL estimates drawn from 85 studies. Section 3 presents our analyses. The results indicate substantial publication selection bias in our sample of stated preference VSLs. In Section 4, we discuss the implications of our results for global benefit-cost analyses. Since all groups of stated preference studies were subject to substantial publication selection biases, such studies do not provide a sound approach to benefit assessment even in countries for which revealed preference evidence is not available.
2. Methods
2.1 Empirical approach
2.1.1 Funnel plot
Publication biases arise when authors selectively report their research results and journals systematically avoid publishing certain empirical results. Such biases have been documented for many empirical estimates of economic parameters, consequently limiting the use of economics research in policy (Doucouliagos, Reference Doucouliagos, Paldam and Stanley2018). If a set of empirical estimates is subject to publication selection bias, the distribution of published estimates will not accurately reflect average valuations in the population of interest; officials that rely on such published estimates to tailor policy are more likely to promulgate inefficient regulations.
Previous research has demonstrated several different sources of selection bias.Footnote 4 Unsurprisingly, authors and journals systematically avoid publishing statistically insignificant results. Publication selection bias also decreases the probability that empirical results which are inconsistent with theory will be published.Footnote 5 Relatedly, there may exist an accepted or conventional range for a parameter, decreasing the probability that empirical estimates outside of that range are published. Because the early VSL literature focused on the USA (Viscusi & Aldy, Reference Viscusi and Aldy2003), which has higher average incomes than most of the world, the conventional range of VSL estimates is substantially higher than empirically appropriate in many non-U.S. settings. U.S. studies continue to constitute the majority of labor market VSL estimates (Bellavance et al., Reference Bellavance, Dionne and Lebeau2009). As a result, researchers have hypothesized that the relatively larger publication selection bias in non-U.S. labor market VSLs is the result of non-U.S. studies anchoring on U.S. VSL estimates (Viscusi & Masterman, Reference Viscusi and Masterman2017 ). Anchoring on the existing range of VSLs therefore could provide another source of publication selection bias in stated preference studies of the VSL.
We test for publication selection bias in our meta-analysis sample using three methods: a funnel plot, WLS regression, and quantile regression. A funnel plot is an instrument that permits visual inspection of publication selection bias. In a funnel plot, estimated values are on the horizontal axis, while the inverse standard error of the estimate is on the vertical axis. In a nonbiased sample, the estimates would form a symmetric funnel around the true mean value with the most precisely estimated values being closest to the mean. Publication selection bias will cause an abnormal funnel plot; positive publication bias shifts the mass of the distribution to the right, creating a positive correlation between the standard error of an estimate and its value (Stanley & Doucouliagos, Reference Stanley and Doucouliagos2012). Conversely, negative publication bias shifts the mass of the distribution left, creating a negative correlation between the standard error and the estimate value. Large outliers on one side of a distribution, but not the other, or bunching at particular thresholds (such as zero), are easy-to-detect visual signs of bias. A funnel plot test has the advantage of providing a simple, visual method for detecting potential bias, but it does not account for factors that could lead to heterogeneity of the parameter or its standard error.
2.1.2 Meta-regression weighted least squares analysis
The primary weakness of a funnel plot test of publication selection bias is the inability of the figure to account for heterogeneity among studies (Stanley, Reference Stanley2008; Stanley & Doucouliagos, Reference Stanley and Doucouliagos2014). If study characteristics other than publication bias lead to a systematic relationship between the VSL and its standard error, the funnel plot may overstate or understate the extent of publication selection bias. For example, more homogenous study populations and smaller samples in studies of the VSL in low-income economies could induce a negative correlation between the VSL and its standard error. Our second test, WLS regression, is a statistical analogue to the funnel plot test that permits controlling for study heterogeneity. Our WLS model regresses the VSL on its standard error for each estimate
 $ j $
. Our estimating equation is of the following form:
 $$ {VSL}_j={\beta}_0+{\beta}_1\times {Standard\ error}_j+{X}_j\beta +{\epsilon}_j. $$
The regression weights are the inverse variance of each VSL estimate. If our sample exhibited no publication selection bias, there would be no correlation between the standard error of the VSL and the VSL itself; a correlation between the standard error of the VSL and the VSL is equivalent to a skewed funnel plot (Stanley & Doucouliagos, Reference Stanley and Doucouliagos2012). Therefore, a statistically significant estimate of
 $ {\beta}_1 $
is evidence of publication selection bias. The term
 $ {X}_j $
corresponds to the covariates that we include in the model. In the covariate model, the bias-corrected VSL value is given by
 $ {\beta}_0+\overline{X}\beta $
, where
 $ \beta $
is a vector of estimated coefficients and
 $ \overline{X} $
is a vector containing the mean value of each appropriate corresponding explanatory variable.Footnote
6 To further address any heterogeneity among VSL estimates not included in our covariate model, we also estimate Equation (1) including fixed effects for each article in our sample.Footnote
7 In all WLS models, we present heteroskedasticity-robust standard errors as well as standard errors that are robust and clustered on the articles from which the VSL estimates are drawn.
2.1.3 Quantile meta-regression analysis
Estimating Equation (1) using WLS can only present the average effect of publication selection bias. However, any such biases need not be uniform throughout the VSL distribution. For example, the WLS test would fail to demonstrate whether biases only or disproportionately affect large or small VSLs. To test whether publication selection bias exists or differs throughout the VSL distribution, we utilize quantile regression. Similar to our WLS estimating equation, the quantile regression equation takes the following form:
 $$ {VSL}_j^{(q)}={\beta}_0^{(q)}+{\beta}_1^{(q)}\times {Standard\ Error}_j+{X}_j{\beta}^{(q)}+{\epsilon}_j^{(q)} $$
In Equation (2),
 $ q $
denotes the quantile of interest. Similar to
 $ {\beta}_0 $
and
 $ {\beta}_1 $
in Equation (1), a statistically significant estimate of
 $ {\beta}_1^{(q)} $
indicates that publication selection bias exists at the
 $ q $
quantile. As with Equation (1), we estimate a base model and a covariate model of Equation (2) to address estimate heterogeneity.
2.1.4 Subsample analysis
Finally, we repeat our WLS analysis on several subsamples of our data to explore whether any subsample of stated preference studies are free of statistically significant publication selection bias. We compare the extent of publication selection bias across the following dimensions: (i) publication source (peer-reviewed journal or other source), (ii) the type of risk used to calculate the VSL (health, environmental, or traffic), (iii) income level (USA, other high-income economies, upper-middle-income economies, and lower-middle-income economies), and (iv) the “quality” of the study. Following Lindhjem et al. (Reference Lindhjem, Navrud, Braathen and Biausque2011) and OECD (2012), our high-quality stated preference VSL subsample omits estimates that (i) lack information about the magnitude of the risk-change used to calculate the VSL; (ii) use samples not representative of the area they are drawn from; and (iii) are calculated from a sample with less than 100 subjects or are from a study with a total sample size less than 200.Footnote 8
We test for differential publication selection bias across these samples because there are strong reasons to expect such differences a priori. Authors presenting a VSL estimate in a conference or discussion paper may seek to present their strongest results, while reserving weaker results for journal publication where they can be presented but deemphasized. When reports are prepared for policymakers, the estimates may be tailored to pursue the goals of the body seeking the estimates. In contrast, peer-reviewed journals primarily check that the methodology an article employed is sound but should be relatively more agnostic about the results. Publication bias may similarly vary based on what type of risk is used to estimate the VSL. Labor market VSLs primarily address occupational injury risks, many of which are related to motor vehicles. In contrast, many stated preference studies have sought to determine whether VSLs are higher or lower in different contexts, including environmental hazards (Carthy et al., Reference Carthy, Chilton, Covey, Hopkins, Jones-Lee, Loomes, N. Pidgeon and Spencer1999; Alberini, Reference Alberini2005; Vassanadumrongdee & Matsuoka, Reference Vassanadumrongdee and Matsuoka2005; Hammitt & Zhou, Reference Hammitt and Zhou2006), traffic safety (Chilton et al., Reference Chilton, Covey, Hopkins, Jones-Lee, Loomes, Pidgeon and Spencer2002; de Blaeji et al., Reference de Blaeji, Florax, Rietveld and Verhoef2003), and health risks (Hammitt & Liu, Reference Hammitt and Liu2004); meta-analyses of such studies have occasionally found that environmental VSLs are larger than traffic VSLs (Dekker et al., Reference Dekker, Brouwer, Hofkes and Moeltner2011). If the more injury-based VSL estimates are an anchor that defines a range of publishable VSLs, authors may be more willing to report and outlets more willing to publish estimates outside of the conventional range if they illuminate willingness-to-pay for reductions in different types of risk.
The last two categories that we examine – comparing income groups as well as “high-quality” and “low-quality” studies – expand upon the findings of previous publication selection bias research. Viscusi and Masterman (Reference Viscusi and Masterman2017) hypothesized that U.S. labor market studies of the VSL serve as an anchor for non-U.S. studies, causing greater publication selection bias in the latter subsample. Comparing VSLs across national income groups will confirm whether that result holds in this sample and whether the extent of anchoring varies with income. Viscusi (Reference Viscusi2018) demonstrated that meta-analysis samples restricted to the “best estimate” from included studies induce even greater selection biases in labor market VSLs. Masterman and Viscusi (Reference Masterman and Viscusi2018) provided suggestive evidence that high-quality stated preference estimates exhibited a similar “high-quality bias,” but testing for publication selection bias was not a focus of that article.
2.2 Meta-analysis sample description
Our sample is substantially identical to the sample of stated preference estimates utilized in Masterman and Viscusi (Reference Masterman and Viscusi2018).Footnote 9 It draws on the database of stated preference VSL estimates published by the OECD, which contains 1013 VSL estimates.Footnote 10 Lindhjem et al. (Reference Lindhjem, Navrud, Braathen and Biausque2011) and OECD (2012) used the same database to construct their meta-analyses samples. As in Masterman and Viscusi (Reference Masterman and Viscusi2018), we augment the OECD database using nine studies identified in Robinson et al. (Reference Robinson, Hammitt and O’Keeffe2018), which identified studies estimating the VSL in lower- and middle-income countries.Footnote 11 Our initial sample contains 1256 stated preference estimates of the VSL. From this sample, we dropped 108 estimates that were meta-analysis estimates or median estimates of the VSL. Meta-analysis estimates are inappropriate for inclusion because including them would double-count other observations in our sample. Median estimates are inappropriate because they are a different measure of the central tendency of individual preferences than the mean VSL, which constitute the majority of our sample. Finally, the standard error of a VSL estimate is the essential explanatory variable in testing for publication selection biases, so having either the standard error or being able to estimate the standard error using the sample size is critical. We take the standard error of the VSL that the authors of the study provided for their estimate when available. When the study provided enough information to calculate the standard error (such as by providing the standard error of the appropriate regression coefficient), we used the available information to calculate the standard error ourselves. Finally, for cases where the standard error itself was not available but the sample size of the study was, we estimated and imputed the standard error using the sample size as described in Masterman and Viscusi (Reference Masterman and Viscusi2018). After omitting the estimates for which no standard error was available or could be constructed, our sample includes 1148 stated preference VSL estimates.
Our focus on the OECD sample and the additional studies from Robinson et al. (Reference Robinson, Hammitt and O’Keeffe2018) is unlikely to meaningfully bias our analysis. The OECD (2012) study imposed very few criteria when compiling its database; its stated aims were to include “all [stated preference] based valuation studies that provide one or more VSL estimates – or sufficient information so that the implied VSL could be calculated.” Robinson et al. (Reference Robinson, Hammitt and O’Keeffe2018) identified additional studies from low-income economies but only included studies meeting reasonable quality criteria. The analyses in Section 3 explicitly control for sample income and find that sample income does not eliminate evidence of publication selection bias. Moreover, our subsample analysis demonstrates that “high-quality” studies exhibit greater publication selection bias than the whole sample of studies, but excluding studies on the basis of perceived quality is not sufficient to account for all publication selection bias.
Table 1 presents the summary statistics of our meta-analysis sample. The average VSL in the sample is $8.5 million.Footnote 12 The mean standard error in our sample is $3.5 million. Our estimates are drawn from a diverse group of countries. Our sample contains VSL estimates from Austria, Bangladesh, Belgium, Brazil, Canada, Chile, China, Czech Republic, Denmark, France, India, Italy, Japan, Malaysia, Mongolia, the Netherlands, New Zealand, Norway, Poland, Sudan, Sweden, Switzerland, Taiwan, Thailand, Turkey, the UK, and the USA. Estimates of the VSL using a U.S. sample constitute only 10.3% of our sample; 51.3% of the estimates in our sample from outside the USA are from other high-income countries, 31.2% are from upper-middle-income countries, and the remaining 7.2% are from lower- to middle-income countries.Footnote 13
Summary statistics.

N = 1148.
The average estimate in our sample was calculated from a sample with an income of $31,457. Our observations are roughly evenly divided between estimates published in journal articles or from other sources such as published conference papers, discussion papers, and books. The mean age of respondents reflected in our sample was 44.6 years. The average risk change used to calculate the VSL was very large – 3.5 deaths per 1000 individuals. This risk change is dramatically larger than the fatality risk used in labor market studies – VSL estimates drawing on the CFOI have an average fatality risk of 1 in 25,000 workers (Bellavance et al., Reference Bellavance, Dionne and Lebeau2009; Masterman & Viscusi, Reference Masterman and Viscusi2018). The stated preference sample mean risk change is more than three times the average fatality rate of workers in the U.S. logging industry, the industry with the highest occupational fatality rate in 2016 according to publicly available CFOI data. Half of the VSL estimates in our sample used a questionnaire asking subjects to value a change in a health risk to calculate the VSL, while 30% used a traffic risk and 20% used an environmental risk.
3. Results
3.1 Funnel plot test
Figure 1 presents the funnel plot of our sample of stated preference VSL estimates. The value of the VSL is on the horizontal axis, and the precision of the estimate is on the vertical axis. In contrast to the unbiased funnel discussed in Section 2, Figure 1 indicates large publication selection biases in stated preference VSL estimates. Starkly, no clear “funnel” presents itself. Many precise and imprecise estimates cluster against the vertical axis, yielding a shape more similar to an “L” rather than the ideal symmetric plot. A similar pattern is present in the distribution of non-U.S. labor market VSL estimates (Viscusi & Masterman, Reference Viscusi and Masterman2017). The plot exhibits a long right tail of imprecise estimates; 40 estimated VSLs are larger than $50 million.
Funnel plot of VSL estimates.

3.2 Weighted least squares test
Table 2 presents the results of estimating Equation 1 on our sample. The first column presents our base model, the second column presents our covariate model, and the third column presents a model including article fixed effects. Table 2 provides both the robust standard errors associated with our estimated coefficients as well as standard errors clustered on the article from which each VSL is drawn. The results confirm the visual inspection of Figure 1 – stated preference estimates of the VSL are subject to large and statistically significant publication selection biases, even after controlling for probable sources of heterogeneity. In all three models, the coefficient on standard error is highly significant using either robust standard errors or the standard error clustered on each article. The covariate and fixed effects model R-squared values are 0.74 and 0.90, indicating that the included variables controlling for most of heterogeneity in VSL estimates. The effect of the publication selection bias on the observed average VSL is very large. The bias-adjusted base VSLs for the base, covariate, and fixed effects models are $13,000, $514,000, and $890,000. Publication selection bias accounts for $7.6–$8.5 million of the observed average stated preference VSL.
Weighted least squares estimates of the VSL.

N = 1148. Regressions are weighted using the inverse variance of each observation. Robust standard errors in parenthesis, standard errors robust, and clustered on article in brackets. Covariate model includes an indicator variable controlling for observations where the level of the risk change is missing.
Abbreviation: VSL, value of a statistical life.
*** p < 0.01.
** p < 0.05.
* p < 0.10.
The remaining coefficients in Table 2 are consistent with expectations and previous research. The coefficient on income is positive and significant. The 0.015 and 0.020 income coefficients corresponds to a mean bias-corrected income elasticity of 0.71–0.90, consistent with previous estimates of the VSL income elasticity in stated preference and non-U.S. labor market studies (Viscusi & Masterman, Reference Viscusi and Masterman2017 ; Masterman & Viscusi, Reference Viscusi and Masterman2017, Reference Masterman and Viscusi2018). The coefficient on age is small but positive in the covariate model (though insignificant using clustered standard errors) and small, negative, and significant in the fixed effects model, consistent with the complex relationship between age, health, and mortality valuation identified in previous research (Alberini et al., Reference Alberini, Cropper, Krupnick and Simon2004; Krupnick, Reference Krupnick2007; Aldy & Viscusi, Reference Aldy and Viscusi2008; Cameron & DeShazo, Reference Cameron and DeShazo2013). The coefficients on the size of a fatality risk change are statistically insignificant. The insignificant coefficient for risk change indicates that respondents respond adequately to scope changes after other study characteristics are accounted for (Hammitt & Graham, Reference Hammitt and Graham1999; Lindhjem & Navrud, Reference Lindhjem and Navrud2008). The insignificance of the traffic fatality coefficient in the fixed effects model is consistent with labor market VSL research finding no difference between labor market VSLs calculated using traffic workplace fatalities and other workplace fatalities (Viscusi & Gentry, Reference Viscusi and Gentry2015).
Meta-analysis tests for publication selection bias in stated preference VSLs present at least one confounding issue that is not present in similar studies of labor market VSLs: the survey instruments for measuring individual willingness to pay for mortality risk reductions do not usually permit respondents to provide a negative willingness-to-pay values. This structure could mechanically induce a correlation between the VSL and its standard error if imprecise small VSLs cluster at zero. However, this mechanical feature of stated preference VSLs does not threaten the validity of our results. First, designing instruments that make values inconsistent with theory impossible to observe is itself a form of selection bias; it merely occurs at the study design stage rather than the reporting stage. Second, as demonstrated in the appendix tables, the publication selection bias that we observe persists if we restrict our sample or use alternative specifications to account for the mechanical features of stated preference VSLs. In particular, Table A1 tests for publication selection bias using tobit regression, by restricting the sample to a symmetric domain around the mean VSL in our sample, and by using a log-log specification. All results are consistent with those in the main text.
3.3 Quantile regression test
Table 3 presents our quantile regression results. For reference, Panel A presents the raw observed VSL at the 5th, 10th, 25th, 50th, 75th, 90th, and 95th percentiles of the VSL distribution. The median VSL estimate is $2.1 million, far lower than the mean estimate of $8.5 million. As Figure 1 demonstrated, the right tail of the distribution is far longer than the left; the 95th percentile VSL is $27.4 million, while the 5th percentile VSL is $0.1 million. Panel B presents our base model, where the only explanatory variable is standard error. Panel C augments the analysis in Panel B by including the same variables from the covariate model of Table 2, though the estimated coefficients for those variables are omitted from Table 3 for brevity.Footnote 14
Quantile regression estimates of the bias-adjusted VSL.

N = 1148. Bootstrapped standard errors calculated using 500 repetitions in parentheses. Covariate models include income, age, fatality risk change, an indicator variable controlling for observations where the level of the risk change is missing, and indicator variables corresponding to whether the elicitation instrument presented subjects with an environmental or traffic risk.
Abbreviation: VSL, value of a statistical life.
*** p < 0.01.
** p < 0.05.
* p < 0.10.
Our quantile regression results demonstrate that the distribution of stated preference VSL estimates exhibit significant publication selection biases that increase over the VSL distributions. Each estimated coefficient on standard error is positive and highly statistically significant. The degree of publication selection bias increases over the VSL distribution; at the 5th percentile, the coefficient on standard error is only 0.6, but at the 95th percentile, the coefficient is seven times larger at 4.2. The increasing publication selection bias parallels labor market estimates of the VSL (Viscusi & Masterman, Reference Viscusi and Masterman2017). In the base model, the bias-adjusted 5th percentile estimated VSL in the base model is $0.1 million, the bias-adjusted median VSL is $0.7 million, and the bias-adjusted 95th percentile estimated VSL is $3.2 million. The base model estimates are 61–88% lower than the corresponding raw VSL estimates. In the covariate model, the 5th percentile bias-adjusted VSL is $0.1 million, the median bias-adjusted VSL is $1.7 million, and the 95th percentile bias-adjusted VSL is $2.8 million. The covariate model adjusted estimates are only 20.4–65% lower than the raw VSL estimates at the 50th percentile and below, while the 75th, 90th, and 95th percentiles are 71%, 87%, and 90% lower than the corresponding unadjusted estimates.
Figure 2 graphically presents the estimated bias-corrected VSL distribution. Figure 2 shows the estimated bias-corrected VSL in the base and covariate quantile regression models, as well as the observed VSL distribution in the literature. The VSL level is on the horizontal axis, while the VSL percentile is on the vertical axis. The figure confirms the observations made for Table 3 – publication selection bias is more severe for higher VSLs. The raw, base, and covariate distributions are nearly indistinguishable at the 5th percentile. By the median of the distribution, the base model bias-corrected is approximately 33% as large as the raw estimate. The covariate model and observed VSLs are barely distinguishable until the 40th percentile. By the 95th percentile, the base model and covariate model VSLs converged but are both dwarfed by the raw VSL. For small VSLs, the distribution exhibits small but significant publication selection biases, but the highest VSLs exhibit biases that are huge relative to the base VSL.
VSL distribution.

3.4 Subsample analysis
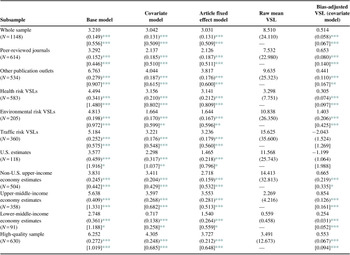
To test whether there are any major groups of stated preference studies not subject to publication selection biases, Table 4 examines the impact of publication selection bias across several subsamples. Each entry in the first three columns of the table is the standard error coefficient in a different regression. The first column of Table 4 is the standard error coefficient in our base model WLS regression, limited to the identified subsample. The second and third columns are the standard error coefficient in our covariate and fixed effects models, including the same variables as identified in Table 2. The fourth column is the raw mean VSL of the identified subsample, while the final column is the bias-adjusted mean VSL calculated using our covariate model results.Footnote 15 To facilitate comparison, Table 4 also presents the whole sample results from Table 2 as the first entry. Where appropriate, Table 4 groups mutually exclusive subsamples to demonstrate differences in publication selection bias between the samples.
Standard error coefficient by subsample.

Regressions are weighted using the inverse variance of each observation. Robust standard errors in parenthesis, standard errors robust, and clustered on article in brackets for regression results and adjusted VSLs. Standard deviations in parentheses for raw means. All regressions included the average income and age of the underlying sample, the risk change used to calculate the VSL, an indicator variable controlling for observations where the level of the risk change is missing, and an indicator variable for environmental and traffic risks (risk-type indicators are omitted in the risk-subsamples).
*** p < 0.01.
** p < 0.05.
* p < 0.10.
Comparing the subsamples demonstrates significant differences in publication selection bias based on publication outlet, risk type, country of estimate, and estimate quality. In each subsample, the bias-corrected mean VSL is significantly smaller than the raw mean VSL. U.S. and traffic risk estimates exhibit the largest relative decrease (resulting in VSLs that are statistically insignificant), while lower-middle-income economy estimates decrease the least (54.5%). The standard error coefficient in the peer-reviewed journal subsample approximately is half the size of the corresponding coefficient for other publication outlets. The difference between the coefficients is highly significant (p < 0.01), regardless of which standard error or model is utilized. This result is consistent with authors being significantly more selective about what estimates they present in conference and discussion papers relative to those presented in journal articles. Table 4 also presents evidence that selection bias differs by risk type. The coefficient on standard error in the environmental risk subsample is half the size of the coefficients from the other two subsamples in the covariate model, statistically significantly different from both the traffic risk and health risk subsamples’ standard error coefficients at the 1% level using robust standard errors. The risk type results suggest that selection bias is less problematic when researchers are estimating a VSL for a risk type that labor market studies cannot capture.
Comparing selection bias across income groups demonstrates that U.S estimates exhibit less publication selection bias than other upper-income and upper-middle-income economy estimates, though lower-middle-income economy estimates demonstrate relatively less publication selection bias. In the base model, the upper-middle-income economy estimates are significantly larger than the U.S. estimates and other upper-income economy estimates using robust standard errors (p < 0.01). Similarly, the base model lower-middle-income economy standard error coefficient is significantly smaller (p < 0.01) than the U.S. and other upper-income VSL estimates. In the covariate model and fixed effects models which control for the actual income level within each group, U.S. studies actually exhibit lower publication selection bias than the upper- or upper-middle-income economy samples (p < 0.01 using robust standard errors). The standard error coefficients for upper-income-economies and upper-middle-income economies are statistically indistinguishable. In the covariate and fixed effects model, the lower-middle-income economy coefficient remains smaller than the upper and upper-middle-income economies with both standard errors (p < 0.01). The lower-middle-income economy standard error coefficient is actually statistically smaller than the U.S. coefficient in the covariate model using robust standard errors (p < 0.01), and narrowly insignificantly different using clustered standard errors (p = 0.125), though the effect dissipates when article fixed effects are included.
Finally, comparing the standard error coefficient in the high-quality sample demonstrates a selection bias unique to screening out VSL estimates that are perceived to be low quality. The high-quality standard error coefficient is nearly twice as large as the whole sample’s coefficient in the base model, almost 1.5 times as large in the covariate model and 25% larger in the fixed effects model. The difference between the coefficients in the base model is statistically significant at the 5% level using either standard error calculation, while the covariate and fixed effects model differences are statistically significant at the 5% level only with robust standard errors. These results reiterate that the optimal methodology for synthesizing the results of multiple VSL studies is not to exclude undesirable estimates, even where the rationale for exclusion is reasonable. Rather, including such observations in a meta-analysis sample and including explanatory variables that account for undesirable characteristics of an estimate reduces the selection bias that screening for high-quality estimates creates.
4. Discussion
The foregoing analyses demonstrate that publication selection bias is a serious problem leading to overstated average stated preference VSLs. After adjusting for biases, we find an average bias-adjusted VSL that is only 5% of the raw observed mean. The observed bias is substantial, but comparable to the magnitudes found in labor market VSL, which exhibit observed VSLs that are overstated by as much as 80%. The effect of publication selection bias is largest for big VSLs – only VSLs above the median observed VSL are overstated by more than $1 million. Accordingly, relying on stated preference research is most problematic when the population of interest has relatively higher incomes. Policymakers in higher income countries should avoid using published stated preference VSLs in benefit-cost analysis, as the distribution of published estimates substantially overstates individual willingness-to-pay.
Our subsample analysis reinforces the results from our base analyses. None of the subsamples considered are free of publication selection bias, though significant heterogeneity exists in the size of the effect by subsample. Consistent with the labor market VSL results in Viscusi and Masterman (Reference Viscusi and Masterman2017 ), international VSLs exhibit statistically significant publication selection biases in excess of the biases in U.S. estimates, though VSLs calculated for lower to middle-income economies exhibit smaller biases than other countries. However, the U.S. stated preference estimates themselves exhibit statistically significant selection bias, demonstrating that not all of the selection bias in stated preference estimates is attributable to anchoring on U.S. estimates. Anchoring on labor market VSLs generally may contribute. The labor market VSL literature largely predated the stated preference literature, and researchers and journals may reject results that do not comport with levels exhibited in comparable labor market studies in the USA. The subsample results provide further evidence that non-U.S. policymakers in high-income countries should avoid stated preference VSLs, as they are certainly inflated and potentially inappropriately anchor on U.S. estimates. Benefit-cost analysis in lower income countries will be relatively less flawed if it draws on stated preference research, but it does not follow that policymakers in such countries should use stated preference results to value mortality risk reductions. As stated above, no VSL subsample that we analyzed was free of bias. Moreover, publication selection bias is not the only problem endemic to stated preference research. Hypothetical bias is always a potential threat in stated preference research and fielding well-designed studies that survey a large and demographically representative sample is very expensive.
Researchers and officials should generally avoid applying estimates from the existing stated preference literature to evaluate health and safety regulations. However, our recommendation against using stated preference VSLs does not mean that we recommend policymakers forgo benefit-cost analysis as a regulatory tool. Quite the contrary, we recommend that policymakers instead calculate a VSL by adjusting a U.S. VSL from labor market CFOI studies for income differences between the population of interest and the USA. The set of U.S. VSLs calculated using the CFOI do not exhibit statistically significant publication selection bias, yielding a reliable base VSL of $9.6 million. Depending on the context, policymakers can adjust the VSL based on income differences between the USA and the population of interest using the income elasticity of the VSL. Current evidence indicates that the income elasticity of the VSL in the USA and other high-income countries is substantially smaller than in low- and middle-income economies. Based on previous research, we recommend an income elasticity of 0.55 in high-income countries and 1.00 in low-income economies. Other studies recommend even higher income elasticity levels (Hammitt et al., Reference Hammitt, Geng, Guo and Nielson2019). Until more low-income economies maintain labor market and fatality risk data that enable accurate calculation of the VSL and publication selection biases cease plaguing VSL estimates (both stated preference and non-CFOI labor market), benefit transfer from CFOI VSL estimates remains the best way to calculating the VSL outside of the USA.
Supplementary material
To view supplementary material for this article, please visit https://doi.org/10.1017/bca.2020.21.