The global increase in food demand and the inception of new agricultural technologies to further increase yields, among other factors, have favored the expansion and intensification of crops worldwide (Foley et al. Reference Foley, DeFries, Asner, Barford, Bonan, Carpenter, Chapin, Coe, Daily, Gibbs, Helkowski, Holloway, Howard, Kucharik, Monfreda, Patz, Prentice, Ramankutty and Snyder2005; Matson et al. Reference Matson, Parton, Power and Swift1997). The rise of global agricultural production has been achieved not only by increasing yields through crop breeding and greater use of off-farm inputs, but also by introducing marginal lands into annual cropping (Tilman et al. Reference Tilman, Balzer, Hill and Befort2011). Marginal lands for agriculture are not only less productive, but they are also usually more susceptible to degradation due to continuous, intensive farming. On the one hand, in arable lands recently converted to agriculture, the high productivity levels usually achieved in the first cropping seasons are the consequence of high soil fertility and low weed pressure, due to the maladaptation of the original vegetation to continuous farming (Martínez-Ghersa et al. Reference Martínez-Ghersa, Ghersa and Satorre2000). On the other hand, in a crop field, weed species composition is assembled in response to both periodic and episodic agricultural interventions, such as burning, plowing, fertilization, and herbicide use. (Martínez-Ghersa et al. Reference Martínez-Ghersa, Ghersa and Satorre2000). Therefore, current species composition of weed communities is also influenced by both the floristic composition of the original vegetation and the introduction of new species. Weed seedbank entangles the species compositions of past and current weed communities, which are in turn affected by recurrent farming practices, thus determining the future composition of weed communities and soil seedbank (Cardina et al. Reference Cardina, Herms and Doohan2002).
Weed community structure and dynamics are determined by the environmental conditions created by agricultural practices, such as tillage systems, herbicide use, and cropping history (Booth and Swanton Reference Booth and Swanton2002; Martínez-Ghersa et al. Reference Martínez-Ghersa, Ghersa and Satorre2000). Furthermore, crop dominance over weeds is also a determining factor in weed community assembly. Crop dominance is defined as the structuring influence of dense and homogeneous stands of crop plants over the subordinated, companion weeds (Poggio and Ghersa Reference Poggio and Ghersa2011). Thus, weed composition may differ between contrasting crop types as a result of their differences in canopy architecture, physiology, row spacing, different resource use patterns, and management practices (Mas et al. Reference Mas, Verdu, Kruk, De Abelleyra, Guglielmini and Satorre2010; Poggio and Ghersa Reference Poggio and Ghersa2011; Poggio et al. Reference Poggio, Satorre and de la Fuente2004). Among these factors, one of the most important ecological processes involved is the environmental changes resulting from crop canopy presence. Thus, the modification of the light environment under the crop canopy has a paramount influence on the morphology and phenology of crops and weeds (Ballaré and Casal Reference Ballaré and Casal2000; Rajcan and Swanton Reference Rajcan and Swanton2001), and it also affects both dormancy release and germination of weed seeds (Benech-Arnold et al. Reference Benech-Arnold, Sanchez, Forcella, Kruk and Ghersa2000).
The expansion of agriculture to marginal lands with short histories of continuous farming and the introduction of new crop types provide interesting scenarios for studying weed community assembly. In central Argentina, agriculture has expanded westward from the humid Pampas toward the semiarid Espinal, primarily at the expense of converting native, xerophytic forest ecosystems into croplands (Demaría et al. Reference Demaría, Aguado Suárez and Steinaker2008; Viglizzo et al. Reference Viglizzo, Frank, Carreño, Jobbágy, Pereyra, Clatt, Pincén and Ricard2011). Corn (Zea mays L.)and, more recently, soybean [Glycine max (L.) Merr.] are the two main crop species in this semiarid region. In spite of the higher water limitation of this region, farmers have adopted similar agronomic strategies to those applied in the more humid Pampas (Viglizzo et al. Reference Viglizzo, Frank, Carreño, Jobbágy, Pereyra, Clatt, Pincén and Ricard2011), including no-tillage cultivation and the use of herbicide-tolerant varieties. Massive adoption of no-tillage to replace plowing has contributed to reduce soil erosion risks and direct soil evaporation (Mendez and Buschiazzo Reference Mendez and Buschiazzo2010), two factors that impose severe limitations on growing field crops in the semiarid Espinal. Indeed, no-tillage allowed for the conversion of less productive, semiarid rangelands into annual cropping systems that are more profitable for farmers. Consequently, soybean is nowadays the most important crop type in this dry region. While soybean was introduced three decades ago, the main reason explaining its rapid expansion of soybean during the 1990s is the better adjustment of soybean to climatic limitations due to genetic improvement as well as the relatively higher profitability of growing soybean rather than other summer annual crops (Appendix A). Corn, which was the most important summer crop in the region for more than a century, is currently the second crop in acreage since the expansion of soybean took place (Garay and Colazo Reference Garay and Colazo2015; Appendix A). However, growing corn in crop sequences is considered a key practice to reduce the negative impacts of the soybean monoculture, such as the loss of organic soil matter in the topsoil (Díaz-Zorita et al. Reference Díaz-Zorita, Duarte and Grove2002).
Weed community assembly has been largely studied by focusing on crop management within fields (Booth and Swanton Reference Booth and Swanton2002; Poggio et al. Reference Poggio, Satorre and de la Fuente2004). Moreover, the prevalence of environmental and agronomic factors on the structuring of weed communities has been recognized for cropping systems in the humid Pampas (de la Fuente et al. Reference de la Fuente, Suárez and Ghersa2006; Poggio et al. Reference Poggio, Satorre and de la Fuente2004, Reference Poggio, Chaneton and Ghersa2013). Thus, in the Rolling Pampa, the corn belt of Argentina, weed communities differed from cereal and legume crops in both the cool and warm seasons. Such differences were attributed to different canopy dynamics and resource use patterns (Poggio et al. Reference Poggio, Satorre and de la Fuente2004, Reference Poggio, Chaneton and Ghersa2013). In the drier conditions of the Espinal region, we also expected that the weed communities occurring in corn and soybean crops would be different, mainly due to the fact that both crops differ in their agronomic management and growth potential, which result from different physiology and resource use patterns.
Environmental filtering over weed communities could be explained by functional composition, in addition to floristic composition (Díaz et al. Reference Díaz, Cabido and Casanoves1998). Grouping species into functional groups may help to understand ecological processes associated with management practices and differential environmental conditions due to crop identity that act by filtering and structuring weed communities (de Bello et al. Reference de Bello, Lavorel, Díaz, Harrington, Cornelissen, Bardgett, Berg, Cipriotti, Feld, Hering, Martins da Silva, Potts, Sandin, Sousa, Storkey, Wardle and Harrison2010). Association of weed traits with agronomic practices could allow for the identification of plant species with potential capacity for growth in cropping systems and the implementation of proper action to prevent weed development (Légère and Samson Reference Légère and Samson1999).
The ability to understand and predict weed community structure related to production practices could provide us with the opportunity of being proactive in an integrated weed management program (Légère and Samson Reference Légère and Samson1999). Among the factors that can be considered important could be the identification of an appropriate crop for rotation (Froud-Williams Reference Froud-Williams1986). Moreover, the effect of this crop and the other agronomic variables over weed communities could be useful for designing strategies for an integrated approach to crop production, thereby reducing the high input cost for chemical use (Derksen et al. Reference Derksen, Anderson, Blackshaw and Maxwell2002; Jordan and Hutcheon Reference Jordan and Hutcheon1993). Characterizing and comparing the floristic and functional compositions of a weed community related to their agricultural system in an area recently transformed from natural grasslands are a valuable contribution to the study of ecological processes under weed community assembly. Here, our aim was to compare the weed communities of corn and soybean crops grown under the rainfed conditions prevailing in the Espinal region. We first characterized the taxonomic and functional group compositions of weed communities in corn and soybean crops and then analyzed the associations between weed communities and both agronomic management and yields of corn and soybean crops.
Materials and Methods
Study Area
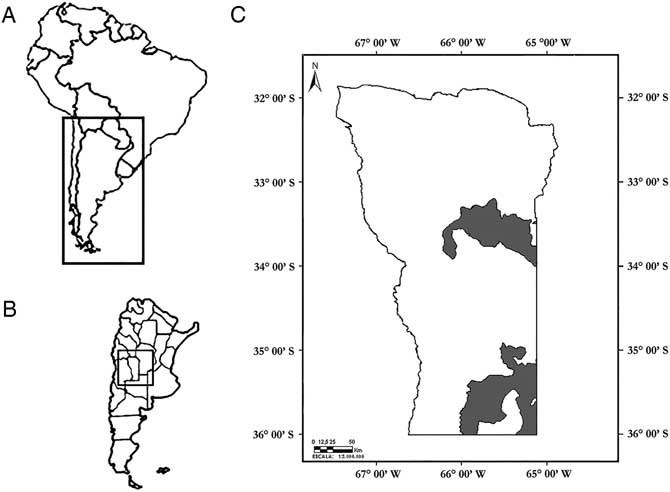
The study was carried out in croplands in the province of San Luis, in central Argentina. The study area is located in the phytogeographic province of Espinal, which extends between −33.3°, −66.06° and −33.7°, −65.63° (Cabrera Reference Cabrera1976; Figure 1). The climate is dry continental with cold winters and hot summers, with an average annual rainfall ranging between 400 and 600 mm from west to east (Appendix B; Anderson et al. Reference Anderson, del Águila and Bernardon1970). Soils are typic Ustortent, characterized by the sandy loam texture and low soil organic carbon (0.94 % SOC; Peña Zubiate and d’Hiriart Reference Peña Zubiate and d’Hiriart2000). These sandy soils have excessive natural drainage and moderate susceptibility to wind erosion (Peña Zubiate and d’Hiriart Reference Peña Zubiate and d’Hiriart2007; Peña Zubiate et al. Reference Peña Zubiate, Anderson, Demmi, Saenz and d’Hiriart1998). Most characteristic landscapes are slightly undulating and flat plains, where the original vegetation was an open forest of xerophytic trees from 8 to 10 m in height, scattered throughout a grassland matrix.
Study area: (A) South America, (B) Argentina, and (C) San Luis province, with the Espinal phytogeographical region shaded gray. (Adapted from soil and vegetation map in Peña Zubiate et al. Reference Peña Zubiate, Anderson, Demmi, Saenz and d’Hiriart1998).

While land use gradually changed from extensive cattle grazing to a mixed production system during the last century, the recent conversion of rangelands to more intensive agriculture occurred in about a decade. Since the 1880s, extensive livestock grazing of natural rangelands, deforestation, and especially, the replacement of the natural vegetation by alfalfa-based pastures were the main transformations in this region. At the end of the 20th century, agriculture rapidly expanded to semiarid regions westward, which importantly promoted the conversion of both natural rangelands and pasturelands into annually cultivated croplands (Viglizzo and Frank Reference Viglizzo and Frank2006; Zak et al. Reference Zak, Cabido, Cáceres and Diaz2008). Currently, the pristine Caldenal forest in San Luis represents the westernmost and driest limit of rainfed agriculture in central Argentina (Santoni et al. Reference Santoni, Jobbágy and Contreras2010).
Weed Surveys
All sample fields fulfilled the following requirements (Mueller-Dumbois and Ellenberg Reference Mueller-Dombois and Ellenberg1974): (1) survey area was large enough to contain all species belonging to the weed community (at least 25 to 100 m2 for agricultural communities), (2) habitat conditions were uniform within the field area, and (3) crop cover was homogeneous. Field margins and low-topographic areas were excluded. Crop fields were randomly chosen by satellite image in an area of approximately 560 km2, corresponding to the area of the same soil type (Peña Zubiate and d’Hiriart Reference Peña Zubiate and d’Hiriart2007; Peña Zubiate et al. Reference Peña Zubiate, Anderson, Demmi, Saenz and d’Hiriart1998). Fifty-three fields were surveyed, determined principally by accessibility and by farmers’ permission (24 soybean fields and 29 cornfields). Weeds in these fields were surveyed during a period of 2 wk in February 2014. This period corresponds to early and post-flowering of soybean and corn crops. In each field, three trained persons recorded weed cover in a zigzag pattern. Each person registered the weed cover in 10 parcels of 100 m2 each, resulting in surveyed areas of approximately 3,000 m2 in each field. Weed cover was estimated for each weed species by the adapted Braun-Blanquet method (Mueller-Dumbois and Ellenberg Reference Mueller-Dombois and Ellenberg1974).
Questionnaires to Farmers
After crop harvest, farmers were presented with a mixed questionnaire to collect information about current crop management and cropping history (i.e., time under continuous cropping, previous crop type, sowing date, farming type, seed type, fertilizations, herbicides, and yield). Not all farmers could be interviewed, because they were very difficult to locate after harvest, resulting in a subset of 38 sites with complete agronomic data (21 cornfields and 17 soybean fields, two or three of the same farmer in some cases).
Functional Classification of Weed Species
Weed species were classified according to their leaf type (monocotyledonous, dicotyledonous), photosynthetic pathway (C3, C4), and life cycle (perennial, annual) as an indicator of resource use; status (native, nonnative) as an indicator of original vegetation legacy; dispersion strategy (anemochory, zoochory, nonspecialized); and height (short, medium, tall). The grouping criteria for classifying plant height was in comparison with crops, taking the tallest crop, corn, as a reference (1.6- to 2.0-m high). The “short” category corresponds to plants shorter than 30 cm, always shaded; “medium” species are between 30 and 150 cm, slightly shaded, and almost at the same height as crops; “tall” species are taller than 160 cm. Finally, Légère and Samson (Reference Légère and Samson1999) determined that the classification scheme in annual/perennial, and monocotyledons/dicotyledons is particularly appropriate for describing herbicide selectivity patterns.
Data Analysis
The floristic structure of weed communities was analyzed through species diversity and composition, whereas functional structure was described by grouping species according to particular traits and common characteristics. Regional species richness (gamma diversity) was calculated for each crop and the entire survey. Gamma diversity is obtained by accumulating the total number of weed species, without repetition, that were registered in all surveyed fields. Mean species richness (field, local, or alpha diversity) was obtained by averaging the number of species found in each field of a given crop type. The frequency of species occurrence at a regional level (also denominated “constancy”) and mean cover at field level were calculated for each species.
Floristic composition was compared within and between corn and soybean crops by calculating the additive partition of the abundance-based Bray-Curtis dissimilarity (Baselga Reference Baselga2013). Bray-Curtis dissimilarity ranges between 0 and 1, where 0 means that two fields have the same floristic composition (i.e., they share all weed species), whereas 1 means that two fields have totally different floristic compositions (i.e., they do not share any weed species). The abundance-based Bray-Curtis dissimilarity (d BC) was separated into two components (Baselga Reference Baselga2013). One of them, the balanced variation component of the Bray-Curtis dissimilarity (d BC-bal), represents the changes in species abundance between fields (i.e., the abundance of some species declines between two given fields in the same magnitude as the abundance of the other species increases between the same fields). The other one, the abundance gradient component of the Bray-Curtis dissimilarity (d BC-grad), represents the decrease of weed abundance from one field to another. Values of both d BC-bal and d BC-grad were calculated with the function bray.part to compute the dissimilarities using the ‘betpart’ package (Baselga and Orme Reference Baselga and Orme2012). Abundance-based Bray-Curtis dissimilarity was then obtained by summing up both components (d BC=d BC-bal + d BC-grad). Calculations were performed in R v. 3.3.3 (R Development Core Team 2014).
To analyze functional groups of weeds with good performance in semiarid agricultural systems, we compared the frequency and mean cover among functional groups between crops and for the whole data set. For analyzing the frequency of occurrence of weed species, we carried out a binomial generalized linear model, using the logit link function and compared by chi-square test. For mean cover analyses, we carried out a generalized linear mixed model, using Poisson distribution and log link function and compared by Fisher’s LSD. The analysis was performed with R v. 3.0.3 (R Development Core Team 2014).
Canonical correspondence analysis (CCA) was carried out to analyze the associations between floristic composition and agronomic variables (‘vegan’ package in R; Oksanen et al. Reference Oksanen, Blanchet, Kindt, Legendre, Minchin, O’Hara, Simpson, Solymos, Stevens and Wagner2015). The analysis was performed considering species present in more than 10% of the surveyed fields. Species present in less than 10% of fields were considered of rare occurrence (Perelman et al. Reference Perelman, León and Oesterheld2001). Agronomic variables used were time of continuous cropping (years), sowing date (Julian days), previous crop type, fertilization (nutrient and dose in kg ha−1), herbicide use, and grain yield expressed as energetic units (Penning de Vries et al. Reference Penning de Vries, Van Laar and Chardon1983). Due to the different energetic content in seeds of corn and soybean, grain yield was standardized by dividing each data by the mean yield of each crop of the data set.
Results and Discussion
Floristic Comparison
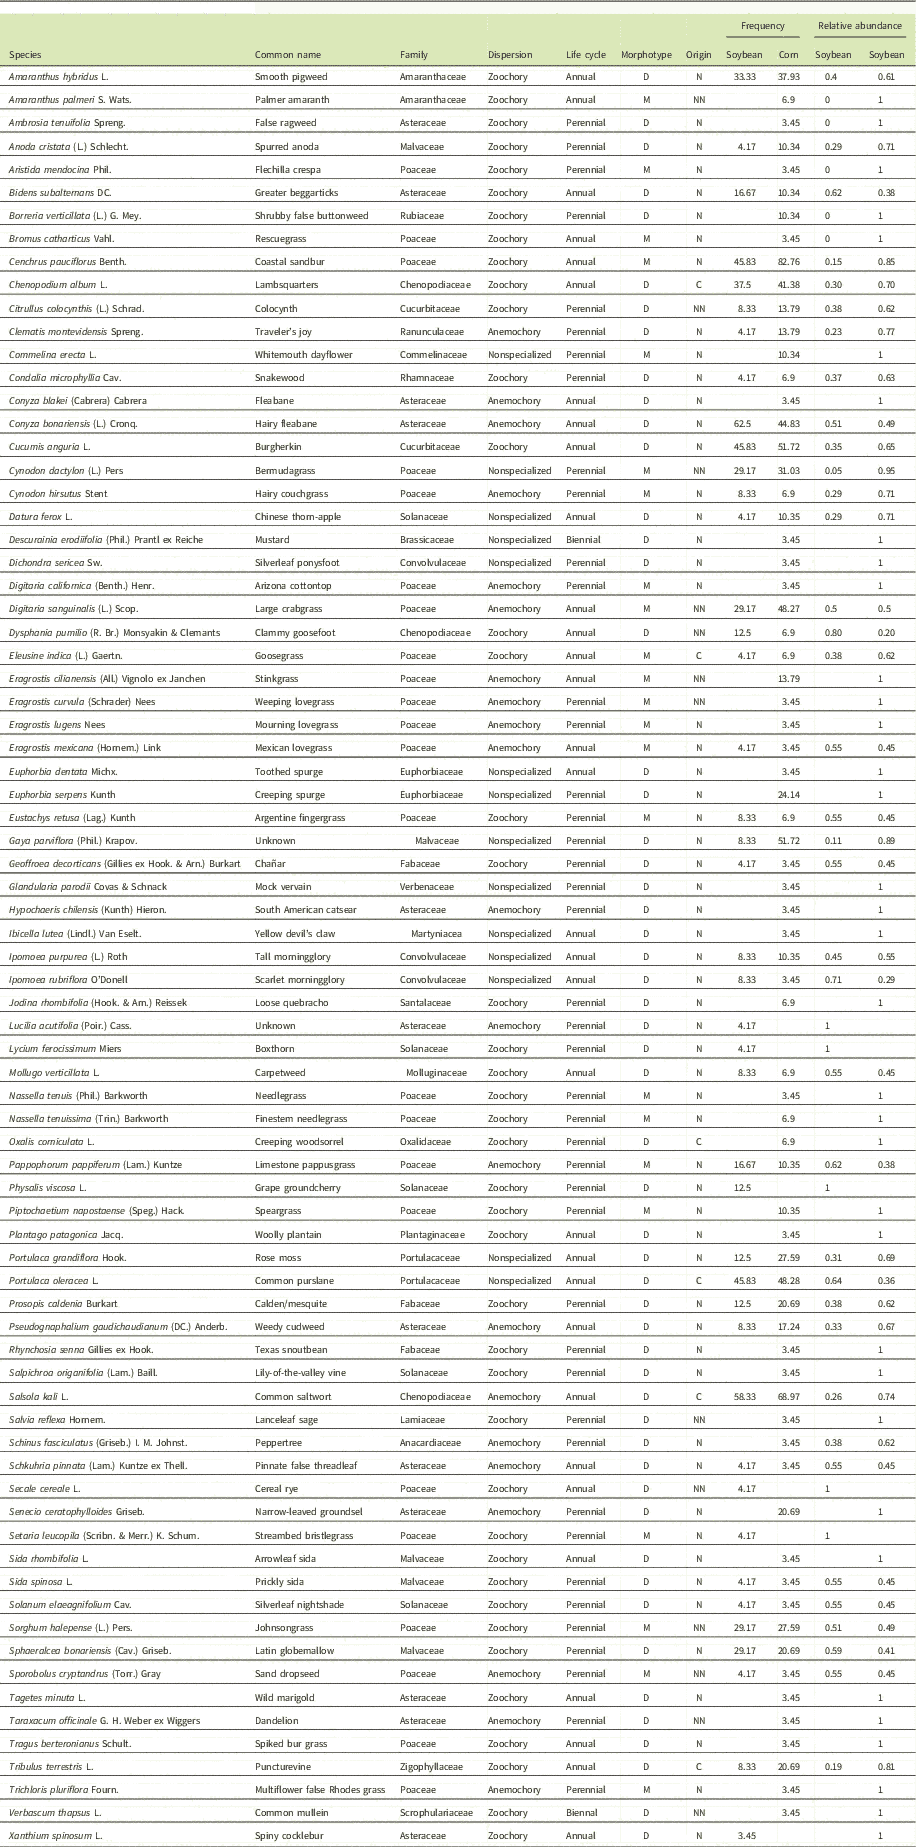
Eighty-six weed species were recorded in the fields grown with corn and soybean crops surveyed in the Espinal region. Sixty species had frequencies lower than 10%, which included 32 species that were found only at a single site. This high proportion of rare species, mostly native annuals, suggests a strong presence of the original vegetation in these recently cultivated systems (Table 1). Twenty-six botanical families were represented in the 77 species that were taxonomically determined (7 rare species remained unidentified due to their nonreproductive phenological stage, while 2 were volunteer crops). Poaceae (24 species) and Asteraceae (13 species) families comprised the largest numbers of species of monocotyledons and dicotyledons, respectively (Table 1).
Binomial and common names, family, dispersion strategy, life cycle, morphotype, origin, frequency, and mean cover for weeds species recorded in field surveys.Footnote a

a Abbreviations: D, dicotyledons; M, monocotyledons; N, native; NN, nonnative (exotics and cosmopolitans).
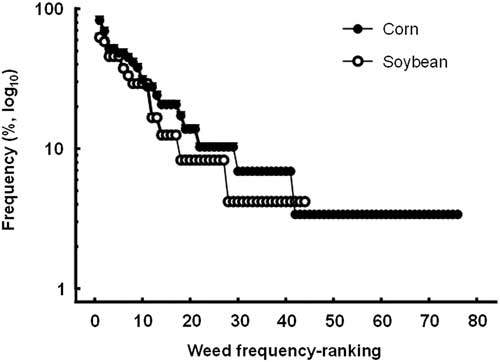
The weed community in cornfields was more species rich than that of soybean at both local (field) and regional scales. Mean alpha diversity at field scale (species richness) was greater in corn (10.0 species) than in soybean (7.6 species; Kruskal-Wallis, P=0.023). Total number of species surveyed in the study region (gamma diversity) was also greater in corn (80 species) than in soybean (46 species). Greater diversity in corn was due to the presence of more rare species, which were mostly native (Tables 1 and 2). Moreover, most species listed in cornfields had a greater frequency of occurrence at the regional level than in soybean fields (Figure 2). Our findings concur with previous observations at both field and regional scales in the Rolling Pampa of Argentina, where weed communities were more species rich in cornfields than in soybean fields (Poggio et al. Reference Poggio, Chaneton and Ghersa2013). In the same region, weed communities harbor more species in field pea (Pisum sativum L.) crops than in wheat (Triticum aestivum L.) crops (Poggio et al. Reference Poggio, Satorre and de la Fuente2004).
Percent frequency of weed species (log 10) as a function of the frequency ranking in the communities of corn and soybean crops.

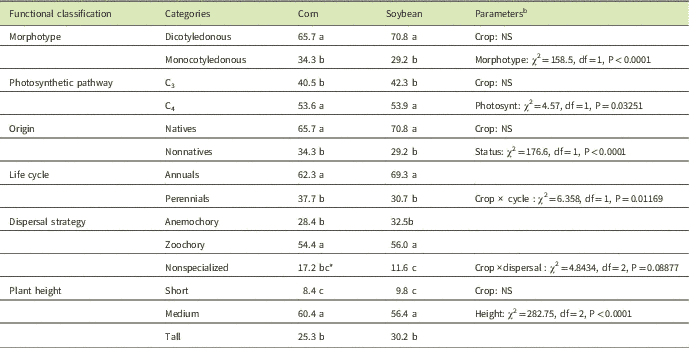
Binomial generalized linear model to compare the frequency of functional groups in corn and soybean crops.Footnote a

a Different lowercase letters indicate significant differences within each functional classification group, according to chi-square test.
b Abbreviation: NS, not significant; photosynt, photosynthetic pathway.
*P<0.1.
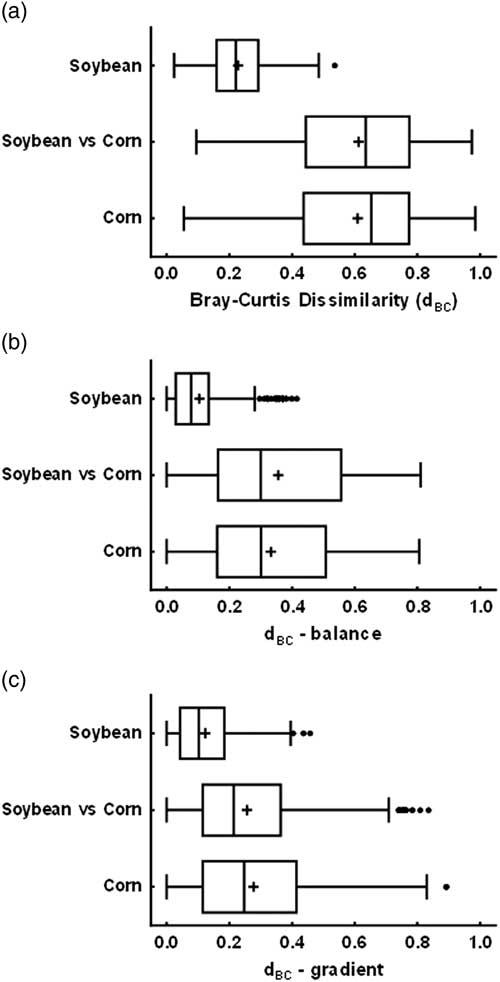
Species composition of weed communities was also more variable in corn than soybean. Similarity between soybean fields was higher (low d BC) than between either cornfields or fields of both crops (Figure 3), whereas species abundance was almost equal between fields (d BC-grad). In addition, distributions of dissimilarity measures for cornfields or between fields of both crops were highly similar in terms of median, quantiles, and range values (Figure 3). In the cropping environments prevailing in the semiarid Espinal, our findings indicate that weed communities are less variable among soybean crops (i.e., low beta diversity) than among corn crops (i.e., high beta diversity).
Box plots of the abundance-based Bray-Curtis dissimilarity (d BC) and its additive partition into the balance (d BC-bal) and gradient (d BC-grad) components. The three dissimilarity measures were calculated to compare the species composition within corn and soybean and between both crops. Crosses within boxes are mean values.

Our results provide further indication that contrasting crop types, such as cereals and legumes, can impose different filtering effects on companion weed communities, which will consequently result in the occurrence of a different number of species. An experiment carried out in Oklahoma, USA, evaluated the species diversity of weed communities occurring in contrasting crop species and showed that corn monocultures had the highest weed richness, while soybean monocultures presented the most weed species–poor communities (Palmer and Maurer Reference Palmer and Maurer1997).
Differences in crop identity that differ starkly in their canopy and rhizosphere structures may create different microenvironmental heterogeneity above- and belowground (Gao et al. Reference Gao, Duan, Qiu, Liu, Sun, Zhang and Wang2010; Gitelson et al. Reference Gitelson, Peng and Huemmrich2014), which potentially allows for the occurrence of some weed species adapted to the specific crop environment, while other species are filtered out (Booth and Swanton Reference Booth and Swanton2002; Swanton et al. Reference Swanton, Clements and Derksen1993). Corn canopies rarely reach complete ground cover, so radiation interception is rarely maximum in productive conditions (Maddonni et al. Reference Maddonni, Otegui and Cirilo2001). Conversely, soybean canopies often eventually reach full ground cover, which consequently restricts the proportion of sunlight reaching the ground, reducing available light for weed development (Pengelly et al. Reference Pengelly, Blamey and Muchow1999). In addition, corn crops are usually sown with lower seeding rates and wider row spacing than soybean crops (3 and 18 plants m−2, respectively, in the Espinal region [JA Garay, personal communication]). This difference in density and spatial arrangement of crop plants may also result in more open canopies in corn than soybean crops. Contrasting crop species may differentially modulate the species diversity of weed communities by restricting the sunlight and modifying the light quality and thermal environments of the canopy understory (Poggio and Ghersa Reference Poggio and Ghersa2011). However, canopy structure effects may have greater impact on weed richness in small areas (e.g., 1 to 100 m2), where competition is important, while other factors, such as spatial heterogeneity in soil and climate, would have greater influence on weed richness at landscape and regional scales (100 ha to 1,000 km2) Thus, contrasting crop types may also have different effects on the variation in weed species composition between fields in a region.
Our observations in the Espinal are in agreement with previous research in the more humid conditions prevailing in the Rolling Pampa, where weed species composition was less variable between soybean fields than between cornfields (Poggio et al. Reference Poggio, Chaneton and Ghersa2013). Most of the variation in weed species composition at farmland scale was related to the interactions between crop types and management differences among neighboring farmers in the landscape (Hyvönen et al. Reference Hyvönen, Holopainen and Tiainen2005). In an extensive cross-regional weed survey carried out in France, crop type also had a significant influence on species composition, particularly between crops sown in different seasons; thus, winter cereals had greater beta diversity (low similarity) compared with spring cereals or sugar beet (Beta vulgaris L.) (Fried et al. Reference Fried, Norton and Reboud2008). Although different weed communities were also identified in cereals and oilseed crops in Sweden, crop type was less influential than other environmental variables with greater impact on weeds, such as crop sowing season, geographical region, and soil type (Hallgren et al. Reference Hallgren, Palmer and Milberg1999). In the present study, differences in species composition between corn and soybean crops would have become evident because weed surveys were carried out in a relatively homogeneous region in terms of soil types, climate, and land use. Our findings thus provide evidence supporting the concept that factors explaining the variation in species composition of weed communities are scale dependent (Hyvönen et al. Reference Hyvönen, Holopainen and Tiainen2005). Hence, weed communities can be mostly modulated by factors defining landscape complexity at the regional level, while structure of local communities in small patches is mainly determined by interactions and habitat heterogeneity, which may result from soil fertility and microdisturbances (Poggio Reference Poggio2012).
Functional Composition Was Similar between Corn and Soybean
The frequency of functional groups was quite similar between both crops (Table 2), except for a higher frequency of species with nonspecialized dispersion strategies, but with marginal significance. The absence of differences in frequency of functional groups between crops indicates that the functional composition of the weed community may be principally determined by macroclimatic conditions rather than local biotic mechanisms (Poggio Reference Poggio2012). The higher frequency of annual, dicotyledonous, and native species (Table 2) likely resulted from the relatively recent inception of row-crop agriculture in the semiarid Espinal (Froud-Williams Reference Froud-Williams1986). Evidence indicates that annuals and dicotyledons decrease as time of continuous no-tillage management increases (de la Fuente et al. Reference de la Fuente, Suárez, Ghersa and León1999, Reference de la Fuente, Suárez and Ghersa2006; Mas et al. Reference Mas, Verdu, Kruk, De Abelleyra, Guglielmini and Satorre2010). In addition, medium-height species could have been favored by intermediate light interception conditions in comparison with the more shaded, short species and the rarer, shorter native species (Anderson et al. Reference Anderson, del Águila and Bernardon1970). Some native perennial woody species were also present, and the higher cover of tall species reflects their presence. Croplands in central Argentina come from the conversion of forest (González-Roglich et al. Reference González-Roglich, Swenson, Villarreal, Jobbágy and Jackson2015), where no-tillage technologies were adopted immediately. These conditions favor woody species expansion, and the system will probably result in an increase in their abundance through time (Ghersa et al. Reference Ghersa, de la Fuente, Suarez and León2002).
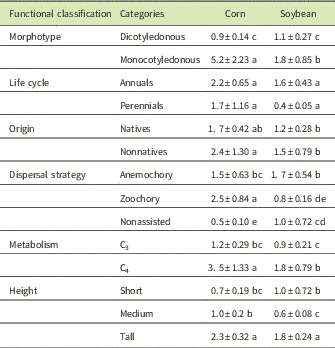
There are differences in the cover of species among functional groups of weed communities in the Espinal region, where weed communities differed between corn and soybean (Table 3). There is evidence that crops limit weed abundance through competition, principally for light (Mhlanga et al. Reference Mhlanga, Chauhan and Thierfelder2016), and although we have not demonstrated this, our results agree with this idea. Many of the rare species present, principally in corn, are perennial (probably due to the early successional stage of these agricultural soils) and are associated with no-tillage practices (de la Fuente et al. Reference de la Fuente, Suárez, Ghersa and León1999). Differential crop competitive effects of corn and soybean on the accompanying weeds may be the main driver of the different weed community structures observed between these crops, which concurs with previous research (Poggio et al. Reference Poggio, Satorre and de la Fuente2004).
Generalized linear mixed model for cover data, with Poisson distribution and log link function.Footnote a

a Comparisons were made within each functional classification. Lowercase letters indicate differences at P<0.05 by Fisher’s LSD test.
Weed Community Structure Was Related to Crop Management
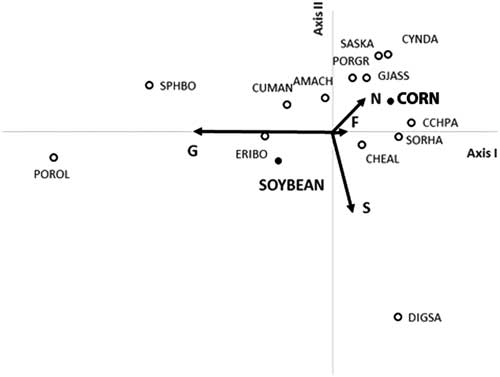
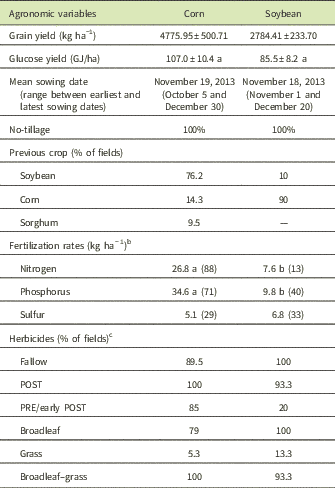
Floristic and functional composition was also affected by the different agronomic management in corn and soybean crops (Table 4; Figures 2 and 3). Our results are also in agreement with previous research (Pyšek and Leps Reference Pyšek and Lepš1991), in which fertilizers were found to have a significant effect on the species composition of weed communities. While mean sowing dates were similar between crops, corn was sown during a more extended range of dates (i.e., from early to late dates). This longer period provides more opportunities for the establishment of species, especially those with several cohorts per season, like coastal sandbur (Cenchrus pauciflorus Benth.) (Lemes et al. Reference Lemes, Quiroga and Ventura1993), which was the most frequent species in corn (Table 1). There was high variability in amounts of fertilizer added among fields (coefficient of variation varied between 37% and 88%, evaluated by nutrient and crop). No differences were seen in sulfur use between crops, whereas corn received higher doses of nitrogen and phosphorous than soybean crops. Sulfur and nitrogen were important factors in determining floristic composition (Figure 4). In almost all soybean fields, fallow was followed by application of broadleaf and broadleaf–grass herbicides, whereas PRE herbicides were more frequent in corn. Grass herbicides were applied in fewer fields. There is a strong association between grass herbicide application and axis 1 of the CCA ordination, with most monocotyledonous species located on the opposite side of the axis (Figure 4). Finally, yields were similar between crops when they were expressed in energetic units, and no-tillage was the common practice in all fields.
Ordination diagram from canonical correspondence analysis. Abbreviations: AMACH, Amaranthus hybridus; CCHPA, Cenchrus pauciflorus; CHEAL, Chenopodium album; CORN, corn crop; CUMAN, Cucumis anguria; CYNDA, Cynodon dactylon; DIGSA, Digitaria sanguinalis; ERIBO, Conyza bonariensis; F, fertilization; G, grass herbicide; GJASS, Gaya parviflora; N, nitrogen fertilization; PORGR, Portulaca grandiflora; POROL, Portulaca oleracea; S, sulfur fertilization; SASKA, Salsola kali; SORHA, Sorghum halepense; SOYBEAN, soybean crop; SPHBO, Sphaeralcea bonariensis. Eigenvalues: axis 1: 0.397; axis 2: 0.312. Proportion explained by axes: axis 1: 0.2335; axis 2: 0.1833.

Agronomic variables of corn and soybean crops in 38 sampling sites.Footnote a

a Lowercase letters indicate differences among crops.
b Kruskal-Wallis test, P<0.05. Numbers in parentheses for fertilization rates indicate the percentage of fields treated.
c Herbicides: glyphosate (mean dose: 1.68 L ha−1); dicamba (mean dose: 0.1 L ha−1); atrazine (mean dose: 1.37 kg ha−1); 2,4-D (mean dose: 0.6 L ha−1); haloxyfop (0.11 L ha−1); chlorimuron (0.04 kg ha−1). Applied herbicides with no dosage data: diclosulam; imazethapyr; clethodim; imazapic+imazapyr; sulfentrazone.
Our results suggest that in the semiarid Espinal, the floristic and functional composition of weed communities could be modulated by a combination of several strategies—crop rotation, competitive crop varieties, fertilization, and herbicide application—leading to a synergistic improvement in weed control (Derksen et al. Reference Derksen, Anderson, Blackshaw and Maxwell2002). Planned sequences of crop rotation, combined with selective fertilization and herbicide use, could be an important tool in the management of weed communities (Liebman and Dyck Reference Liebman and Dyck1993). However, as crop cover was not a manipulated variable in this study, the effect of crop competition over weed community should be considered as correlation only (Pyšek and Leps Reference Pyšek and Lepš1991).
Our evaluation suggests that the original vegetation of the semiarid Espinal had a high representation in the floristic composition in weed communities, due to the high proportion of annual, dicotyledonous, and native species, which reflected the recent transformation of these croplands (de la Fuente et al. Reference de la Fuente, Suárez, Ghersa and León1999, Reference de la Fuente, Suárez and Ghersa2006; Froud-Williams Reference Froud-Williams1986; Mas et al. Reference Mas, Verdu, Kruk, De Abelleyra, Guglielmini and Satorre2010). Overall weed cover was very low in this dry region, which is marginal for agriculture, indicating that the high herbicide doses associated with no-tillage technologies were effective, possibly due to local relative absence of resistant biotypes in the original vegetation. Therefore, this system represents an opportunity for the design of integrated management strategies that could help reduce the use of chemicals and, consequently, the appearance of resistant variants.
Acknowledgments
We thank the farmers for giving their consent to survey the fields and providing information about crop management. We also want to thank the two anonymous reviewers, who undoubtedly helped to improve the article. The studies reported in this article comply with the ethics guidelines and current laws of the Republic of Argentina. This work was supported by a grant from the Instituto Nacional de Tecnología Agropecuaria (INTA, PAMSL-1282206). No conflicts of interest have been declared.
Supplementary material
To view supplementary material for this article, please visit http://dx.doi.org/10.1017/wsc.2017.76