


Introduction
The Resplendent Quetzal Pharomachrus mocinno de la Llave, famed for brilliant and extravagant plumage, as well as its iconic role in the history of Aztec and Mayan cultures (Schulz and Thiemer-Sachse Reference Schulz and Thiemer-Sachse2021), remains one of the quintessential cloud forest birds of Mesoamerica (Poole Reference Poole2023). Two subspecies occur in high elevation tropical moist forests (cloud forests) in Mesoamerica: Pharomachrus mocinno mocinno in southern Mexico, Guatemala, Honduras, El Salvador, and western Nicaragua; and P. m. costaricensis in Costa Rica and western Panama (Collar Reference Collar, del Hoyo and Sargatal2001; Solórzano et.al. Reference Solórzano, Baker and Oyama2004; Schulz and Eisermann Reference Schulz and Eisermann2017). Solórzano and Oyama (Reference Solórzano and Oyama2010) suggested the elevation of both subspecies to species status, supported by the additional morphological data presented by Schulz and Eisermann (Reference Schulz and Eisermann2017). The species is recognised as an altitudinal migrant thus its annual reproductive cycle is divided into breeding and migration seasons. The breeding season occurs in highland wet-cool (cloud) forests. At the end of reproduction most quetzals move to surrounding lower-elevation areas (Powell and Bjork Reference Powell and Bjork1994; Solórzano Reference Solórzano1995; Paiz Reference Paiz1997; Bustamante et al. Reference Bustamante, Bosarreyes and Barrios-Izas2024).
While not strictly an obligate resident of cloud forests, the Resplendent Quetzal generally breeds in this habitat, often utilising available food sources in adjacent disturbed or degraded forest and agricultural or pastoral lands (Skutch Reference Skutch1944; LaBastille Bowes and Allen Reference LaBastille Bowes and Allen1969).
The conservation status of Resplendent Quetzal was last assessed in 2023. The species is currently listed as Near Threatened in the IUCN Red List (BirdLife International 2023; International Union for Conservation of Nature (IUCN) 2025) due to habitat loss (primarily deforestation by logging and expansion of agriculture) in many parts of its range, particularly in Mexico (Chiapas), Guatemala, Honduras, Nicaragua and El Salvador. Climate change is driving a suite of threats including elevational range shifts and contractions, drought and loss of cloud formation, forest fires, increased storm intensity, disruption of floristic food production, and other ecological effects (Foster Reference Foster2001; Gasner et al. Reference Gasner, Jankowski, Ciecka, Kyle and Rabenold2010; Ponce-Reyes et al. Reference Ponce-Reyes, Reynoso-Rosales, Watson, VanDerWal, Fuller and Pressey2012; Helmer et al. Reference Helmer, Gerson, Baggett, Bird, Ruzycki and Voggesser2019). Owing to large expanses of protected areas, Costa Rica and Panama have the largest contiguous areas of intact cloud forest habitat in Mesoamerica. Quetzal bird watching and photography are now important ecotourism contributions to the economies of the region, particularly in Costa Rica, Panama, and Guatemala.
Knowledge of their life history and ecology is based on few studies (Skutch Reference Skutch1944; LaBastille Bowes and Allen Reference LaBastille Bowes and Allen1969; LaBastille et al. Reference LaBastille, Allen and Durrell1972; Wheelwright Reference Wheelwright1986; Unger Reference Unger1988; Powell and Bjork Reference Powell and Bjork1994; Paiz 1996; Eisermann Reference Eisermann2013) and much remains to be learned. Despite periodic, isolated census and monitoring efforts since the 1970s (Mühlenberg et al. Reference Mühlenberg, Hovestadt and Unger1989; Eisermann Reference Eisermann1999, Reference Eisermann2005, Reference Eisermann2012; Haupt Reference Haupt2003; Solórzano et al. Reference Solórzano, Castillo-Santiago, Navarrete-Gutierrez and Oyama2003; Eisermann and Schulz Reference Eisermann and Schulz2005; Renner Reference Renner2005; Eisermann and Avendaño Reference Eisermann and Avendaño2007; Eisermann et al. Reference Eisermann2013; Pineda Matías Reference Pineda Matías2013; Yurrita Obiols Reference Yurrita Obiols2013; García Reynaud et al. Reference García Reynaud, Sorto Sabillón and Padilla Barahona2022), the overall knowledge of Resplendent Quetzal populations remains poor and patchy with no reliable estimates of either the remaining habitat or the total number of individuals.
Based on very general estimates of remaining forest habitat and presumed densities of breeding pairs for each country in Mesoamerica, Poole (Reference Poole2023) estimated 385,000 breeding pairs or 770,000 individuals. Poole (Reference Poole2023) provided population estimates for each country in Mesoamerica based on assessments of remaining forest habitat in protected areas within the general elevation range known to support breeding quetzals (1,500–3,000 m) and suggested that using satellite imagery to improve determinations of remaining tropical moist forests would be the next step in refining overall population estimates. Following this suggestion, this study uses satellite imagery data as the basis for refining the estimates of remaining breeding habitat for the Resplendent Quetzal in each country of Mesoamerica, how breeding habitat has been reduced over time, and how much of the remaining habitat is protected for the populations of both subspecies.
Methods
Study area
We modeled the distribution of potential breeding habitat for the entire range of Resplendent Quetzal, which includes southern Mexico (Chiapas), Guatemala, El Salvador, Honduras, Nicaragua, Costa Rica, and Panama (Poole Reference Poole2023).
Habitat distribution 1990–2021
To assess the distribution of potential habitat of Resplendent Quetzal since 1990, we used a publicly available tropical moist forest data set (hereafter TMF) with 30 m resolution prepared by the European Commission Joint Research Centre (European Commission 2024) using Landsat data from 1990 to 2021. We combined the 2021 TMF data with a 30 m resolution digital elevation model (DEM) from the ASTER satellite system (United States Geological Survey (USGS) 2025) to delimit the variable elevation range of TMF habitat used by breeding Resplendent Quetzals. ArcGIS Pro 3.5.2 software (Environmental Systems Research Institute, Inc. (ESRI) 2025) was used for processing satellite-based data sets, creation of the biophysical model, calculations and visual output maps.
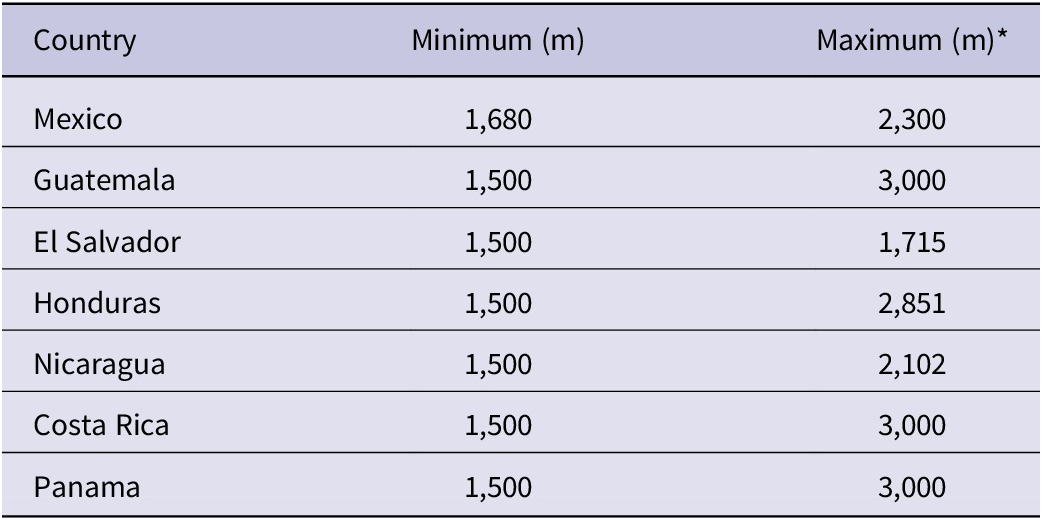
Based on the life history literature (Skutch Reference Skutch1944; LaBastille Bowes and Allen Reference LaBastille Bowes and Allen1969; Wheelwright Reference Wheelwright1986; Powell and Bjork Reference Powell and Bjork1994, Reference Powell and Bjork1995; Paiz Reference Paiz1997; Solórzano et al. Reference Solórzano, Castillo-Santiago, Navarrete-Gutierrez and Oyama2003; Eisermann Reference Eisermann2013) and information from field experts (I. Santamaría, pers. comm. 2025), our model uses the 1,500–3,000 m elevation range with some modifications (e.g. in Chiapas nesting occurs above 1,680 m - Solórzano unpublished.data). In four of the countries, the natural limits of montane topography trim the maximum elevation for Resplendent Quetzal breeding habitat (Table 1).
Altitudinal range of Resplendent Quetzal habitat by country. *Maximum values <3,000 m are based on the maximum topographic elevation

Table 1. Long description
The table consists of three columns: Country, Minimum (m), and Maximum (m). The data rows are as follows:
* Mexico: 1,680 minimum to 2,300 maximum.
* Guatemala: 1,500 minimum to 3,000 maximum.
* El Salvador: 1,500 minimum to 1,715 maximum.
* Honduras: 1,500 minimum to 2,851 maximum.
* Nicaragua: 1,500 minimum to 2,102 maximum.
* Costa Rica: 1,500 minimum to 3,000 maximum.
* Panama: 1,500 minimum to 3,000 maximum.
A footnote indicates that maximum values less than 3,000 m are based on the maximum topographic elevation of the area.
The margin of error for the biophysical model (30 m DEM and TMF coverage) was derived by creating a second partial version of the model, utilising a 15 m resolution digital elevation model (INEGI 2025) available for Chiapas (Mexico), and comparing the results of both models for the same region.
The output from the model is a series of habitat patches of various sizes. We classified patches with a minimum size of 560 hectares (ha) as core habitat for Resplendent Quetzals according to Solórzano et al. (Reference Solórzano, Castillo-Santiago, Navarrete-Gutierrez and Oyama2003) and Arslan and Martin (Reference Arslan and Martin2024). We also identified smaller patches (<560 ha) of peripheral habitat within a 500 m distance of the core habitat areas. This follows the field observations by SS, AFP, KE, and H. Barrantes (pers. comm. 2024) who have observed breeding Resplendent Quetzals using disturbed habitats such as degraded forest or food trees in adjacent pastures within 500 m of primary cloud forest.
To assess trends in habitat loss for the Resplendent Quetzal, the biophysical model was rerun using the TMF cover data for years 1990 and 2011, providing data that can be compared with the 2021 model output.
Locally, Resplendent Quetzals range below 1,500 m elevation (Eisermann Reference Eisermann2005, Dayer Reference Dayer and Schulenberg2020). Therefore, we modeled the loss of potential Resplendent Quetzal breeding habitat between 1,200 and 1,500 m from deforestation between 1990 and 2021.
Model corroboration
To lower the risk of overestimation, we eliminated areas from the model output where Resplendent Quetzal is known not to occur or in extremely low numbers that do not constitute a viable population (Solórzano et al. Reference Solórzano, Castillo-Santiago, Navarrete-Gutierrez and Oyama2003), or confirmed by field observations (KE, pers. obs.; I. Santamaría, pers. comm. 2025). Some discrepancies are caused by errors of satellite image interpretation (e.g. forest areas dominated by pines in Chiapas and Guatemala or cloud forest with an extensive dry season and lack of nesting sites). Other forest areas identified by the TMF satellite imagery database are isolated regions with higher temperatures, often adjacent to drier regions (NW Costa Rica), and likely do not support the quetzal’s main food source (mainly trees of the family Lauraceae). In Chiapas we confirmed with field expertise (SS, pers. obs.) that remnant forests in the northern and eastern mountain regions of the state have been deforested or highly fragmented since the last Resplendent Quetzal surveys there (Solórzano et al. Reference Solórzano, Castillo-Santiago, Navarrete-Gutierrez and Oyama2003, Cayuela et al. Reference Cayuela, Rey Benayasa and Echeverría2006) and do not support quetzal populations. In Guatemala we used expert field knowledge (KE, pers. obs.) combined with temperature and precipitation data sets (Fick and Hijmans Reference Fick and Hijmans2017, WorldClim 2025) to validate and eliminate areas that are not inhabited by the quetzal. A total of 32,162 (± 975) ha for the entire study area were eliminated from the model to lower the risk of overestimation.
As a broad check on our biophysical model, we mapped 20,269 unique Resplendent Quetzal eBird records during the breeding season (January–June) for the years 1977–2023 (eBird 2023). These data are included as a visual comparison with the distribution of the habitat patch data derived from our biophysical model. The use of eBird data with its various biases does not independently validate the results of the model but does show a strong spatial overlap with the model output.
Population estimates
Our calculation of the area of habitat is the basis for generating a range of population estimates for the two subspecies of the Resplendent Quetzal in Mesoamerica. For estimates of population density, we reviewed the literature and consulted with field experts in Costa Rica and Panama. Resplendent Quetzals are not homogeneously distributed throughout cloud forest area (Solórzano et al. Reference Solórzano, Castillo-Santiago, Navarrete-Gutierrez and Oyama2003; KE, AP, pers. obs.). Given the paucity of data on density, the wide range of estimates, disparate census methods, and long periods (years) between studies, we use conservative abundance classes, reducing the upper estimates for Costa Rica and Mexico by 50% so as not to overestimate populations. Although most published local census efforts cannot be extrapolated, we used these data as orientation to apply one of the following abundance classes to each habitat patch: 5, 10, 20, 30, and 50 individuals per 100 ha. Abundance was calculated by multiplying the number of 100 ha units of potential breeding habitat by the population density (individuals per 100 ha).
Conservation status and IUCN Red List status assessment
To assess the conservation status of Resplendent Quetzal, we compared the area of potential habitat in 1990, 2000, 2011, and 2021. To evaluate the IUCN Red List status for the species and for both subspecies of Resplendent Quetzal, we applied criteria and guidelines by IUCN (2012, 2022a). The Extent of Habitat (EOH) and the Area of Habitat (AOH) in the different years and for the species as well as both subspecies, was calculated based on the modeled extent of potential habitat (Area of Habitat, AOH, following Brooks et al. Reference Brooks, Pimm, Akçakaya, Buchanan, Butchart and Foden2019; Dahal et al. Reference Dahal, Lumbierres, Butchart, Donald and Rondinini2022; Lumbierres et al. Reference Lumbierres, Dahal, Soria, Di Marco, Butchart and Donald2022; Carrillo-Restrepo et al. Reference Carrillo-Restrepo, Linero-Triana, Herzog and Velásquez-Tibatá2025). The AOH approach is similar to the Extent of Occurrence (EOO) and Area of Occupancy (AOO) protocols currently used by the IUCN, using habitat data versus species distribution records. The EOH is the size of a convex polygon enclosing all habitat patches. For calculating the AOH, we overlaid a 2×2 km grid on the habitat map. The AOH is the area sum of all grid cells at least partially covered by suitable habitat hence the EOH is larger than the AOH. To assess the generation length (a value required for assessing population changes over time; IUCN 2012, 2022a), we used the generation length calculator provided by IUCN (2022b). The additional decadal assessment of forest cover for the period 1990–2000 was needed to assess the effect of generation time. In addition, we overlaid the boundaries of protected areas, as identified in the global World Database on Protected Areas (UNEP-WCMC and IUCN 2020) to calculate an estimate of the Resplendent Quetzal habitat area under protection in each year analysed (1990, 2011, 2021), and illustrate trends in habitat protection over a 30+ year period.
Results
Habitat distribution 1990–2021
The model of the distribution of potential habitat in this study provides a current map of the distribution of the Resplendent Quetzal for the entire Mesoamerican region (see Figures 1A and B, and a higher resolution map in Supplementary material Figure S1). The map shows habitat patches ranked by size and the overlap with protected areas will be useful in identifying future opportunities to conserve more nesting habitat for Resplendent Quetzal.
Distribution of modeled habitat in 2021 for A) P. m. mocinno and B) P.m. costaricensis.

Figure 1. Long description
Panel A shows the distribution for P. m. mocinno across Southern Mexico and Northern Central America. Habitat patches are scattered in the Northwest within Chiapas, Mexico, and Guatemala. A denser concentration of patches extends Southeast through Southern Guatemala and into Western Honduras. Sparse patches are also visible in El Salvador and Northern Nicaragua.
Panel B shows the distribution for P. m. costaricensis in Southern Central America. The habitat is primarily concentrated in a continuous, elongated band running Northwest to Southeast along the central mountain ranges of Costa Rica and extending into Western Panama.
Both panels include a North-South-East-West compass rose and a scale bar from 0 to 400 km. The maps use black outlines for national borders and grey shading to indicate modeled habitat areas.
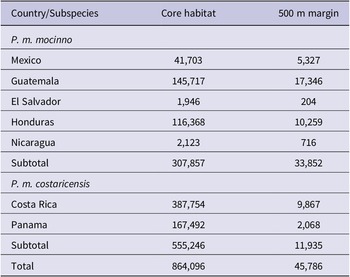
Approximately 864,000 ha (124 patches with a size >560 ha) of suitable breeding habitat existed in Mesoamerica in 2021 (Table 2). Marginal habitats (patches <560 ha in size and within 500 m of core habitat) add approximately 5% to the total. Considering ±3% error associated with the elevation data used in the model, the amount of habitat ranges from 794,294 to 935,706 ha. The largest single habitat patch (442,000 ha) is located in the Cordillera de Talamanca ranging from eastern Costa Rica to western Panama. This is the principal area for the subspecies P. m. costaricensis (19 patches total, Figure 2 and Table 2). In contrast, the habitat areas of P. m. mocinno are much more fragmented (105 patches) and extend across four countries, with the largest patch of 50,700 ha (2nd largest of the core areas) in the Sierra de las Minas in Guatemala (Figure 3 and Table 2).
Area (ha) of modeled Resplendent Quetzal habitat above 1,500 m by country in 2021
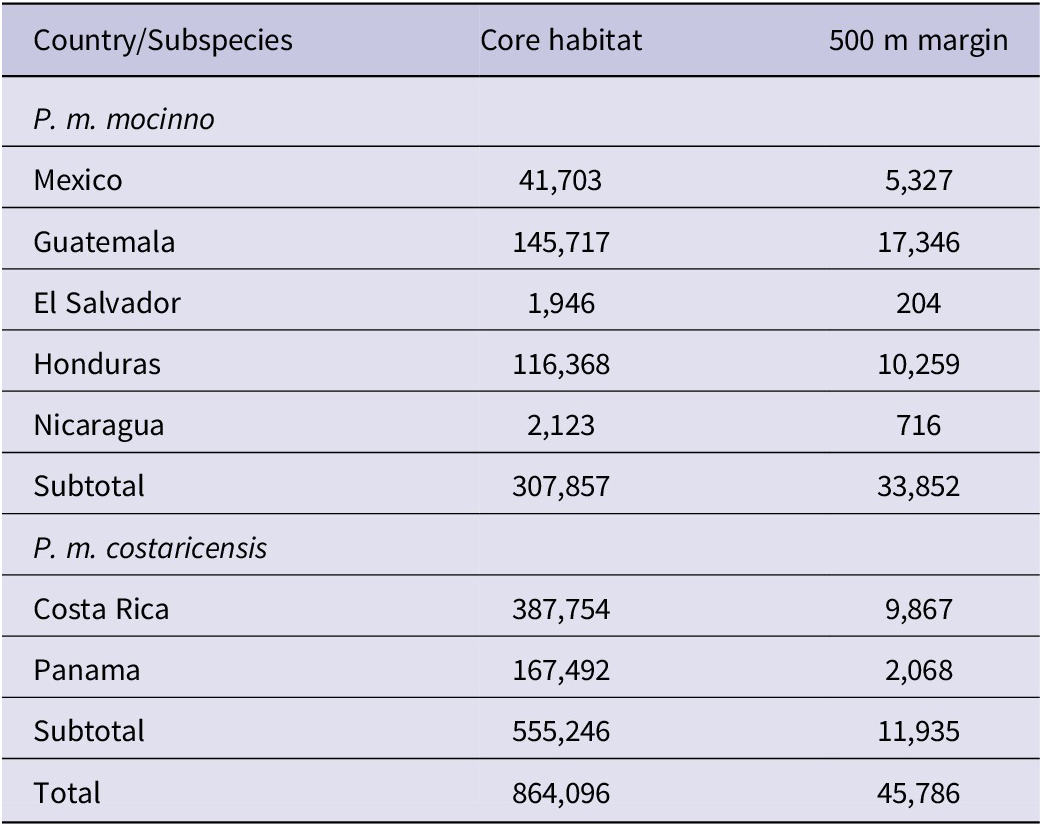
Table 2. Long description
The table is organized into three columns: Country/Subspecies, Core habitat, and 500 m margin.
For the subspecies P. m. mocinno:
* Mexico: 41,703 core, 5,327 margin.
* Guatemala: 145,717 core, 17,346 margin.
* El Salvador: 1,946 core, 204 margin.
* Honduras: 116,368 core, 10,259 margin.
* Nicaragua: 2,123 core, 716 margin.
* Subtotal: 307,857 core, 33,852 margin.
For the subspecies P. m. costaricensis:
* Costa Rica: 387,754 core, 9,867 margin.
* Panama: 167,492 core, 2,068 margin.
* Subtotal: 555,246 core, 11,935 margin.
The grand total for all regions is 864,096 hectares of core habitat and 45,786 hectares of 500 m margin.
A section of the 2021 model of potential Resplendent Quetzal breeding habitat (1,500–3,000 m) from Costa Rica and Panama showing a portion of the largest forest patch (442,000 ± 14,000 ha) that extends across both countries. Note that the Pacific slope edge is more fragmented than the Atlantic slope, a common feature throughout the Mesoamerican region. The white circles show eBird observations which are concentrated in areas of relatively easy access to habitat.
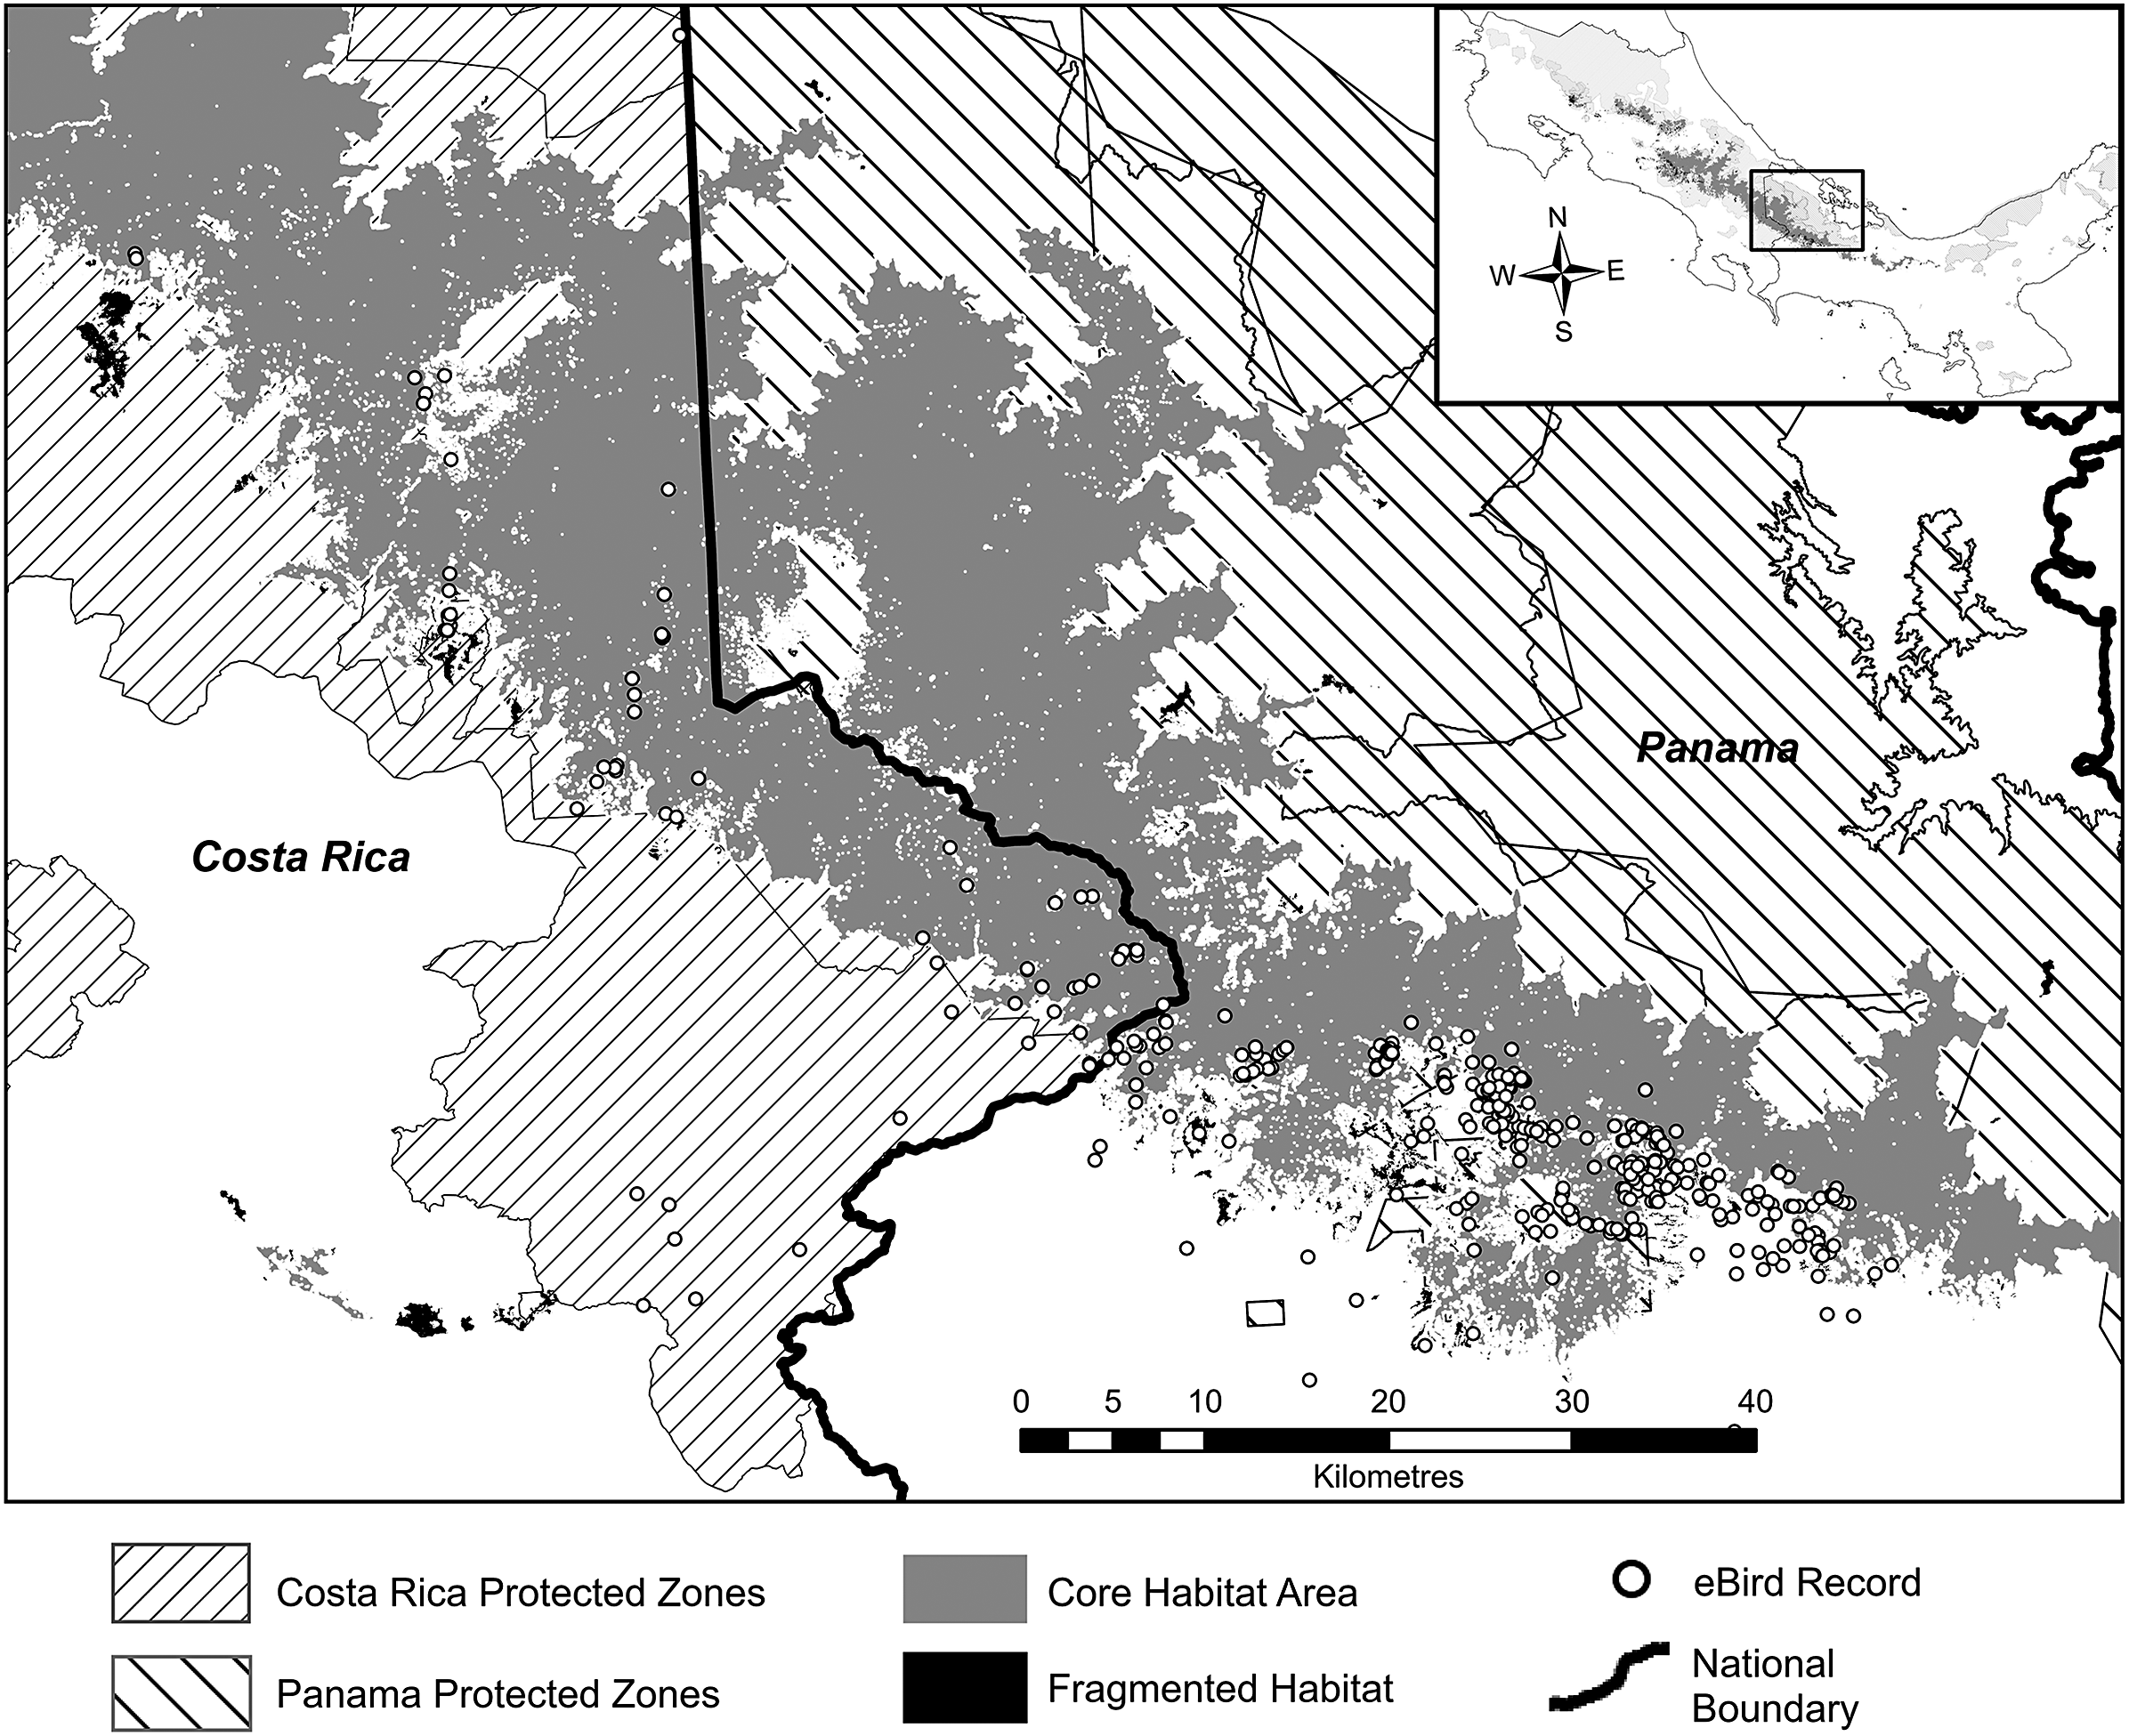
Figure 2. Long description
A grayscale geographical map with an inset in the top right corner showing the broader Mesoamerican region with a rectangle highlighting the current study area. A compass rose indicates North is up.
Main Map Features:
* A thick, jagged black line represents the National Boundary, running roughly Northwest to Southeast, separating Costa Rica on the West from Panama on the East.
* Core Habitat Area is depicted as solid gray irregular shapes concentrated along the central mountain ridge. The largest contiguous patch spans the border.
* Fragmented Habitat is shown as small black clusters, primarily located on the Pacific slope in the West.
* Costa Rica Protected Zones are indicated by diagonal lines sloping down from left to right, covering much of the Northwest and Southwest territory.
* Panama Protected Zones are indicated by diagonal lines sloping down from right to left, covering the Northeast and Southeast territory.
* eBird Records are represented by small white circles. These are densely clustered in the Southeast portion of the core habitat in Panama and scattered along the edges of the habitat in Costa Rica.
* A scale bar at the bottom center indicates a distance of 0 to 40 Kilometres in increments of 5, 10, 20, 30, and 40.
A section of the 2021 output model map (1,500–3,000 m) for Guatemala, showing part of Sierra de Las Minas, the second largest patch of habitat in Mesoamerica. The black highly fragmented areas (<560 ha) still support breeding Resplendent Quetzals. The white circles show locations of eBird observation records.

Figure 3. Long description
A black and white map with gray and hatched overlays.
* Inset Map: Located in the bottom-left corner, showing the outline of Guatemala with a rectangular box indicating the study area in the central-eastern region.
* Main Map Area:
- Northwest and North: Scattered black clusters representing fragmented habitat areas less than 560 hectares. White circles indicating e B i r d records are concentrated along these fragmented patches.
- Center and Southeast: A large, continuous gray mass representing the Core Habitat Area. This area is largely contained within a large polygon filled with diagonal hatching, labeled as Protected Zones.
- Distribution: eBIrd records (white circles) are found both within the core gray habitat and along the edges of the fragmented black patches.
* Map Elements:
- A compass rose is located on the left side, pointing North.
- A scale bar at the bottom right indicates a distance of 0 to 30 Kilometers.
* Legend: Located at the bottom, from left to right:
- White circle: eBird Record.
- Gray square: Core Habitat Area.
- Black square: Fragmented Habitat Area.
- Diagonally hatched square: Protected Zones.
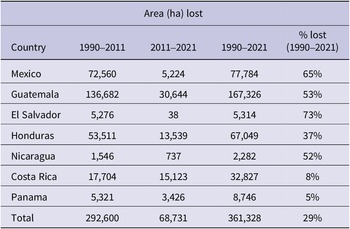
From 1990 to 2021, a total of 361,000 ±10,800 ha of potential breeding habitat between 1,500 and 3,000 m were lost in Mesoamerica (Table 3). The highest decrease was recorded in Guatemala, where 1,673 km2 of lost cloud forest equals 1.54% of the area of the country, followed by Chiapas, Mexico (1.06% of the area of the state), and Costa Rica (0.64% of the area of the country). Additionally, 314,000 ±9,500 ha were lost between 1,200–1,500 m for the same period. Comparing the habitat loss for each subspecies of Resplendent Quetzal, the contrast is quite stark, with 320,000 ha of habitat lost for P. m. mocinno as compared to 42,000 ha of habitat loss for P. m. costaricensis.
Area of potential Resplendent Quetzal breeding habitat lost 1990–2021
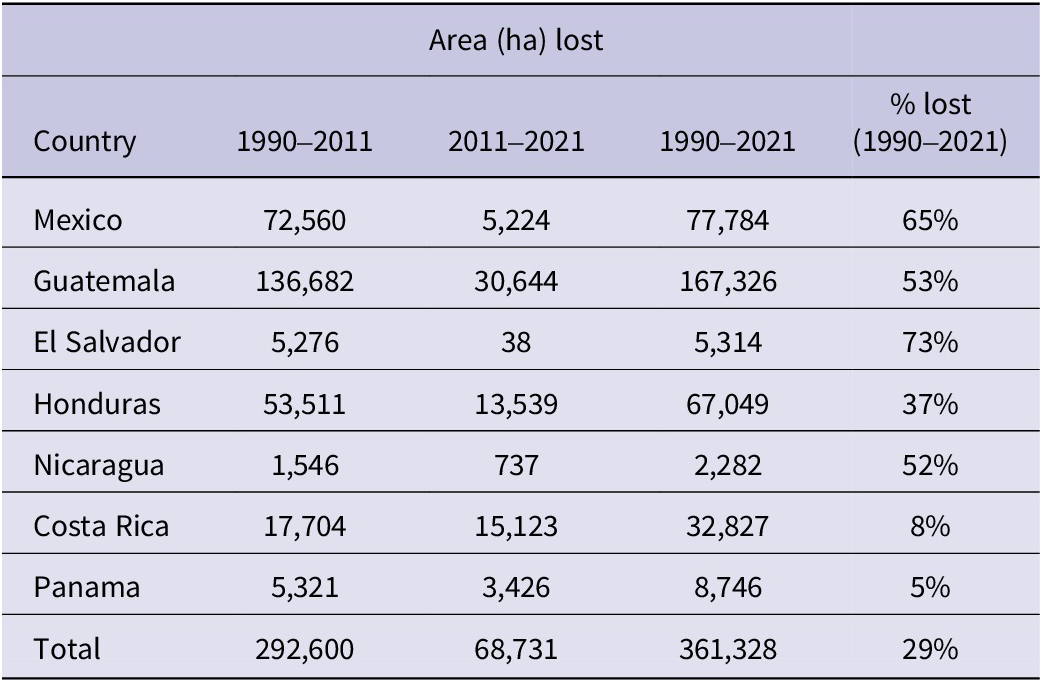
Table 3. Long description
The table contains five columns: Country, Area lost 1990–2011, Area lost 2011–2021, Area lost 1990–2021, and percent lost 1990–2021.
* Mexico: 72,560 ha lost (1990–2011); 5,224 ha lost (2011–2021); 77,784 ha total; 65 percent lost.
* Guatemala: 136,682 ha lost (1990–2011); 30,644 ha lost (2011–2021); 167,326 ha total; 53 percent lost.
* El Salvador: 5,276 ha lost (1990–2011); 38 ha lost (2011–2021); 5,314 ha total; 73 percent lost.
* Honduras: 53,511 ha lost (1990–2011); 13,539 ha lost (2011–2021); 67,049 ha total; 37 percent lost.
* Nicaragua: 1,546 ha lost (1990–2011); 737 ha lost (2011–2021); 2,282 ha total; 52 percent lost.
* Costa Rica: 17,704 ha lost (1990–2011); 15,123 ha lost (2011–2021); 32,827 ha total; 8 percent lost.
* Panama: 5,321 ha lost (1990–2011); 3,426 ha lost (2011–2021); 8,746 ha total; 5 percent lost.
* Total: 292,600 ha lost (1990–2011); 68,731 ha lost (2011–2021); 361,328 ha total; 29 percent lost.
The trend of habitat fragmentation shows an increase in the number of habitat patches from 180 to 203, ultimately declining to 124 and decreasing size index (total area/number of patches) by 50% from 1990 to 2021. The result is a reduction in potential breeding habitat for the Resplendent Quetzal in general, with many patches disappearing, reduced in size, and/or fragmented, thereby spawning new smaller patches of presumably less suitable habitat.
The amount of protected Resplendent Quetzal habitat in the countries of Mesoamerica shows a mix of modest gains and losses from 1990 to 2011 and an overall 5% decrease from 2011 to 2021 (Table 4). The vast protected areas of Costa Rica and Panama are the reason that the overall loss is not greater. As of 2021, almost 725,000 ha of P. m. costaricensis habitat are under protection, while a more modest 229,000 ha of P. m. mocinno habitat are within a variety of international or national protected zones.
Area (ha) of protected Resplendent Quetzal habitat between 1,500 and 3,000 m by country in 1990, 2011 and 2021
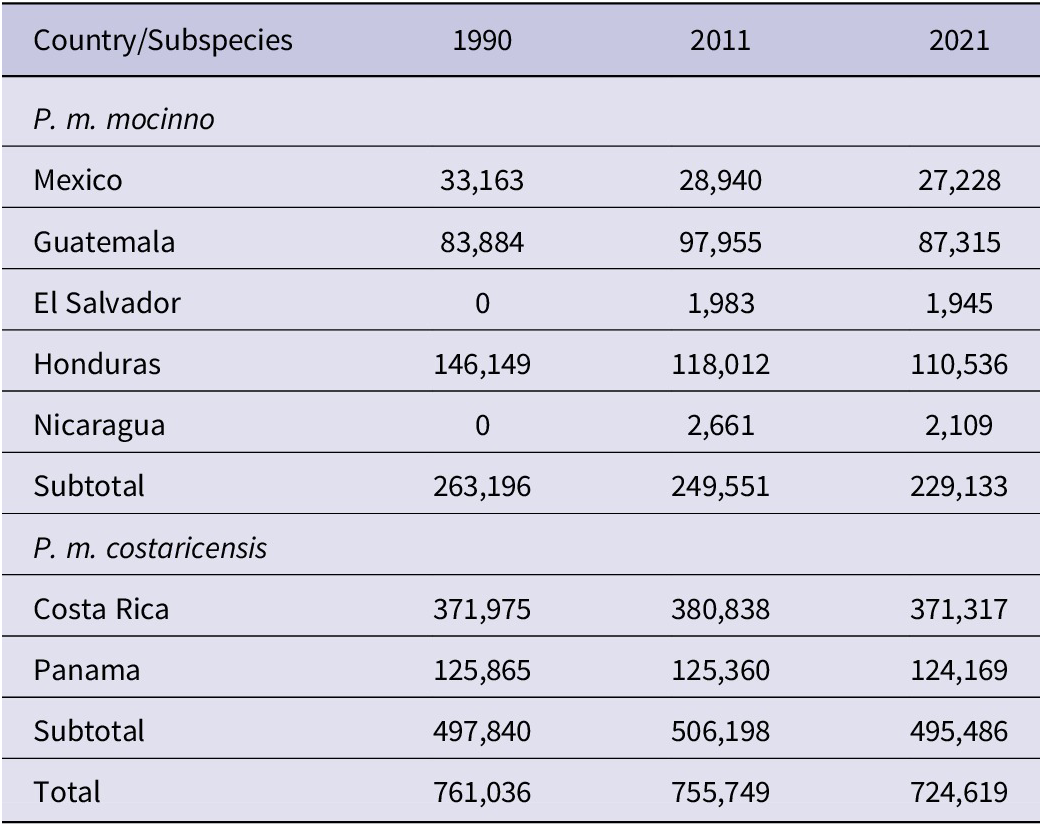
Table 4. Long description
The table is organized into four columns: Country/Subspecies, 1990, 2011, and 2021.
For the subspecies P. m. mocinno:
* Mexico: 33,163 in 1990; 28,940 in 2011; 27,228 in 2021.
* Guatemala: 83,884 in 1990; 97,955 in 2011; 87,315 in 2021.
* El Salvador: 0 in 1990; 1,983 in 2011; 1,945 in 2021.
* Honduras: 146,149 in 1990; 118,012 in 2011; 110,536 in 2021.
* Nicaragua: 0 in 1990; 2,661 in 2011; 2,109 in 2021.
* Subtotal for P. m. mocinno: 263,196 in 1990; 249,551 in 2011; 229,133 in 2021.
For the subspecies P. m. costaricensis:
* Costa Rica: 371,975 in 1990; 380,838 in 2011; 371,317 in 2021.
* Panama: 125,865 in 1990; 125,360 in 2011; 124,169 in 2021.
* Subtotal for P. m. costaricensis: 497,840 in 1990; 506,198 in 2011; 495,486 in 2021.
Overall Total:
* 761,036 in 1990; 755,749 in 2011; 724,619 in 2021.
Population density and abundance of Resplendent Quetzal
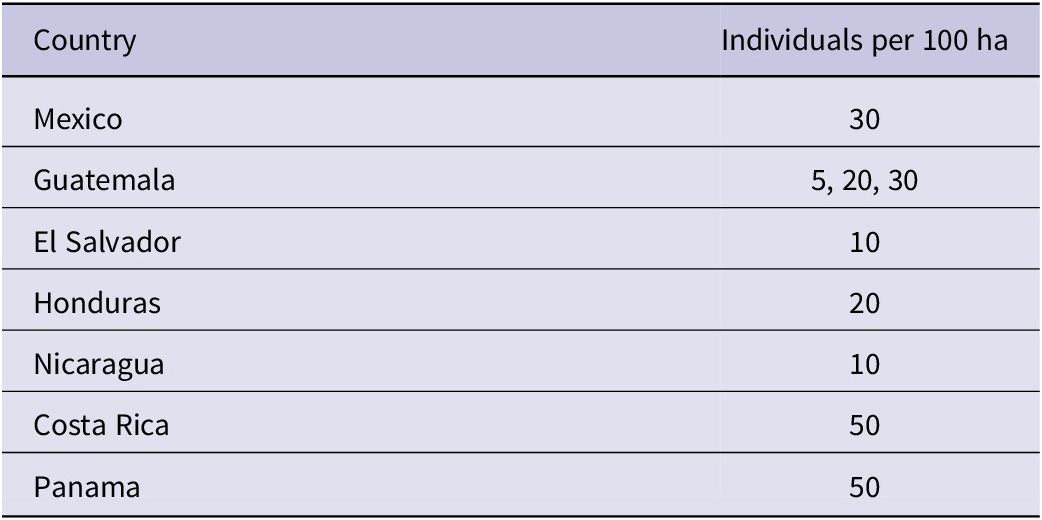
Published estimates of local populations of the Resplendent Quetzal range from 15 to 66 individuals per 100 ha. In the highlands of Chiapas, Mexico, population density was estimated at approximately 60 individuals per 100 ha (Solórzano et al. Reference Solórzano, Castillo-Santiago, Navarrete-Gutierrez and Oyama2003; AFP, pers. obs.). A more recent 10-year study in Chiapas recorded counts of ≤20 individuals per 16 km of trail but did not estimate population density (Wootton et al. Reference Wootton, Enríquez and Pineda Diez de Bonilla2026). In Guatemala, local density estimates range 15–66 individuals per 100 ha based on triangulation and transect counts (Unger Reference Unger1988; Mühlenberg et al. Reference Mühlenberg, Hovestadt and Unger1989; Eisermann Reference Eisermann1999; Haupt Reference Haupt2003; Renner Reference Renner2005). The highest count of 66 individuals per 100 ha is from a valley with high-quality habitat. Density was lower in other areas of the same forest patch (KE, pers. obs.) thus the average density is lower. The model uses 5, 20, or 30 individuals per 100 ha for Guatemala as estimated by expert knowledge for each patch. In Honduras, García Reynaud et al. (Reference García Reynaud, Sorto Sabillón and Padilla Barahona2022) found a density of 40 individuals per 100 ha in La Tigra National Park. Powell and Bjork (Reference Powell and Bjork1995) estimated 44 individuals per 100 ha in the Monteverde cloud forest of Costa Rica. Powell and Bjork (Reference Powell and Bjork1995) also estimate that 682 ha supports 100 breeding pairs which converts to approximately 30 individuals per 100 ha. Ledezma-Campos (unpublished manuscript) estimate 60 individuals per 100 ha in the Monteverde reserve. Poole (pers. obs. 2023/2024) estimates locally 60–100 individuals per 100 ha in parts of the La Amistad National Park in Costa Rica and Panama. Table 5 summarizes the population density numbers that are used in the calculation of abundance for each country.
Population densities of Resplendent Quetzal applied for calculating abundance in each country
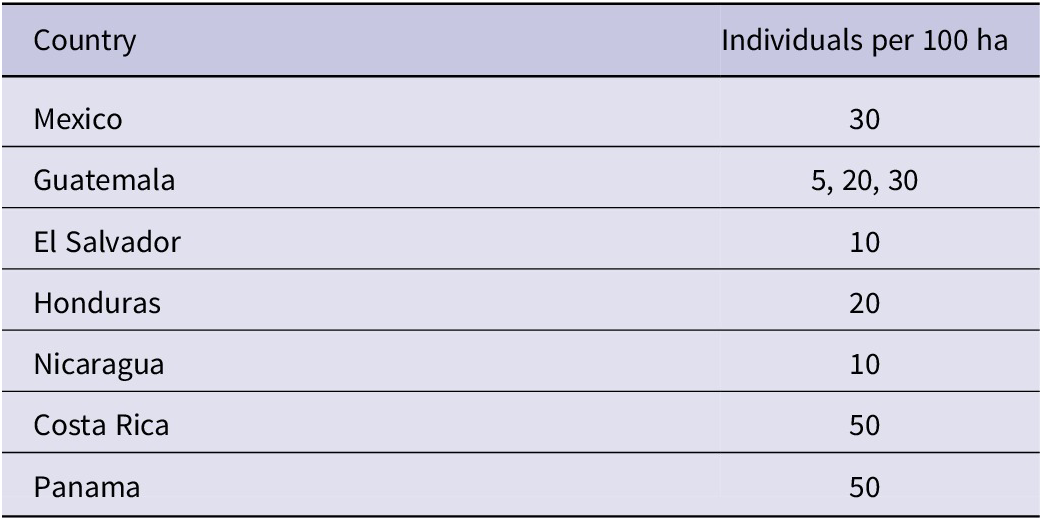
Table 5. Long description
The table consists of two columns: Country and Individuals per 100 ha. The data is as follows:
* Mexico: 30
* Guatemala: 5, 20, 30
* El Salvador: 10
* Honduras: 20
* Nicaragua: 10
* Costa Rica: 50
* Panama: 50
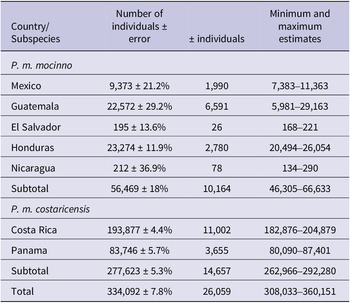
Based on the different population densities applied to coverage of potential habitat, the overall Resplendent Quetzal population in Mesoamerica is estimated to be 308,000 to 360,000 individuals in 2021. Table 6 lists the results for each country and subspecies. The variation in these estimates is derived from the error in our biophysical model, the wide range of sizes and fragmentation of habitat patches, and the inclusion of margin habitat ±5% to the area of potential Resplendent Quetzal breeding habitat. The cumulative effect of these error factors results in an 8% overall error in the estimate of the total Resplendent Quetzal population in Mesoamerica. The population of the southern subspecies P. m. costaricensis (277,500 individuals) is five times larger than the northern P. m. mocinno (56,500).
Minimum and maximum estimates of the populations of Resplendent Quetzal by country and subspecies (2021). The variation (error) in these estimates is derived from the error in our biophysical model, the wide range of sizes and fragmentation of habitat patches, and the inclusion of margin habitat ± 5% to the area of potential Resplendent Quetzal breeding habitat

Table 6. Long description
The table is organized into four columns: Country/Subspecies, Number of individuals plus or minus error, plus or minus individuals, and Minimum and maximum estimates.
Subspecies P. m. mocinno data:
* Mexico: 9,373 plus or minus 21.2 percent; 1,990 individuals; range 7,383 to 11,363.
* Guatemala: 22,572 plus or minus 29.2 percent; 6,591 individuals; range 5,981 to 29,163.
* El Salvador: 195 plus or minus 13.6 percent; 26 individuals; range 168 to 221.
* Honduras: 23,274 plus or minus 11.9 percent; 2,780 individuals; range 20,494 to 26,054.
* Nicaragua: 212 plus or minus 36.9 percent; 78 individuals; range 134 to 290.
* Subtotal for P. m. mocinno: 56,469 plus or minus 18 percent; 10,164 individuals; range 46,305 to 66,633.
Subspecies P. m. costaricensis data:
* Costa Rica: 193,877 plus or minus 4.4 percent; 11,002 individuals; range 182,876 to 204,879.
* Panama: 83,746 plus or minus 5.7 percent; 3,655 individuals; range 80,090 to 87,401.
* Subtotal for P. m. costaricensis: 277,623 plus or minus 5.3 percent; 14,657 individuals; range 262,966 to 292,280.
Global Total: 334,092 plus or minus 7.8 percent; 26,059 individuals; range 308,033 to 360,151.
Conservation status and IUCN Red List status
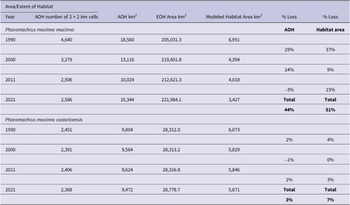
The subspecies of Resplendent Quetzal, P. m. mocinno, in the highlands of southern Mexico, Guatemala, El Salvador, Honduras, and western Nicaragua, and P. m. costaricensis in the highlands of Costa Rica and Panama, have been proposed to be accepted on a species level (Solórzano and Oyama Reference Solórzano and Oyama2010, Schulz and Eisermann Reference Schulz and Eisermann2017). We evaluated the conservation status applying IUCN Red List criteria (IUCN 2012, 2022a) for the species and both subspecies. IUCN (2012, 2022a) requires an evaluation of the change in population size over a period of three generations or 10 years, whichever is longer with a threshold of a 30% reduction in that timeframe. BirdLife International, the IUCN assessment entity, lists the generation time (defined here as the time for both the parents and succeeding offspring to reproduce) for the Resplendent Quetzal as 5.5 years, here rounded to 6 years (BirdLife International 2023). Our estimation with empirical field knowledge (AP, KE, SS) using the IUCN (2022b) generation length calculator, results in 6.6 years rounded to 7. Three generations of 6–7 years at most would cover 21 years. The decrease of habitat, using both the study model and the AOH approach, as indicators of the size of Resplendent Quetzal populations, was 26% from 2000 to 2021 for the species, 24% for P. m. mocinno, and 2% for P. m. costaricensis (Table 7).
Loss of Area and Extent of Habitat (AOH/EOH) and modeled habitat for the Resplendent Quetzal by subspecies for three decadal periods; 1990–2000, 2001–2011, 2012–2021. (AOH small negative values are the result of spatial errors in the 2x2 km coarse grid method)
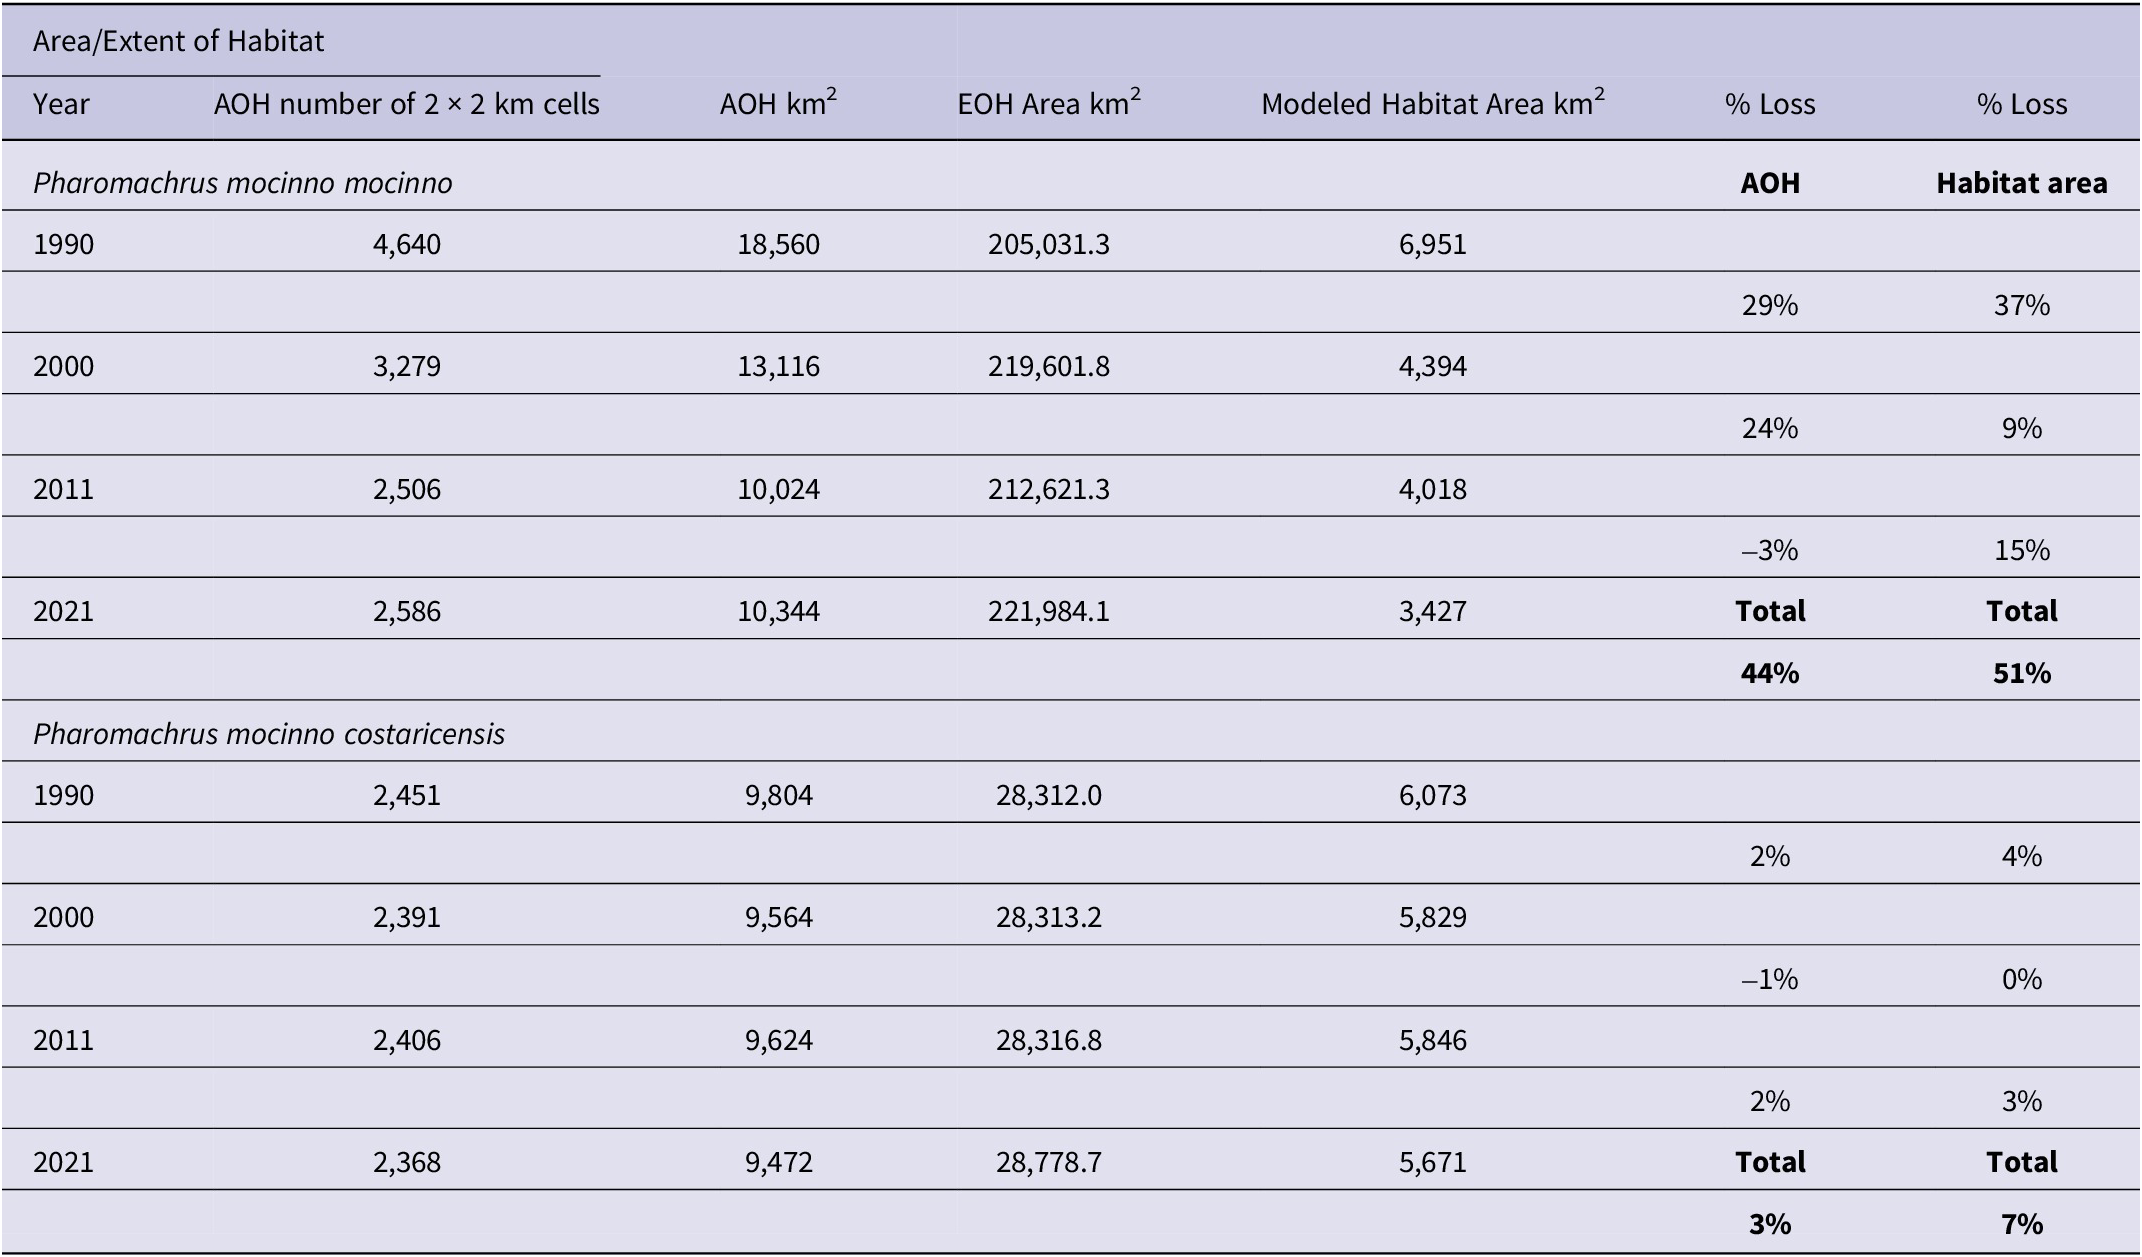
Table 7. Long description
The table is divided into two main sections for the subspecies Pharomachrus mocinno mocinno and Pharomachrus mocinno costaricensis.
For Pharomachrus mocinno mocinno:
- In 1990, A O H was 18,560 km² and modeled habitat was 6,951 km² .
- By 2000, A O H dropped to 13,116 km² (29 percent loss) and habitat to 4,394 km² (37 percent loss).
- By 2011, A O H was 10,024 km² (24 percent loss) and habitat was 4,018 km² (9 percent loss).
- By 2021, A O H was 10,344 km² (minus 3 percent loss) and habitat was 3,427 km² (15 percent loss).
- Total loss for this subspecies was 44 percent for A O H and 51 percent for habitat area.
For Pharomachrus mocinno costaricensis:
- In 1990, A O H was 9,804 km² and modeled habitat was 6,073 km²
- By 2000, A O H was 9,564 km² (2 percent loss) and habitat was 5,829 km² (4 percent loss).
- By 2011, A O H was 9,624 km² (minus 1 percent loss) and habitat was 5,846 km² (0 percent loss).
- By 2021, A O H was 9,472 km² (2 percent loss) and habitat was 5,671 km² (3 percent loss).
- Total loss for this subspecies was 3 percent for A O H and 7 percent for habitat area.
Discussion
Resplendent Quetzal distribution
The influence of forest patch size on the model varies by country and in ways not well understood. Costa Rica has the largest patch of continuous habitat (shared with Panama - La Amistad International Park) and several other very large areas of suitable habitat; this may influence the population density compared to locations in Guatemala or Chiapas, Mexico with their numerous yet fragmented patches of forest habitat 560 ha or greater. Eisermann (Reference Eisermann2012) found a statistically significant negative trend in the abundance of Resplendent Quetzals at Montaña Sacranix, a continuously shrinking cloud forest area in Alta Verapaz, Guatemala, based on monthly censuses from 2004 to 2011. It is possible that larger areas provide better habitat quality (less disturbance, food availability, nest cavities, riparian zones, smaller home ranges) and thus a greater density of Resplendent Quetzals. The data for each country and the sizes of the habitat patches suggest that a few large refuges support larger populations, possibly with higher densities than numerous smaller areas above a minimum size threshold (560 ha). The exception to this is the known occupancy of highly fragmented areas by breeding Resplendent Quetzals (KE and SS, pers. obs.) and shown in Figure 2, identifies a likely minor underestimate of Resplendent Quetzal populations by the model. These areas are difficult to delineate and quantify spatially yet clearly contribute to Resplendent Quetzal populations.
The loss rates of modeled Resplendent Quetzal habitat (1,500–3,000 m) in the period 1990–2011 are extreme, especially for the northern subspecies: 73% in El Salvador and 65% in Chiapas, Mexico. Losses in other countries ranged from 36 to 53%, with the lowest rates 5–8% in Panama and Costa Rica. The rates have generally slowed since 2011, notably in Chiapas where protected areas have had a positive influence. Losses of habitat were greatest in Guatemala (167,000 ha) and Honduras (67,000 ha) over the entire 31-year period of the study.
Not surprisingly, countries that have larger areas of inaccessible terrain and implemented protected areas earlier retain the most suitable habitat. A rise in the amount of protected area habitat between 1990 and 2011, but a decline thereafter to 2021, perhaps indicates encroachment in some parks. Given that it is unknown whether the breeding range elevation was lower (more habitat between 1,200–1,500 m) and densities of Resplendent Quetzal were higher in earlier time periods, estimating previous populations and trajectories of population change seem speculative and have not been attempted here.
In Costa Rica, a greater diversity of frugivorous bird species was found on isolated fruit trees <2 km from forest patches when compared to isolated trees located up to 7 km away from the same fragments (Luck and Daily Reference Luck and Daily2003). This supports expert field knowledge showing Resplendent Quetzals using habitats at and beyond the edge of forest patches. The model used in this study includes an estimated distance of 500 m as a practical and conservative benchmark for estimating the extent of margin habitat use. Thus, this habitat feature is a source of variation in the overall population estimate.
The inclusion of eBird data (January–June, 1977–2023) on the habitat maps shows a general overlap with modeled Resplendent Quetzal habitat but demonstrates the spatial bias of limited access to habitat by users of the eBird reporting system. Figures 1 and 2 show the skewed distribution of birder, tourist, and bird tour group eBird data. In addition, eBird data need to be assessed for obvious errors of location, duplicate entries from members of tour groups and other issues. Nonetheless eBird data is a valuable visualisation tool to help our understanding of potential Resplendent Quetzal breeding habitat. However, not all eBird records during the six-month period are necessarily nesting birds. Non-breeders occur in typical nesting habitats but also migrate to other atypical (lower elevation) areas in each six-month season.
The greatest source of uncertainty in our model is the density of individuals, the basis for estimating overall abundance. Solórzano et al. (Reference Solórzano, Castillo-Santiago, Navarrete-Gutierrez and Oyama2003) suggests a patchy distribution for the Resplendent Quetzal, with some areas showing significantly higher densities of nesting pairs than others, likely related to habitat quality. Our analysis does not explicitly account for variation in habitat quality within forested areas. Targeted studies would be needed to help understand such variation.
The range of the population estimates is influenced by errors associated with the construction of digital elevation models, properly identifying potential habitat from TMF satellite imagery, the inclusion of margin habitats (or not) as core breeding habitat, and the sparse literature on the actual density of breeding pairs of the Resplendent Quetzal. We have augmented this sparse knowledge with that of field experts (ornithologists, birding tour guides) who have spent extensive time spent locating and observing the species. There is mixed information in the literature versus field expertise where observers take a more conservative approach in estimating the density of individuals or breeding pairs. There is field evidence from surveys that locally both very low and very high densities can be found, for example 15 to 66 individuals per 100 ha in Guatemala vs. 60–100 individuals per 100 ha in Costa Rica and Panama.
The primary unanswered questions are a) what is the density of breeding Resplendent Quetzals in prime and less suitable habitat above 1,500 m and b) what proportion of these habitats do the birds actually occupy?
The technology that could help derive these answers is passive acoustic monitoring (PAM). Pérez Granados and Traba (Reference Pérez-Granados and Traba2021) demonstrate that PAM has been increasingly used to improve density estimates of wildlife populations, including birds, in the last ten years. Automated recording units (ARU) are well suited to assess bird populations in forest ecosystems where individual birds can be hard to detect visually. ARUs facilitate the collection of data over large areas and over long periods of time at low cost (Hill et al. Reference Hill, Prince, Covarrubias, Doncaster, Snaddon and Rogers2017). Studies have shown that the use of ARUs with appropriate analytical techniques reduces the biases related to human observers, improving the accuracy of density estimates. Machine learning and artificial intelligence (AI) algorithms for automated species identification in processing large PAM data sets is increasing (Sharma et al. Reference Sharma, Sato and Gautam2023).
The Resplendent Quetzal is a fairly vocal species with nearly 15 distinct and relatively loud calls (Solórzano et al. Reference Solórzano2010). Recent work in recording the suite of Resplendent Quetzal calls and their detailed spectrograms provides an acoustic baseline for population studies with PAM (Bolaños-Sittler et al. Reference Bolaños Sittler, Sueur, Fuchs and Aubin2020). An initiative to assess the density of Resplendent Quetzal populations could prioritise regions where the species is most at risk (Mexico and Guatemala) and those where Resplendent Quetzal are most likely to be thriving, such as the contiguous intact habitat and protected areas of the Talamanca Highlands in Costa Rica and Panama.
Although further ecological research remains important, our results indicate that immediate conservation of remaining cloud forest habitat and reduction of deforestation are the most urgent priorities. Within the ecological pressures of climate change, the main threat to populations of Resplendent Quetzal is the loss of habitat, principally by converting forest into agricultural areas. Habitat restoration and reconnection of fragmented cloud forest patches may provide important complementary conservation opportunities across the region.
Conclusions
From 1990 to 2021 the Resplendent Quetzal has suffered a loss of habitat of approximately 30% from southern Mexico to Panama. This trend has not stopped due to increasing pressure on natural habitats from rapidly growing human populations (Richter Reference Richter2000; Comisión Económica para América Latina y el Caribe (CEPAL) 2025). More striking is the difference in habitat losses between the two subspecies of Resplendent Quetzal over the entire period of the study 1990 to 2021. The habitat of the northern subspecies P. m. mocinno, has been reduced by 51%, indicating a loss of approximately half of the population over the 31-year period. In contrast, the loss of habitat for the southern subspecies P. m. costaricensis was much lower at 6.6%.
The IUCN (2012) criteria specify that a 30% reduction in a population within a 3-generation timeframe (26% over 21 years in this case) is the threshold for a change to a category of Threatened. Thus, according to IUCN Red List criteria, neither the species nor the subspecies qualify to be reclassified to a threatened category. However, it is possible that the reduction of the total population of P. mocinno is 30% or greater, given the 8% range of error in the estimate of quetzal numbers. The majority of the population reduction (24%) is in the northern subspecies (P.m. mocinno).
In terms of conservation practice, three countries have elevated the status of the Resplendent Quetzal as Endangered (Mexico, Gobierno de Mexico 2010), Vulnerable (Guatemala, CONAP 2022) or Threatened (Costa Rica, Gobierno de Costa Rica 2017). Given that the northern subspecies has declined at least 51% since 1990, a more elevated conservation status is warranted. While the habitat conditions of both subspecies are quite different, the study provides range-wide information that could support a possible upgrade in the IUCN Red List status of the species to Vulnerable (VU A2).
Supplementary material
The supplementary material for this article can be found at http://doi.org/10.1017/S0959270926100756.
Acknowledgements
We appreciate the expert field knowledge shared by Henry Barrantes and Jeisson Figeroa (Costa Rica), Ito Santamaría, Jeffrey Dietrich, and Ignacio Yufera (Panama). We appreciate the comments of an anonymous reviewer which improved the manuscript. Helpful advice in the development of the study was provided graciously by Francis Joyce, Nicholas Hendershot, Dallas Levy, Gretchen Daily, Gonçalo Ferraz, and Viviane Zulian. Jon Bonkoski provided initial data analysis and scoping. The ArcGIS Pro software was licensed through Haverford College.
Financial support
This research received no specific grant from any funding agency, commercial or not-for-profit sectors.
Competing interests
The authors declare none.






 Open access

