Coronavirus disease 2019 (COVID-19), caused by severe acute respiratory syndrome coronavirus 2 (SARS-CoV-2), was declared a pandemic by the World Health Organization (WHO). Reference Lu, Zhao, Li and Niu1–3 The main route of transmission is thought to be via contact and droplet spread from symptomatic and asymptomatic (including presymptomatic) persons. 4 Hospital outbreaks and healthcare-acquired infections (HCAIs) have been documented for a wide range of pathogens Reference Haque, Sartelli, McKimm and Abu Bakar5 including reports of healthcare-associated COVID-19. Reference Heinzerling, Stuckey and Scheuer6,Reference Meredith, Hamilton and Warne7 The association between comorbidities and COVID-19 mortality and sequelae means that those already in the hospital for non–COVID-19 conditions are at increased risk of poorer outcomes. Reference Gold, Sehayek, Gabrielli, Zhang, McCusker and Ben-Shoshan8,9 Therefore, understanding the role of hospital outbreaks and transmission dynamics within healthcare settings is vital in reducing such events and protecting patients.
We investigated 2 outbreaks on 3 wards identified in a UK District General Hospital where healthcare-associated transmission was suspected. We conducted a retrospective cohort study to analyze transmission characteristics to inform infection control measures. Here, we report the findings of our cohort study.
Methods
Outbreak detection
The first outbreak was detected on 2 general adult wards (wards A and B) on March 6, 2020, with 41 COVID-19 patients between March 6 and April 8. The second outbreak occurred on a male adult ward (ward C) with 31 COVID-19 patients on April 27, 2020, with positive test dates between April 2 and May 3, 2020.
Ward layouts, testing policy, and infection control policies
A ward consists of 3 four-bed bays; with 2 opposing beds facing each other and 8 sole-occupancy rooms per ward (Supplementary Fig. 1 online). The distance between adjacent beds measured from the middle of the bed is 2.5 m. The distance from head end to head end between beds facing each other is 4.5–5 m, and the distance head end to head end between beds diagonally is 6.5–7.5 m. The attending medical team usually sees all patients in each ward. A single nurse and healthcare assistant (HCA) are dedicated to 8 patients during a shift. Staff can cross cover different bays over multiple shifts.
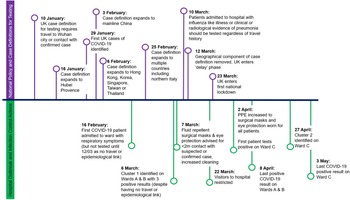
Timeline of key national events, case definition changes and hospital actions.

Testing criteria and personal protective equipment (PPE) policies were prescribed by national policy with frequent changes as the pandemic evolved (Fig. 1). Diagnostic testing was initially only advised for symptomatic patients with a travel history to specified countries or an epidemiological link to a confirmed case. The epidemiological requirement was not removed until March 10, 2020, for hospital patients, 4 days after the initial cases who had no travel history in this outbreak had tested positive. All testing used reverse transcription polymerase chain reaction (RT-PCR) on the Hologic platform. Testing of healthcare workers was not routinely introduced at this time; thus, testing data for staff were limited and incomplete and therefore were not included in our analysis.
Classification of cases
Patients with COVID-19 were identified by clinical symptoms and laboratory testing. When clinical and radiological symptoms were convincing but the laboratory result was negative, the patient was individually assessed and classified by the clinical team and the radiologist.
European Centre for Disease Prevention and Control (ECDC) definitions were used to categorize COVID-19 patients into 3 groups: (1) community associated if onset occurred <2 days after admission or 3–7 days after admission with strong suspicion of community transmission; (2) probable healthcare associated if onset occurred 8–14 days after admission or 3–7 days after admission with a strong suspicion of healthcare transmission; or (3) definitely healthcare associated if onset occurred >14 days after admission. 10 Probable and definite healthcare-associated infections were grouped to define COVID-19 patients as either community-acquired or healthcare-associated cases.
A case was defined as a healthcare-associated COVID-19 patient who was suspected to have acquired their infection on the wards under investigation.
Analysis of transmission
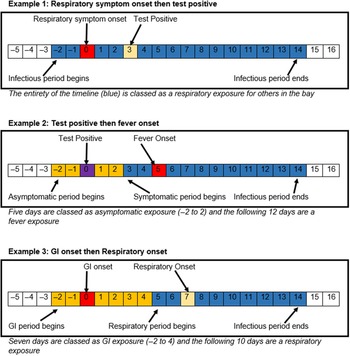
All COVID-19 patients were deemed to be infectious from 2 days before to 14 days after symptom onset or positive test result. Because the affected wards were primarily occupied by older patients, a 14-day period was used based on UK guidance for longer isolation of COVID-19 residents in care homes. 11 Infectious patients were classified by a mutually exclusive hierarchy of symptoms during their infectious period: (1) respiratory symptoms; (2) fever or gastrointestinal (GI) symptoms; or (3) asymptomatic. Although some COVID-19 patients presented with delirium, which subsequently became a more recognized symptom of COVID-19 in older people, all of these patients also had at least 1 other symptom, so delirium was not used in the symptom classification for exposure. Symptom classification was changed if symptoms changed during the infectious period (Fig. 2).
Examples of symptom classification and progression through symptom hierarchy during infectious period.

Of the 153 patients on the wards under investigation, exposures were calculated and analyzed for 122 patients. Exposures for 31 COVID-19 patients were not calculated because their infection was thought to have been acquired in the community (n = 28) or on a different ward (n = 3), although they remained as sources of exposure.
Time at risk was defined as a 12-day period. For healthcare-associated COVID-19 patients, these were days 2–14 preceding their onset or positive result date. For non–COVID-19 patients, these were the 12 days prior to discharge or last known date on the ward of interest.
We calculated the exposures within the same 4-bed bay by compiling individual patient timelines using bed location, symptoms, and onset dates. For example, if a patient was in a bed and a COVID-19 patient with respiratory symptoms was in the adjacent bed and another patient with fever was in the opposite bed, they would have an adjacent respiratory exposure and an opposite fever exposure. Any days spent in a single-occupancy side room were also recorded to determine whether this reduced risk of healthcare-associated COVID-19.
Statistical analysis
Patients from both outbreaks were pooled into 1 study to increase power. Risk ratios (RRs), 95% confidence intervals (CIs), and P values were calculated using the Pearson χ Reference Wang, Horby, Hayden and Gao2 test or the Fisher exact test. Variables with a significance value <0.2 in univariable analysis or identified as potential confounders in stratified analysis were included in the regression model. A backward step approach was used to eliminate variables with the highest P value first and for examining for confounders at each step to produce a final model.
To assess length of exposure, we created 3 categorical variables for days exposed to any respiratory, any fever, or any asymptomatic COVID-19 patient. We categorized these into no exposure, exposure for 1 day, or exposure for ≥2 days. Further analysis of time by both exposure type and proximity was not possible due to loss of power.
Sensitivity analysis
To understand the impact of the infectious period, particularly for asymptomatic COVID-19 patients, a sensitivity analysis was undertaken by producing 2 additional models with different infectious periods. In scenario 2, to reduce the overall infectious period for COVID-19 patients, we classified all COVID-19 patients as infectious from 48 hours prior to 7 days after symptom or positive result. In scenario 3, because the onset date for asymptomatic COVID-19 patients is unknown, we placed the test date in the middle of a 15-day infectious period, counting 7 days prior and after as infectious for asymptomatic COVID-19 patients. Symptomatic patients remained infectious 2 days prior and 14 days post onset or test date (whichever was earlier).
The UKHSA has legal permission, provided by Regulation 3 of The Health Service (Control of Patient Information) Regulations 2002, to process patient confidential information for national surveillance of communicable diseases and as such, individual patient consent was not required for this study.
Results
Outbreak description
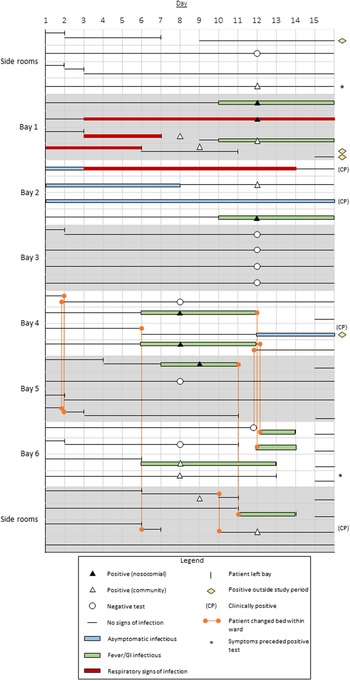
Of 153 patients, 72 (47%) were COVID-19 patients; 28 cases were community acquired and 44 were healthcare associated. Among these 72 cases, 36 COVID-19 patients (50%) had respiratory symptoms, 36 (50%) had fever, 12 (17%) had GI symptoms, 13 (18%) displayed some degree of delirium, and 10 (14%) were asymptomatic. We detected a higher proportion of asymptomatic COVID-19 patients among the healthcare-associated group at 20% (n = 9) compared to only 4% (n = 1) in the community-acquired group. Also, 2 bays had no cases but were staffed by the same team of healthcare workers who were looking after patients in infected bays. A sample timeline used to identify exposures is shown in Figure 3.
Timeline of patient movements, symptoms and test results for ward A during the outbreak.

No aerosol-generating procedures (AGPs) were performed on any patients in the 3 wards during the study period.
Transmission analytical study
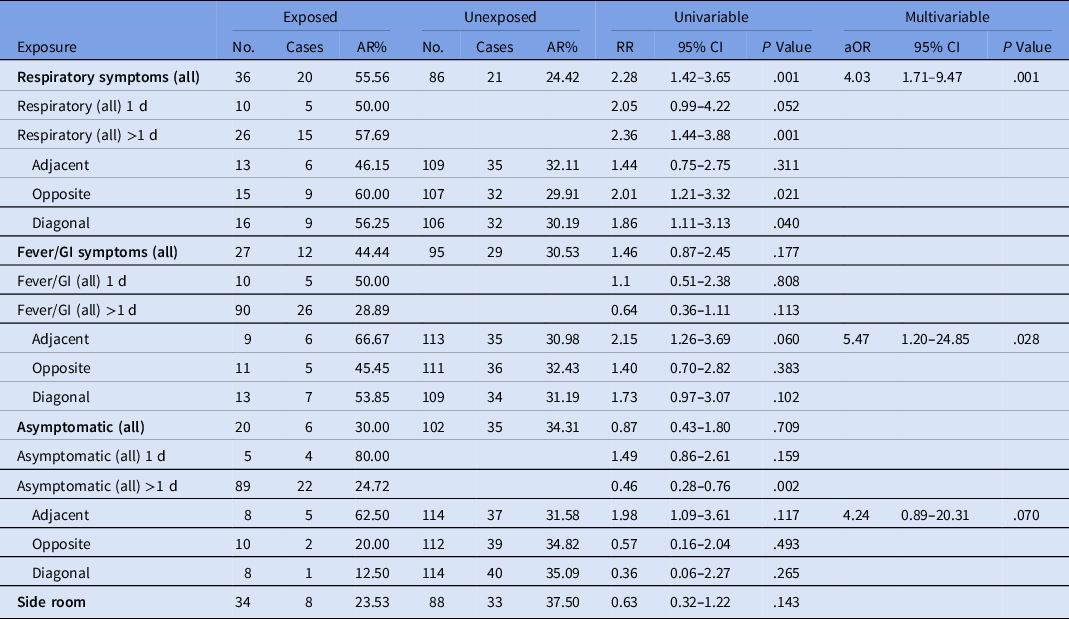
Being exposed to a COVID-19 patient within the same bay was associated with a doubling of risk of becoming a case (crude risk ratio, 2.08; 95% CI, 1.20–3.63; P = .006) (Table 1).
Univariable and Multivariable Results for Exposure to COVID-19 Patients Within the Same Bay by Symptom and Proximity and Use of Individual Side Room

Note. AR, attack rate; RR, risk ratio; aOR, adjusted odds ratio; 95% CI, 95% confidence interval; GI, gastrointestinal.
In univariable analysis patients exposed to a respiratory COVID-19 patient in the same bay had 2.3 times the risk of becoming a case (95% CI, 1.42–3.65; P = .001) regardless of proximity. Only respiratory exposures were significant at the 0.05 level, but exposure to a patient with fever or GI symptoms or an asymptomatic COVID-19 patient in the adjacent bed was associated with an infection rate >60%.
The risk ratio for being a case increased with time for exposure to a respiratory COVID-19 patient from 2.05 (95% CI, 0.99–4.22; P = .052) for 1 day of exposure to 2.36 (95% CI, 1.44–3.88; P = .001) for 2 or more (extended Mantel-Haenszel test for trend; odds ratio 2.15 for each step increase; P = .001). However, this increase was not retained in the best-fitting final multivariable model. We detected no change with length of exposure to fever or asymptomatic cases (Table 1).
Patients with respiratory symptoms in the adjacent bed (all), patients with fever and/or GI symptoms in adjacent bed, and asymptomatic in the adjacent bed were retained in the final model. Exposure to a COVID-19 patient with respiratory symptoms remained significant with an adjusted odds ratio (aOR) of 4.03 (95% CI, 1.71–9.47; P = 0.001). Exposure to a patient with fever and/or GI symptoms in the adjacent bed was also significant, with an aOR of 5.47 (95% CI, 1.20–24.85; P = .028). Exposure to an asymptomatic COVID-19 patient in the adjacent bed had an aOR of 4.24 but was not significant (P = .070). Being in an individual side room did not have any effect on the risk of becoming a case with a risk ratio of 0.63 (95% CI, 0.032–1.22; P = .143).
Sensitivity analysis
Reducing the overall infectious period to 2 days prior and 7 days after onset or test date lowered the odds, but both any respiratory exposure (aOR, 3.18; 95% CI, 1.30–7.78; P = .011) and a patient with fever (aOR, 4.83; 95% CI, 1.09–21.43; P = .038) in the adjacent bed remained significant. When the infectious period for asymptomatic COVID-19 patients was adjusted to be 7 days prior and 7 days after the test date, exposure to an asymptomatic COVID-19 patient in the adjacent bed became significant (aOR, 7.21; 95% CI, 1.96–26.44; P = .003).
Discussion
Exposure to a COVID-19 patient in a bay was observed to be a significant risk factor for onward transmission. Although any exposure to a respiratory patient in a bay was a risk factor for healthcare-associated acquisition, exposure to a nonrespiratory or asymptomatic patient was only important if the patient was in the adjacent bed. This finding implies that closer proximity is required for transmission. Asymptomatic transmission from the adjacent bed was associated with an increased risk but was only significant in 1 model in our sensitivity analysis. Increased duration of respiratory exposure changed the risk of becoming a case with exposure to a respiratory case for 1 day doubling the risk of healthcare-associated infection, although this variable was not retained in the best-fit model.
The current UK Health Security Agency contact definition for COVID-19 is a person being within 2 m of a COVID-19 case for >15 minutes. 12 The current ECDC definition of a high-risk exposure is being in a closed environment with a COVID-19 case who is also within <2 m. 13 On this premise, patients who were exposed to COVID-19 while awaiting results in cohort areas were stepped down to non–COVID-19 areas following a negative result. These exposures were not classified as high risk due to the distance between beds and the lack of exposure to any AGPs. Some of these patients subsequently developed new symptoms while on non-COVID-19 wards and were associated with transmission chains in the second cluster.
Evidence of transmission was seen in patients situated across and diagonally from patients with respiratory symptoms, possibly indicating potential for transmission distance to breach those described for droplet distance. 4 This transmission was only observed with respiratory patients, potentially due to the ability to atomize infective particles during coughing even without AGP. Reference Asadi, Bouvier, Wexler and Ristenpart14 Aerodynamics studies on COVID-19 support similar travel distances of infected particles the indicating airborne route as a potentially significant mode of transmission in crowded hospital settings. Reference Haque, Sartelli, McKimm and Abu Bakar5,Reference Guo, Wang and Zhang16 Pressure to recognize the potential of airborne transmission is growing. Reference Morawska and Milton17,Reference Wilson, Corbett and Tovey18
It is unlikely that the transmission >2 m is explained from third-person fomites or contact transmission by staff because this association was only seen with respiratory exposures. If this was third-person indirect contact transmission, it would be expected to have similar risk of transmission for all types of exposure or a random association.
This study had several limitations. As a study undertaken during an outbreak our study has limited power; however, it still yielded some important findings. Staff information was insufficient to allow inclusion within the study, and asymptomatic testing of staff was not routinely undertaken at this time. Thus, any potential role of asymptomatic staff could not be explored. However, infected healthcare workers did not appear to be primary exposures because there were identifiable community- or healthcare-associated primary cases for each chain of transmission in a bay. Furthermore, 2 bays were completely spared of transmission in the initial cluster despite being cared for by the same team of healthcare workers caring for patients in infected bays.
Furthermore, we have included patients with a clinical diagnosis of COVID-19 who tested negative by swab RT-PCR. These patients were included based on clinical suspicion rather than a confirmed diagnosis. The swabbing method was not consistent for all participants; nose swabs were predominately used, but practice varied at this stage in the pandemic.
The use of whole-genome sequencing (WGS) would greatly add to this type of study. Using WGS, potential transmission events could have been tracked with much greater confidence and detail. However, at this time of the pandemic, widespread WGS was not available.
In conclusion, our findings demonstrate that transmission dynamics are important in assessing spread. Following the basic principles of outbreak investigation (ie, tracking, tracing, and root-cause analysis) is critical in identifying appropriate mitigating measures to help prevent chains of transmission.
Supplementary material
To view supplementary material for this article, please visit https://doi.org/10.1017/ice.2021.483
Acknowledgments
We thank all the staff involved in responding to the outbreaks at the hospital and for the collecting the data that made this study possible. In particular, we thank Constantinos Missouris, Rahul Chahan, and Ainhoa Uribarren.
Financial support
This research did not receive any specific grant from funding agencies in the public, commercial or not-for-profit sectors.
Conflicts of interest
All authors report no conflicts of interest relevant to this article.