


Introduction and Purpose of Study
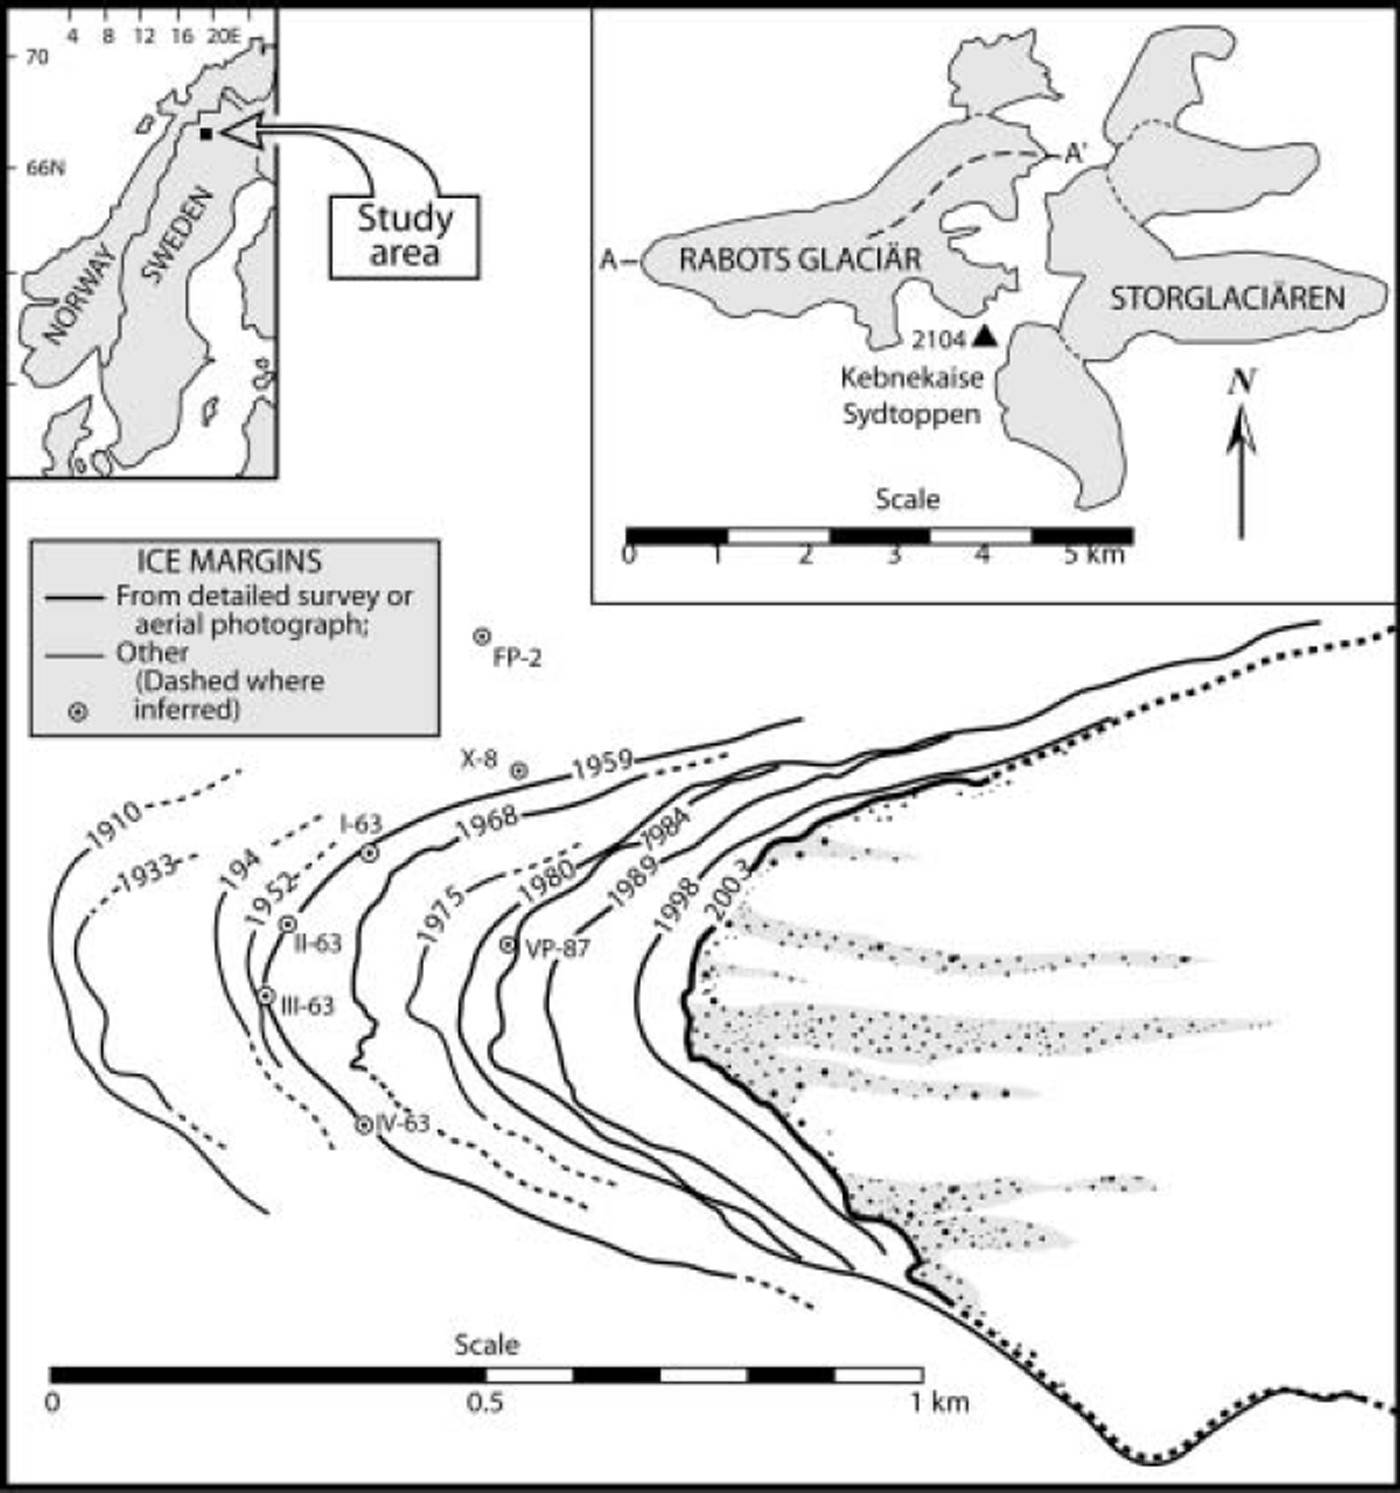
Rabots Glaciär is a small (3.7km2), polythermal glacier located in the Kebnekaise Massif, northern Sweden (Fig. 1). Presently the glacier is ∼4km in length. The thickness of Rabots Glaciär appears to be relatively uniform over much of its length, averaging about 85 m. The maximum ice depth is ∼175 m and is found in the northeastern cirque basin. Ice velocities over the lower 2 km of the glacier vary little from ∼7 m a-1, reflecting the constancy of both ice thickness and surface slopes (Reference BruggerBrugger, 1992).
Historical retreat of Rabots Glaciär as documented by ice-marginal positions. Inset map shows the location of the glacier and Storglaciären in the Kebnekaise massif. Profile along the line A–A’ is shown in Figure 4.
Glaciers in the Swedish Arctic advanced late in the 19th century during the local culmination of the Little Ice Age (LIA), and then began to retreat in response to a ∼1°C steplike warming that occurred around 1910 (Reference HolmlundHolmlund, 1993). Although it appears that many nearby glaciers have nearly completed their response to this warming (Reference HolmlundHolmlund, 1988, Reference Holmlund1993; Reference Holmlund, Karlén and GruddHolmlund and others, 1996), Rabots Glaciär continues to retreat at a significant rate.
Of particular interest, given their close proximity to one another and their similar size, is the difference in the recent behaviors of Rabots Glaciär and Storglaciären, Sweden (also polythermal). On the basis of time-dependent numerical modeling of each glacier’s response to perturbations in mass balance, Reference BruggerBrugger (1992) concluded that the apparent nonsynchronous retreat of the glaciers is due to differences in their response times rather than to differences in microclimates, glacier hypsometry or causal climatic forcings. The response time of Rabots Glaciar, measured either as that originally defined by Reference NyeNye (1960) or as the volume timescale of Reference Jóhannesson, Raymond and WaddingtonJόhannesson and others (1989), is approximately twice that of Storglaciären. Storglaciären’s shorter response time is related to its higher ice velocities arising principally from greater ice thickness and steeper surface slopes. Additional modeling experiments (Reference BruggerBrugger, 1992, Reference Brugger1997) suggest that while Storglaciären is close to being in equilibrium with the existing climate, Rabots Glaciär will not approach its new steady state until later in the 21st century. Thus it might be expected that Rabots Glaciär will continue to exhibit substantial changes in ice geometry and terminus position.
The purpose of this paper is to present the results of a detailed resurvey of Rabots Glaciär carried out in summer 2003, which in conjunction with existing maps of the ice surface, historical observations and measurements of terminus positions allowed us to (1) document the changes in the glacier’s geometry and terminus position over the interval 1910-2003, and (2) estimate changes in ice volume during that same interval. Reference HolmlundHolmlund (1987) performed a similar analysis for the purpose of reconstructing a mass-balance record for Storglaciären. Comparison of these changes in glacier length and volume provides additional evidence for the non-synchronous behaviors of Rabots Glaciär and Storglaciären.
Ice Margins and Retreat, 1910-2003
Ice-marginal positions documenting the retreat of Rabots Glaciär from 1910 to 2003 are shown in Figures 1 and 2. Ice margins are compiled from historical photographs, unpublished survey data, published and unpublished maps, aerial photographs and previous compilations (in particular Reference KarlénKarlen, 1973). A distinction is made in Figure 1 between those ice margins defined by aerial photographs (or maps derived from them) and detailed surveys (>20 points measured) for which the raw data were available and verifiable, and those positions based on other sources.
(a) Time–distance diagram of the historical retreat of Rabots Glaciär and Storglaciären; and (b) derived rates of retreat. Mean summer temperatures recorded at Kiruna, Sweden, and the Tarfala Research Station are also shown in (b). Shaded uncertainties in (b) are discussed in the text. The 1986–88 peak in the Storglaciären record is a result of the terminus not having been measured for several years previously.
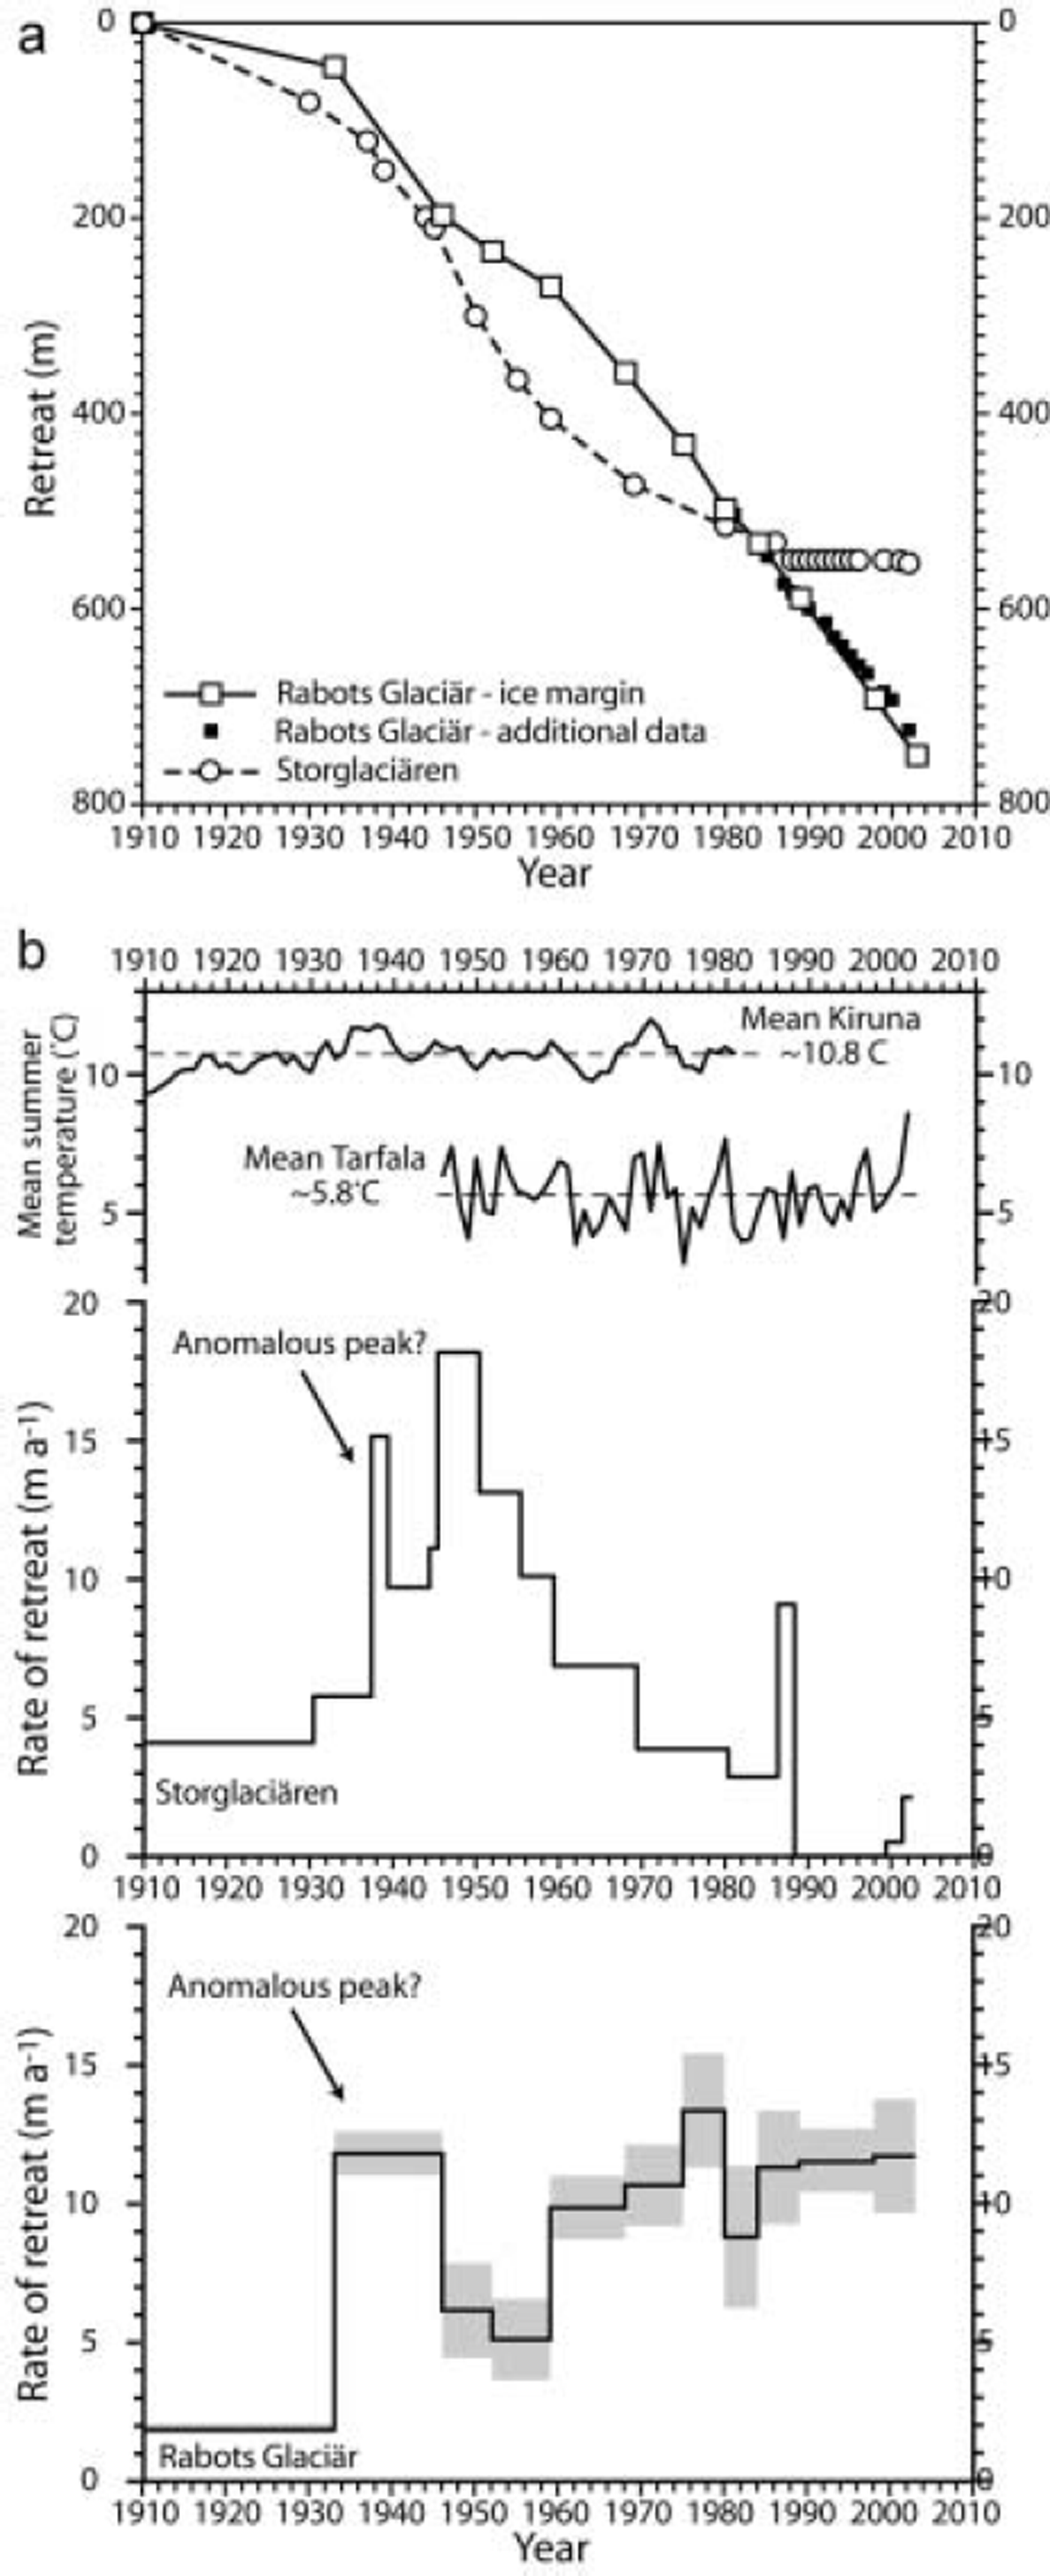
From its 1910 maximum extent to the present, the glacier’s terminus has retreated ∼750m. Ice retreat for discrete intervals (Fig. 2a) is derived from ice-marginal positions as well as data found in unpublished reports of the Tarfala Research Station and archives at Stockholm University. The latter sources consist of surveys of the glacier’s terminus using a variety of techniques (including simple tape measurements), but lacked a sufficient number of data points or otherwise did not allow us to define the geometry of ice margins as in Figure 1. The rate of ice retreat (Fig. 2b) was determined for only those intervals associated with well-defined ice margins, where ice recession was averaged over ∼500 m of the ice front. Uncertainties in the retreat rate are based on an estimated ± 5 m uncertainty in individual ice margins owing to possible measurement errors, projecting and plotting of margins, and so forth.
The glacier’s initial rate of retreat, from 1910 to 1933, averaged ∼2.0ma–1 . The mean rate of retreat increased to ∼11.7 m a–1 between 1933 and 1946. The apparent abruptness of this increase might be an artifact of the resolution of the retreat record. It may, however, be due in part to the unusually high temperatures during this time that would have affected local energy and mass balances at the terminus. Between 1946 and 1959, ice recession proceeded at a more moderate pace (5-6 m a-1). Thereafter the rate of retreat was more or less constant at ∼11 m a-1.
Changes in Ice Surfaces and Volume
The 1959, 1980 and 1989 ice surfaces
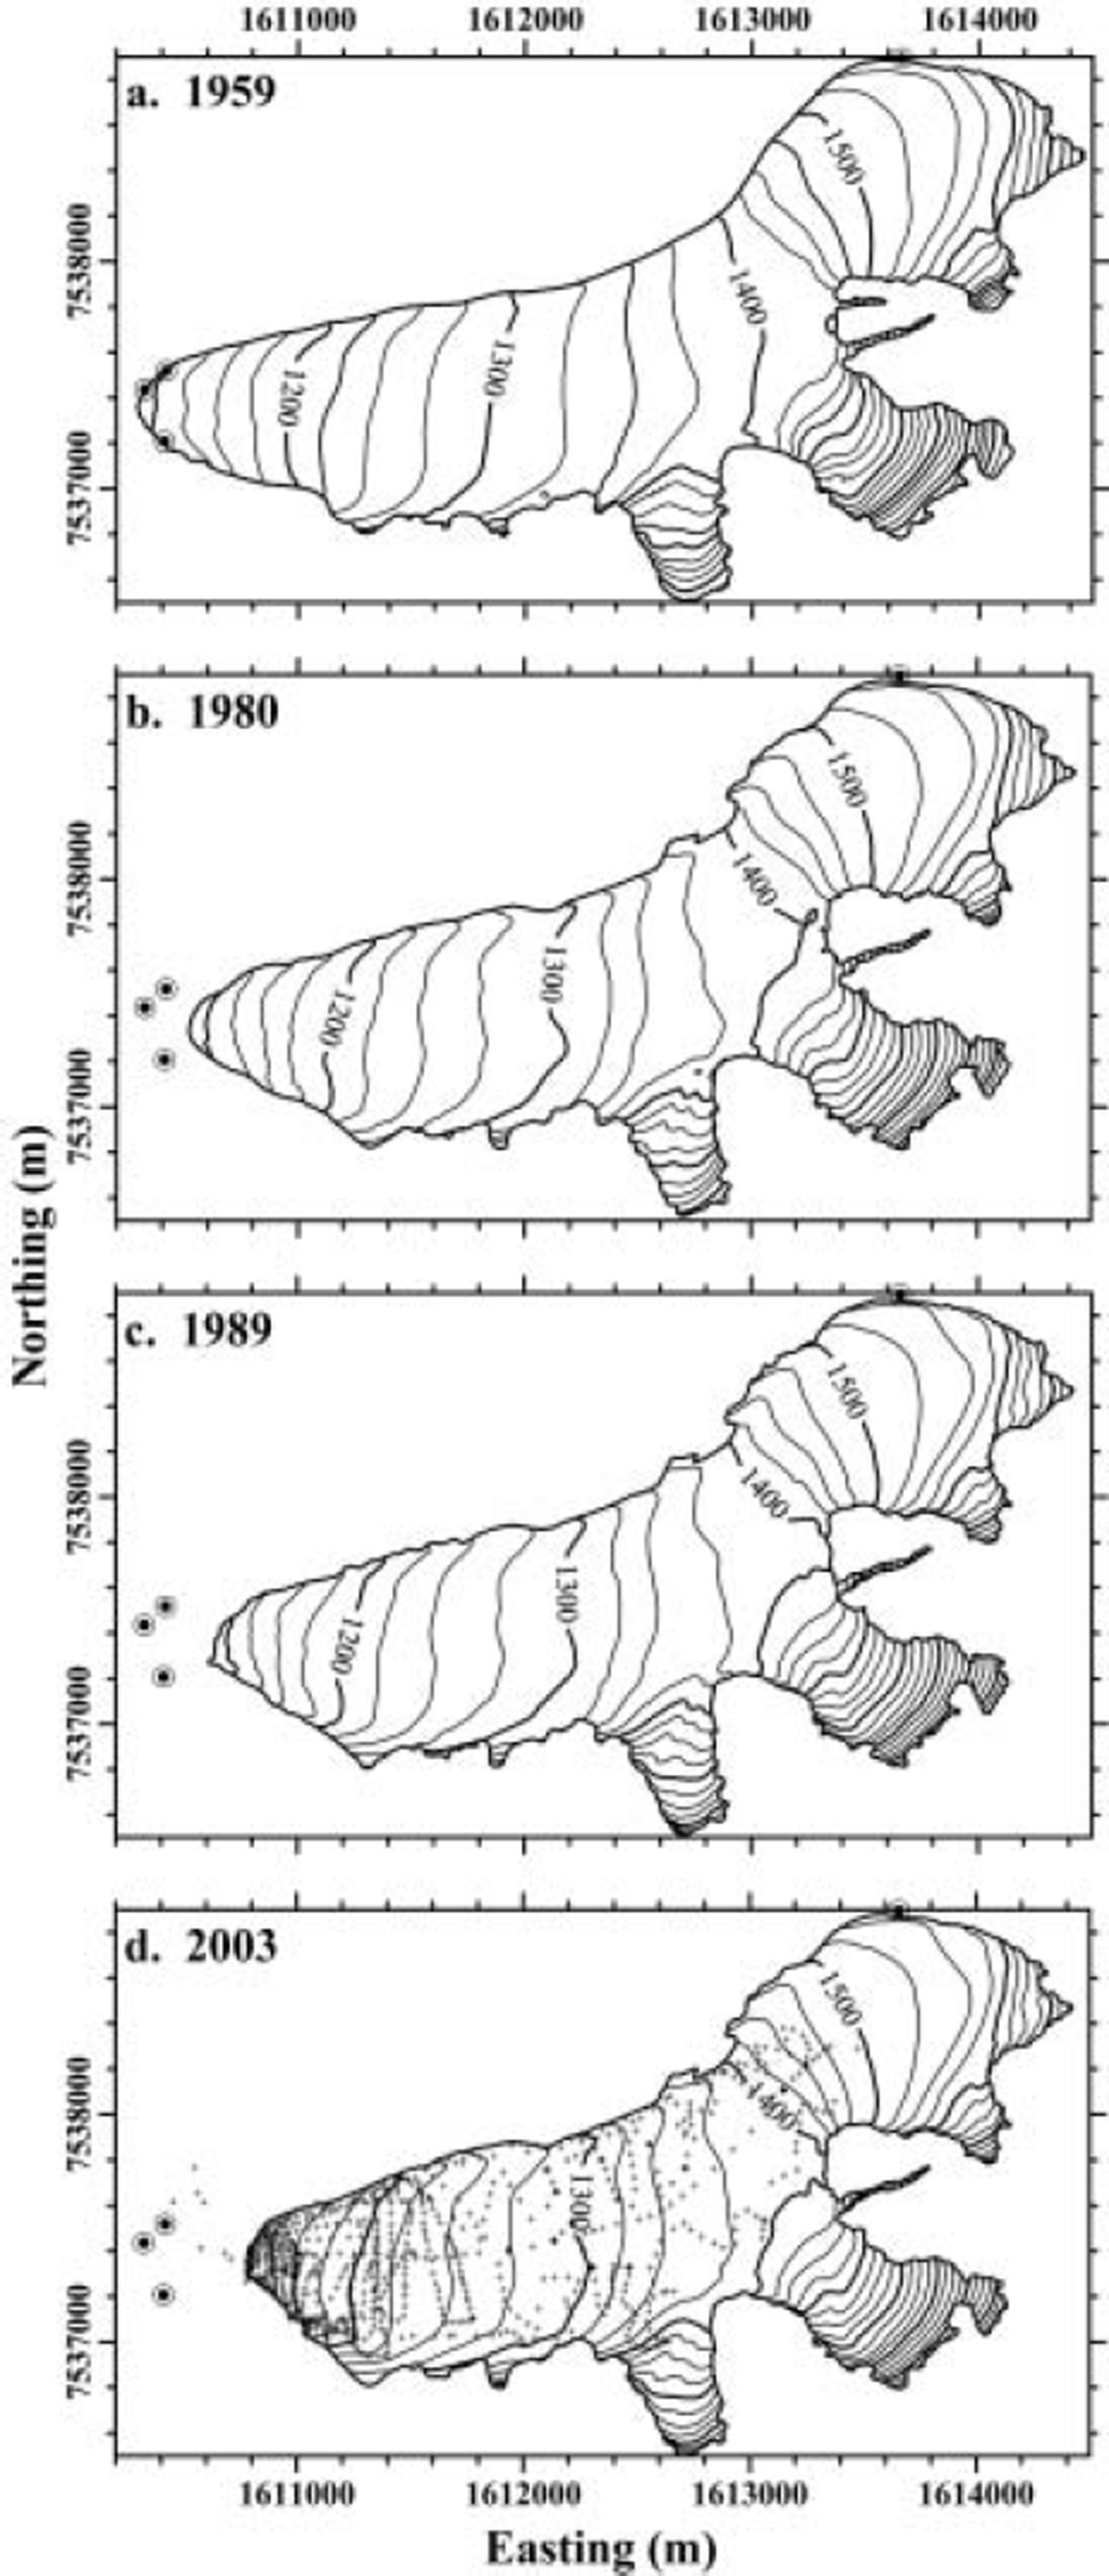
Ice surface topography for Rabots Glaciär is available in maps (Fig. 3a-c) produced from aerial photographs for the years 1959 (unpublished), 1980 (Reference Holmlund and SchyttHolmlund and Schytt, 1987) and 1989 (unpublished). Data from a 1981 survey of a stake network (n = 23) used for velocity measurements indicate that the mean difference between measured ice surface elevations and those shown on the 1980 map is -1.2 ± 1.8 m. Considering that changes brought about by ablation (typically ∼0.9 m ice a-1 ) or accumulation (typically ∼1.3 m ice a-1) had occurred in the interim, the uncertainty in the ice surface depicted in the 1980 map is estimated to be ±1 m. This value is consistent with estimates of the uncertainty of topographic maps reported in other studies (e.g. Reference HolmlundHolmlund, 1987; Reference Reynolds and YoungReynolds and Young, 1997; Reference AndreassenAndreassen, 1999; Reference Hagen, Melvold, Eiken, Isaksson and LefauconnierHagen and others, 1999). For the unpublished 1959 and 1989 maps, uncertainties could not be assessed independently. The 1959 map exists in draft form and was constructed in the 1980s. The accuracy of the map is, however, considered to be similar to that of the 1980 map (personal communication from P. Holmlund, 1986), so we assign the same uncertainty (±1 m) to it. The 1989 map (also a draft) is more problematic in that there is a slight distortion of the glacier’s projection with respect to known bedrock fixed points (personal communication from P. Holmlund, 1991). We therefore assign an uncertainty of ± 2 m to the 1989 ice surface.
Ice surfaces for Rabots Glaciär in 1959 (a), 1980 (b), 1989 (c) and 2003 (d). Coordinates shown are in the Swedish RT-90, 2.5 gon system. Contour interval is 25 m. Circled points are known fixed points. Small crosses in (d) show the locations of most survey points, but some are obscured by contour labels.
The 2003 ice surface
In July 2003 a detailed resurvey of the surface of Rabots Glaciär was carried out using differential global positioning system (GPS) techniques. The use of GPS surveys in glaciological studies is well known (e.g. Reference Hulbe and WhillansHulbe and Whillans, 1994; Reference VaughanVaughan, 1994; Reference Eiken, Hagen and MelvoldEiken and others, 1997; Reference Theakstone, Jacobsen and KnudsenTheakstone and others, 1999). In the interest of brevity, therefore, the theory is not reviewed here and only a brief description of certain aspects of our survey is given.
The base station receiver (Trimble 4600LS) was located on a moraine crest ∼0.5 km from the glacier’s terminus and was linked via radio to the roving receiver, permitting realtime kinematic (RTK) surveying. The RTK technique also eliminated the need for post-processing of the data. After initialization, ice-marginal positions and surface elevations were measured using preset quality control parameters. In most instances, measurements were automatically recorded only when horizontal and vertical precision were both ≤0.05 m and position dilution of precision (PDOP) values were low. Typically occupation times for data acquisition were on the order of several seconds. For some points measured in the upper reaches of the glacier, the criterion for acceptable horizontal and vertical precision was relaxed to ≤0.1 m in order to reduce the time required for data acquisition. In these areas, up to 5min was required to achieve the better precision, if achieved at all. This was done to maximize the number of points measured, as the ‘window’ available for maintaining initialization during RTK surveying was severely limited by both the constellation of satellites and the steep, high valley walls that surround much of the glacier. The location and density of the nearly 1000 points (Fig. 3d) surveyed varied according to irregularities in local surface topography (or ice margin) and our expectations of where more significant changes in the ice surface should have occurred. Thus point density is greater at the terminus and over the undulating surface of the lower reach of the glacier than it is over the more planar surfaces up-glacier. We were unable to survey points in the heavily crevassed ice of the southern tributary cirques and the uppermost reach of the trunk valley. Consequently the survey data were augmented with ice surface elevations taken from the 1989 map. Measured elevations suggest that virtually no appreciable changes have occurred in these areas in the intervening 14years (Fig. 3d).
Several fixed points were surveyed in order both to facilitate georeferencing in conjunction with existing maps and to provide a tie to other fixed points used for velocity measurements in the 1980s. Differences between the GPS-determined elevations of these fixed points (n = 13) and those indicated on the 1980 map are similar, having a mean of 16.1 ± 2.2 m. No systematic trends are evident in these differences. Thus this value was uniformly used to make elevations on the 1959, 1980 and 1989 maps consistent with those measured in the 2003 survey.
Changes in the longitudinal profile
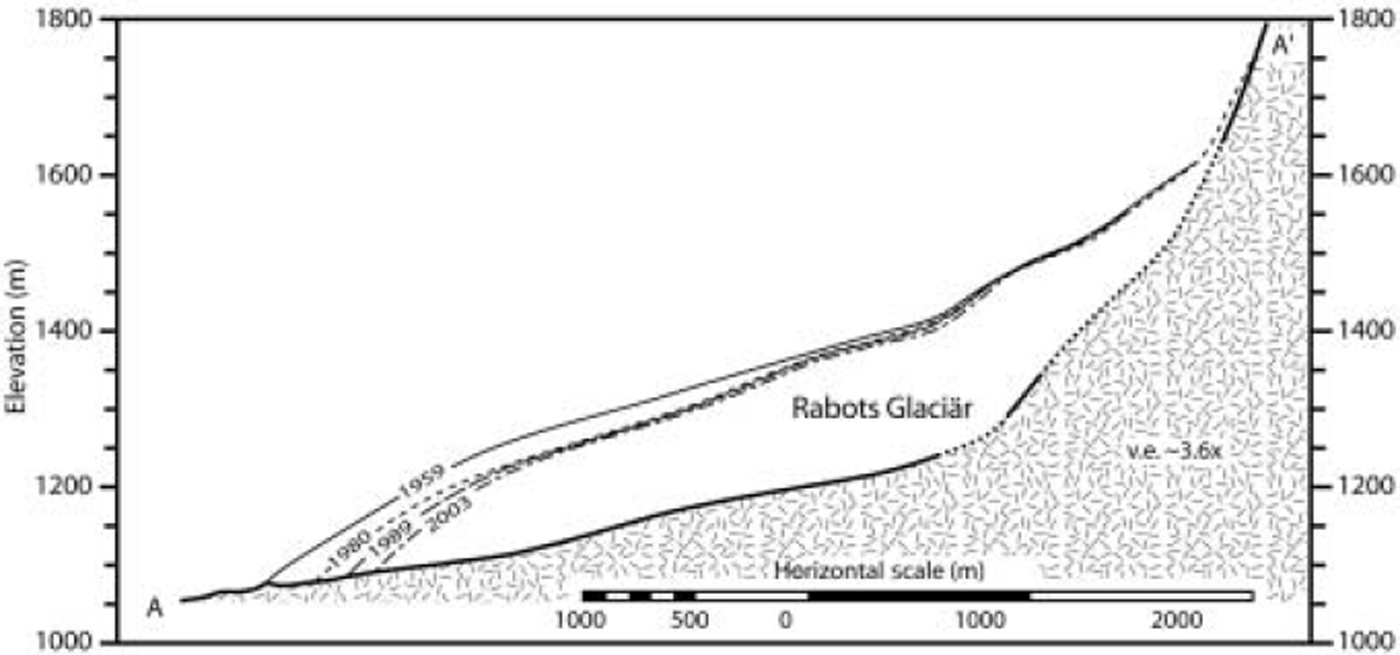
The recent evolution of the longitudinal profile of Rabots Glaciär is shown in Figure 4. Not surprisingly, the most pronounced changes have occurred at and near the terminus in connection with its retreat. Above elevations of ∼1500 m, profile changes are relatively small not only for each interval, but also over the entire 44 years for which profiles can be constructed. It is also clear that the most significant adjustments in glacier geometry were made during the interval 1959-80.
Longitudinal profile changes for Rabots Glaciär during the interval 1959–2003. Profile is along the line A-A’ shown in Figure 1 . Dotted portions of the bed profile are areas where the glacier’s depth is less certain.
Volume changes
Maps of 1959, 1980 and 1989 ice surfaces were digitized using the software package Didger® 3 (Golden Software). The 1959 and 1980 maps were digitized following their 5 m contour interval resolution, and the 1989 map following its 10m contour interval resolution. Data from the 2003 survey were used in their raw form and supplemented with digitized data from the 1980 surface in areas above 1500 m. We assume minimal changes have occurred in these areas based on a few measurements and extrapolations of the glacier’s 2003 longitudinal and transverse profiles. The appropriateness of this assumption is discussed subsequently. All maps were georeferenced using the fixed points established during the 2003 survey. Irregularly spaced digitized or survey data were transformed into regular grid files using a linear kriging interpolation method within the software Surfer® 8 (Golden Software). Grid spacing was specified to be 10 m. Changes in ice volume (hence mass) between the periods 1959-80, 1980-89 and 1989-2003 were calculated using three algorithms (Trapezoidal Rule, Simpson’s Rule and Simpson’s 3/8 Rule) within Surfer®. The use of all three methods provides a measure of the accuracy of volume calculations. In all cases, values determined by the three different methods of calculating volume differed by <0.1%.
Changes in the glacier’s surface elevation between the periods 1959-80, 1980-89 and 1989-2003 are shown in Figure 5. Between 1959 and 1980, the volume of Rabots Glaciär decreased by about (51.1 ± 6) x 106m3 , equivalent to ∼2.4 × 10⁶m3 a-1 . The net volume change corresponds to a mean change in surface elevation
 (averaged over the entire former surface of the glacier) of -12.4 ± 1.5 m and a change in area Δ
A of -3.0 × 10⁵ m2.
Changes in the ice surface of Rabots Glaciär between the intervals 1959–80 (a), 1980–89 (b) and 1989–2003 (c). Note that the glacier margins differ slightly in some areas, as a result of inability to distinguish the ice margin from marginal snow banks on aerial photos during the map-making process or during measurement in the field. These differences were not deemed significant in the analysis presented here. Minimum mean surface change indicated in (b) and the areas indicated by questions marks in (b) and (c) are discussed in the text.
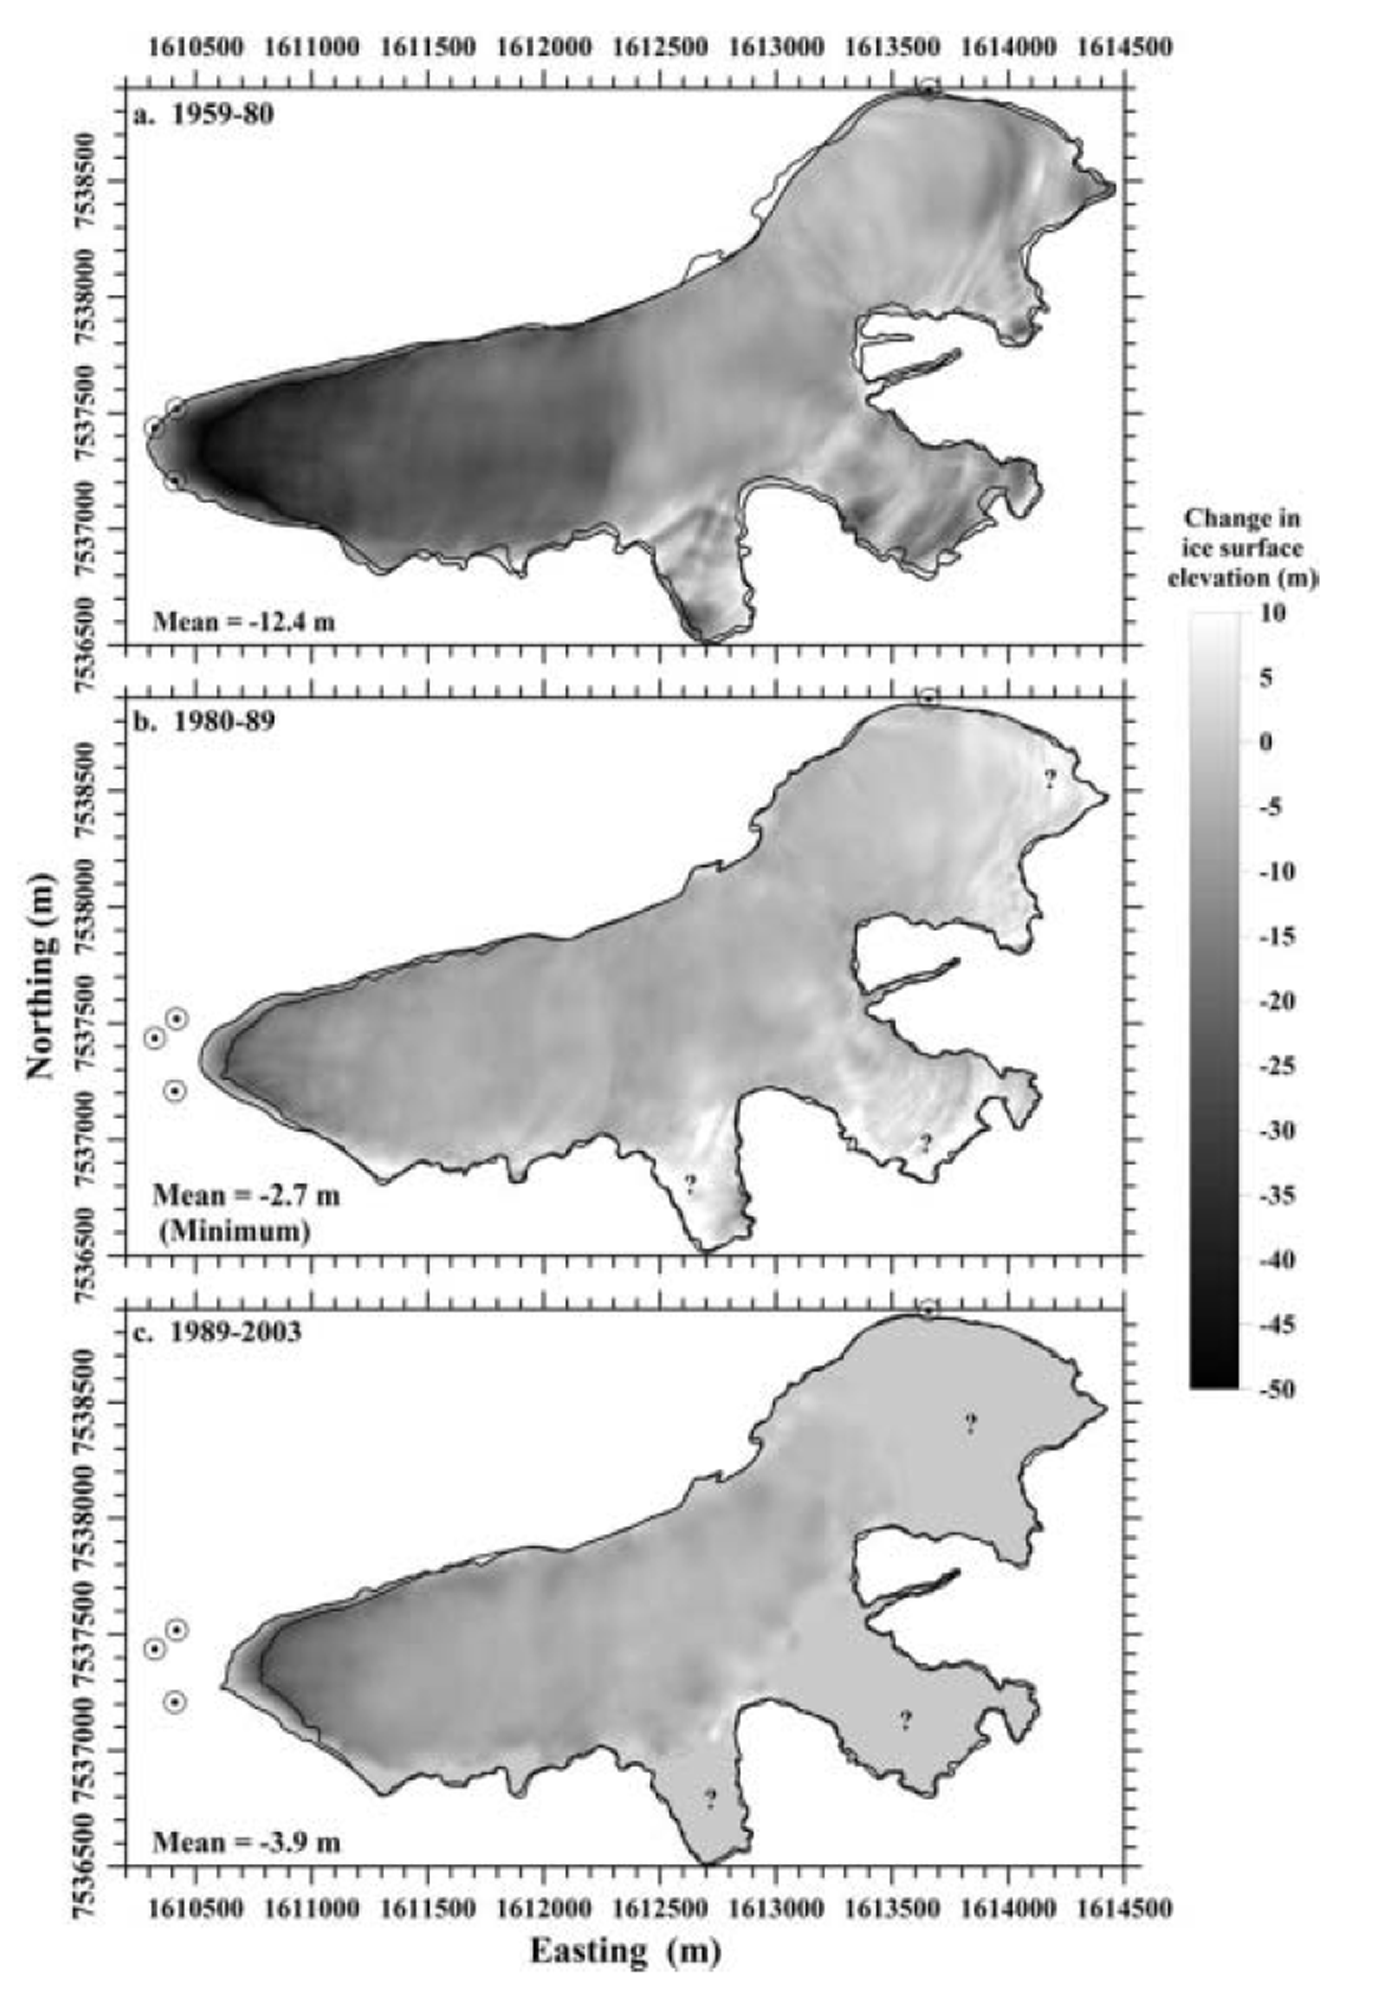
Figure 5 indicates thickening of a few areas of the glacier, but the total positive volume change calculated for the interval 1959-80 is only 1.8 × 10⁶m3 . Given that most of the thickening is indicated where there are differences in glacier boundaries and that this positive volume is small (well within the uncertainties), we believe it is either not real or not significant.
After 1980, the glacier’s volume decreased at a rate of ∼1.1 × 10⁶ m3 a-1 , so that by 1989 the total volume loss was (10.4± 7) x 106m3 and its area reduced by 7.1 × 1 0 4m2 . The large uncertainty in the volume change results from both that in surface elevations and the brevity of this interval. Of greater concern is the thickening (mean of 4.7 m) in the tributary cirques and the upper reach of the main valley (Fig. 5b). We believe this to be largely an artifact of the rotation in the 1989 map that was not wholly removed by warping during georeferencing, the effect of which would be to introduce a false thickening in these areas, especially in the tributary cirques. If in reality no significant thickening occurred in these areas, the magnitude of volume loss for the 1980-89 interval could be as much as 15.3 × 1 0 6m3 , or more if thinning had occurred.
To investigate this problem further, we used the mean specific net mass balance for 1981-89 (about −0.30 m w.e.) as that for 1980-89. (Systematic mass-balance measurements on Rabots Glaciär began in 1981.) Total mass loss estimated in this way is ∼10.4 × 10⁶ m3 w.e. To convert from mass to volume we follow Reference Sapiano, Harrison and EchelmeyerSapiano and others (1998) and assume a mean density for the surface layer of 795 kgm–3, weighted proportionally to the areal distribution of snow (typically 550 kg m–3) and ice (900 kg m–3) given by the mean equilibrium-line altitude (ELA; ∼1480m). This yields a volume loss of ∼13.1 × 10⁶ m3.
For the 1980-89 interval,
was estimated to be -2.7 ± 1.9 m on the basis of changes in mapped elevations. However, based on the foregoing mass-balance approach, we believe this is a minimum estimate and
could have been as much as -3.5 m for this interval.
Between 1989 and 2003, an additional (14.4 ± 7) × 106m3 was lost at a rate of 1.0 × 10⁶m3a–1. Again the rather large uncertainty is associated principally with those in surface elevations. Changes in the glacier during this interval were such that
was − 3 .9 ± 1.9 m and ΔA about -5.4 × 10⁴m2 . We evaluate our assumption that little change has occurred in the areas unsurveyed in 2003 using mass balance in the manner described above. The mean specific net balance for 1989-2001 is -0.20 m w.e. (mass-balance data for the balance years 2001/02 and 2002/ 03 are unavailable at this time). Assuming again that this closely approximates the mean specific net balance for 1989-2003, mass loss for this interval is estimated to be ∼10.4 × 10⁶m3 w.e. The mean ELA of ∼1360m implies a mean density of 720 kg m–3, from which a net volume loss of 14.5 × 10⁶m3 is calculated. Based on the similarity of the two estimates of volume change, we conclude that no significant changes have occurred in the tributary cirques and the upper reach of the main valley between 1989 and 2003.
An estimate for volume changes, 1910-59
The change in the volume of Rabots Glaciär from 1910 to 1959 was estimated using an empirical relationship between changes in the glacier’s surface area, ΔA, and those in volume, ΔV. The extent of the glacier in 1910 and its associated ice margins are well documented by a series of photographs taken by F. Enquist. The Enquist photos provide multiple views of the entire glacier, and in sufficient detail to determine former ice limits to within a few meters using known landmarks (e.g. bedrock outcrops and features, uniquely shaped boulders) and comparisons with photos taken in the years 1982-84. On this basis, the aerial extent of the glacier in 1910 is estimated to be ∼4.57 × 10⁶ m2.
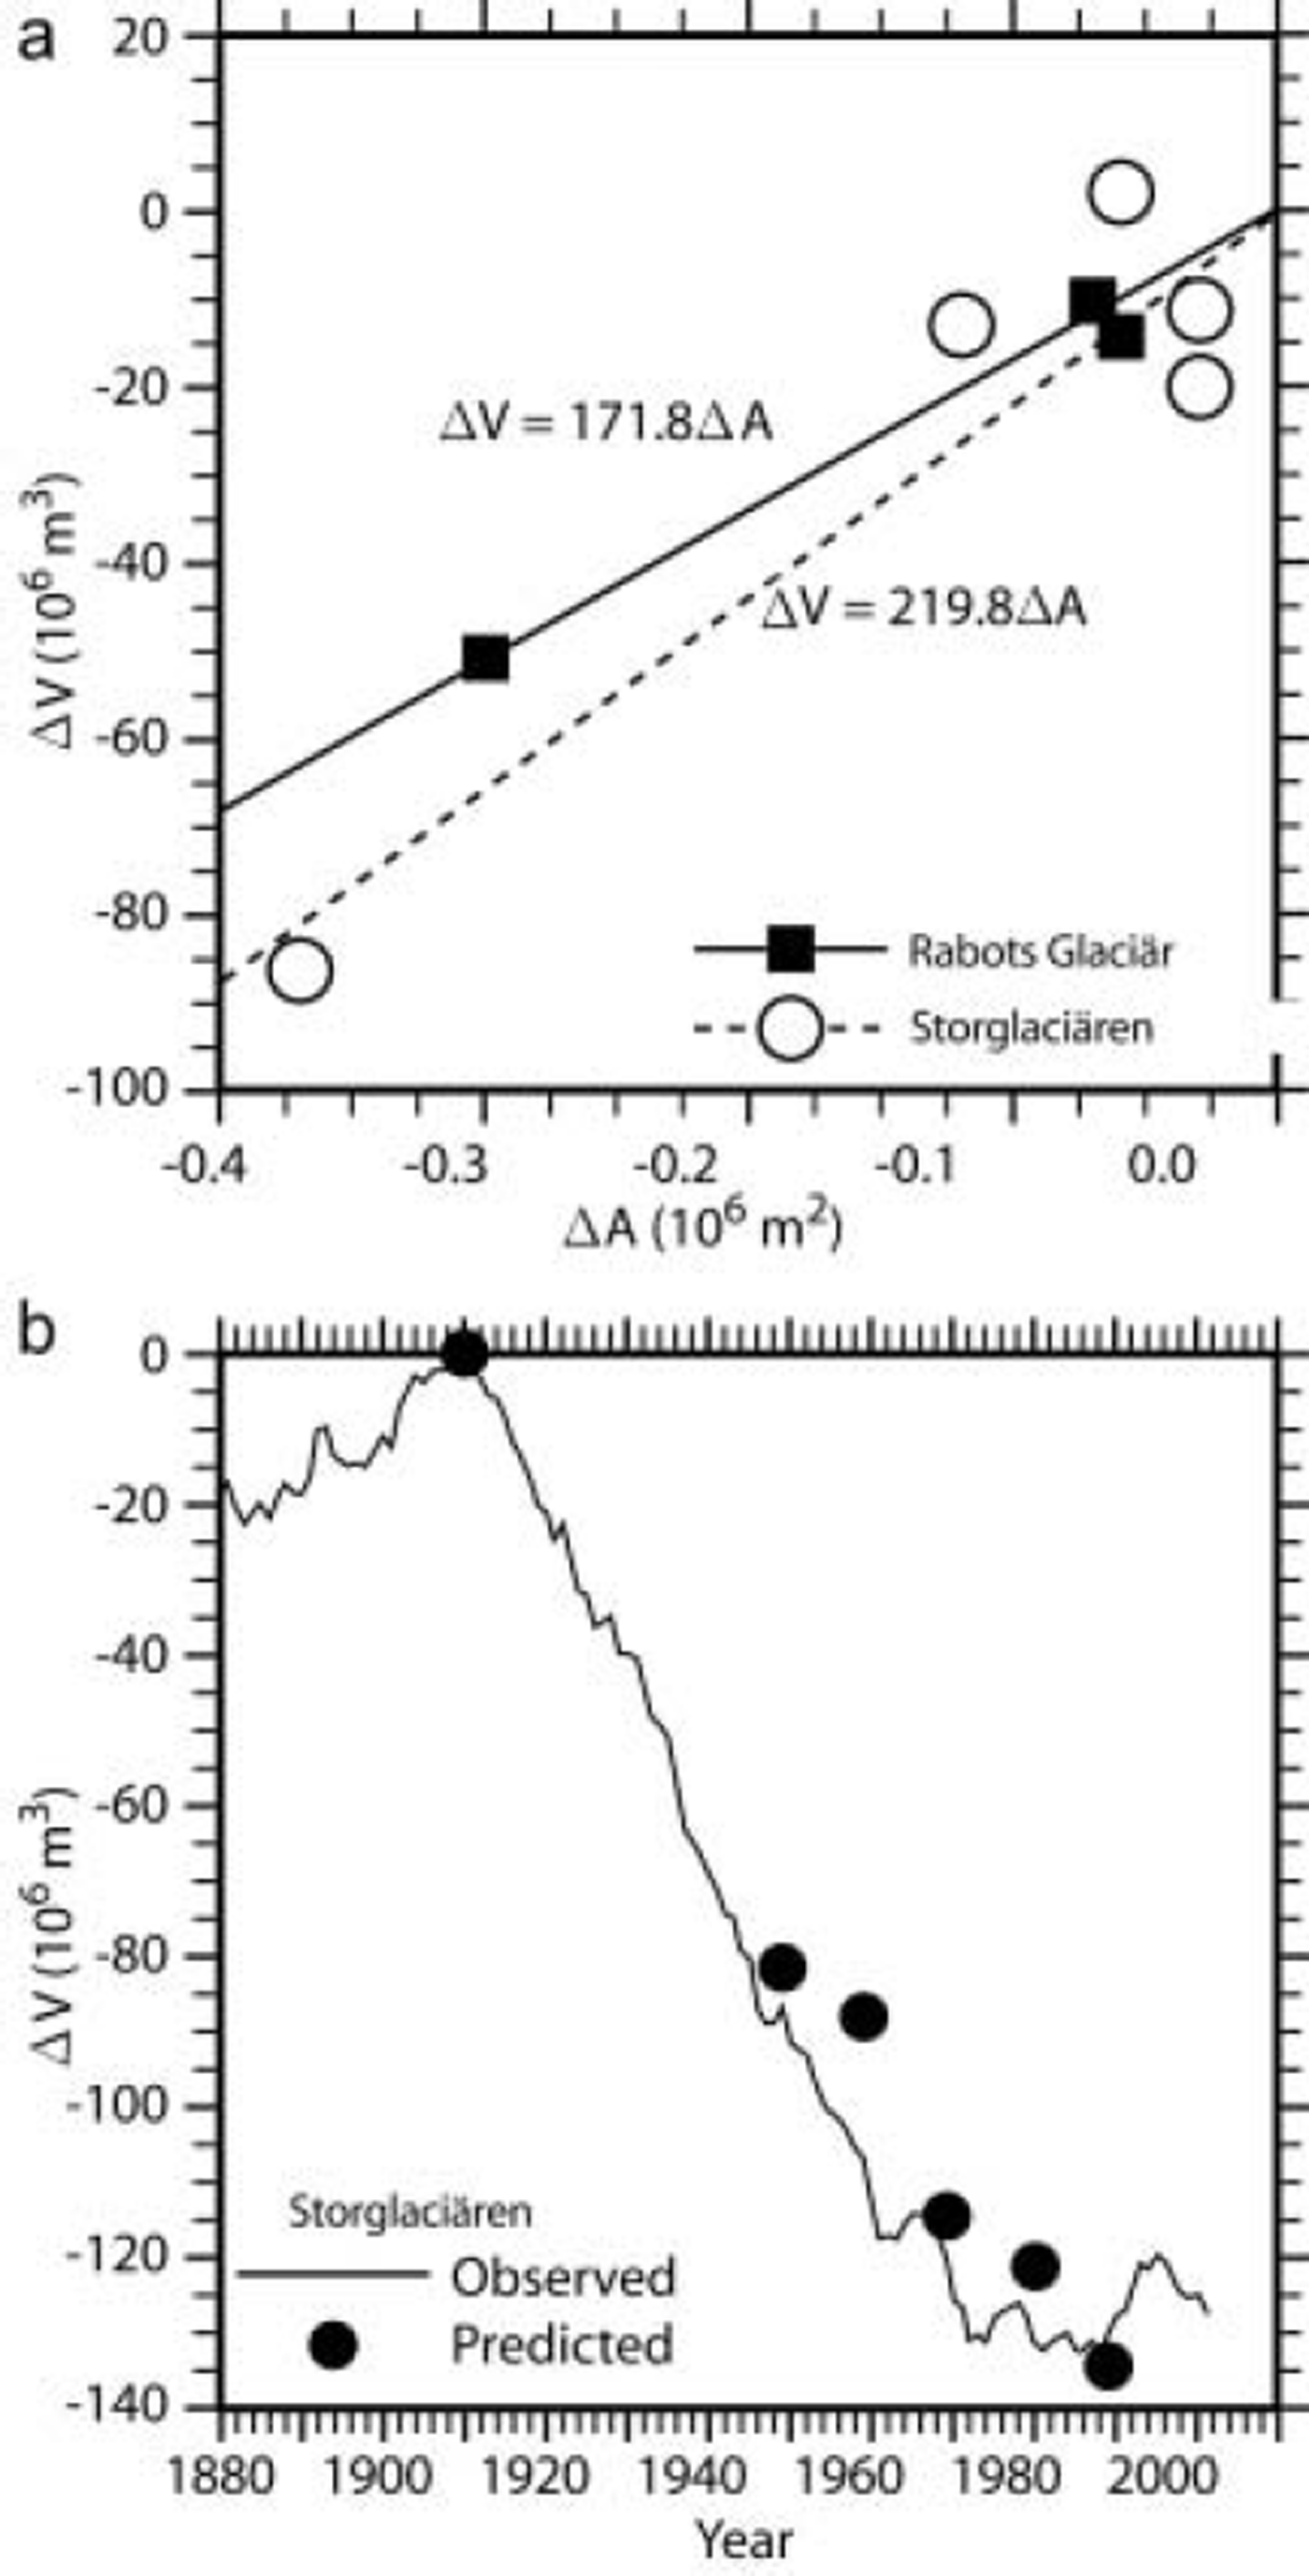
The correlation between known Δ A and ΔV for Rabots Glaciär is shown in Figure 6a. Although the dataset is limited to three points, the correlation is significant at the 95% confidence level. To assess the robustness of such a relationship, a similar correlation (Fig. 6a) was performed for Storglaciären using known values of ΔV (explained subsequently) and Δ A (Reference HolmlundHolmlund, 1987; unpublished reports) (Table 1). Again the statistical significance of the regression is very high (n = 5; r2 = 0.92; p< 0.001). This can be seen better in Figure 6b where values of ΔV for Storglaciären, predicted using ΔA, are compared with ‘observed’ variations in glacier volume. The latter are taken from Reference HolmlundHolmlund (1987) who calculated cumulative mass (hence volume) variations using a measured mass-balance series for the interval 1946-86 and a reconstructed mass-balance series prior to 1946. The record was extended to 2002 by including more recent mass-balance measurements. (It bears mentioning that based on a map analysis similar to that presented here, Reference HolmlundHolmlund (1987) concluded that the cumulative mass balance accurately represents mass changes of Storglaciären.) Volume changes based on ΔA agree reasonably well with the observed record of volume changes.
(a) Correlation of volume changes with changes in glacier length and area for Rabots Glaciär and Storglaciären. (b) Observed volume changes for Storglaciären compared with those predicted using the relationships shown in (a).
Changes in glacier area and volume for Rabots Glaciär and Storglaciären and derived changes in mean thickness
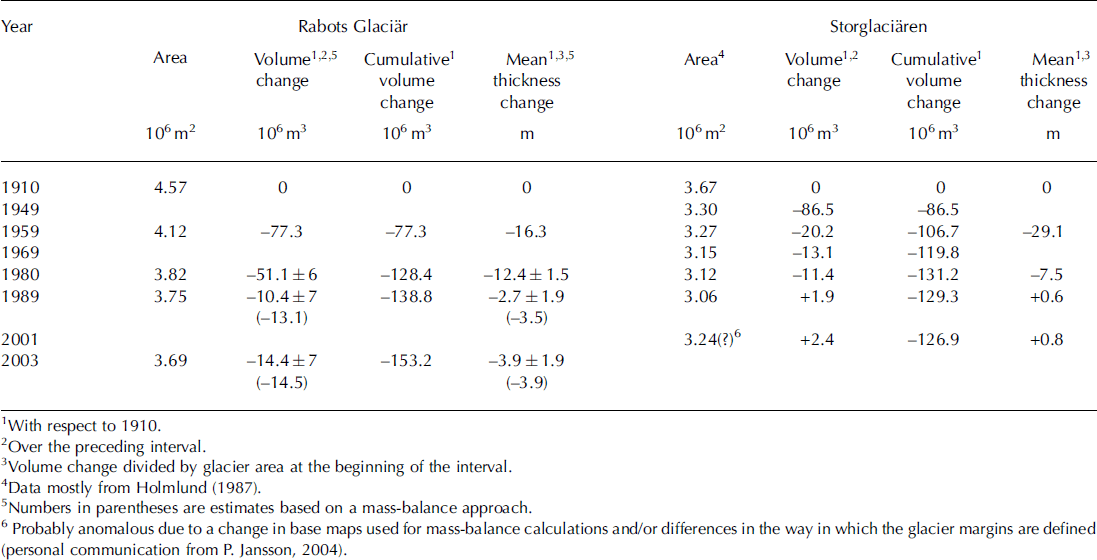
Given this success, the volume change on Rabots Glaciär between 1910 and 1959 is estimated to be 77.3 × 10⁶m3, based on a value for Δ A of -4.5×10⁵m3 . The rate of volume change over this interval would have then been -1.6 × 10⁶m3a–1. The glacier would have also thinned by an average of 16.3 m. (Only slightly different results are obtained when substituting the volume change suggested by the mass-balance analysis for the 1980-89 interval.)
Comparison With Storglaciären
Ice retreat
The retreat of Rabots Glaciär and that of Storglaciären are compared in Figure 2. While the behavior of a glacier’s terminus might be the most obvious manifestation of its reaction to climate change, factors other than the glacier’s dynamic response can influence the observed behavior of the terminus. These include local energy and mass balances, catastrophic collapse of the ice margin, changes in local bed slope, and non-uniform retreat (particularly because of the accumulation of debris). Moreover, the dynamic response of a glacier’s terminus is particularly sensitive to local ice velocities (Reference NyeNye, 1960; Reference Jóhannesson, Raymond and WaddingtonJόhannesson and others, 1989). Thus, direct detailed comparisons of terminus behaviors can be complicated by the inability to deconvolve those behaviors into precise longer-term dynamic and shorter-term nondynamic components.
In light of the foregoing, some caution must be exercised when inferring the dynamic response of Rabots Glaciär and Storglaciären based on their records of retreat. Nevertheless, the very disparate behaviors of the glaciers’termini shown in Figure 2a suggest that: (1) Storglaciären reached at least a transient equilibrium with the existing climate (with due consideration of more recent warming and/or other climate trends) by the 1980s, while Rabots Glaciär remains significantly out of equilibrium and continues to retreat in response to the early-20th-century warming; and therefore (2) the response time of Storglaciären might be inferred to be shorter than that of Rabots Glaciär.
Storglaciären’s initial rate of retreat and the quickness with which it achieved its maximum rate of retreat also indicates its greater climatic sensitivity. Figure 2b shows that the maximum rate of retreat for Storglaciären occurred during the period ∼1945-50. The anomalous 1933-46 peak notwithstanding (it is evident in the Storglaciären record as well), maximum rates of retreat for Rabots Glaciär were not attained until decades later. Finally, we note the ‘peakedness’ in the time distribution of retreat rates for Storglaciären, as opposed to the broader ‘plateau’ for Rabots Glaciär.
Thickness changes
The magnitude, timing and rate of ice-thickness changes on the two glaciers have also been different (Fig. 7). The calculated mean change in thickness on Storglaciären from 1910 to 1959 is about -29.1 m (Table 1), about twice that estimated for Rabots Glaciär. In general terms, the ablation area of Storglaciären thinned between 1959 and 1980, while the surface of its accumulation area remained unchanged (Reference Holmlund, Karlén and GruddHolmlund and others, 1996). There was a net thinning, however, on the order of 7.5 m, but this was considerably less than that experienced by Rabots Glaciär (Table 1). In the following decade, Storglaciären’s ablation area experienced little change, but more significantly, parts of the accumulation area thickened by as much as 10m (Reference Holmlund, Karlén and GruddHolmlund and others, 1996). As a result, the glacier thickened an average of about 1 m during this time, whereas the net thinning on Rabots Glaciär was 2.7 m or more (Table 1). After 1990 there was a general increase in ice thickness in the ablation area of Storglaciären as well (Reference Holmlund, Karlén and GruddHolmlund and others, 1996). Consequently, between 1989 and 2001 the glacier thickened by another ∼1 m. During the same time the surface of Rabots Glaciär lowered by ∼4m. In fact, we cannot say with any certainty that any significant thickening occurred on Rabots Glaciär for any of the intervals under investigation.
Mean surface elevation (thickness) change and rate of change of glacier surfaces.
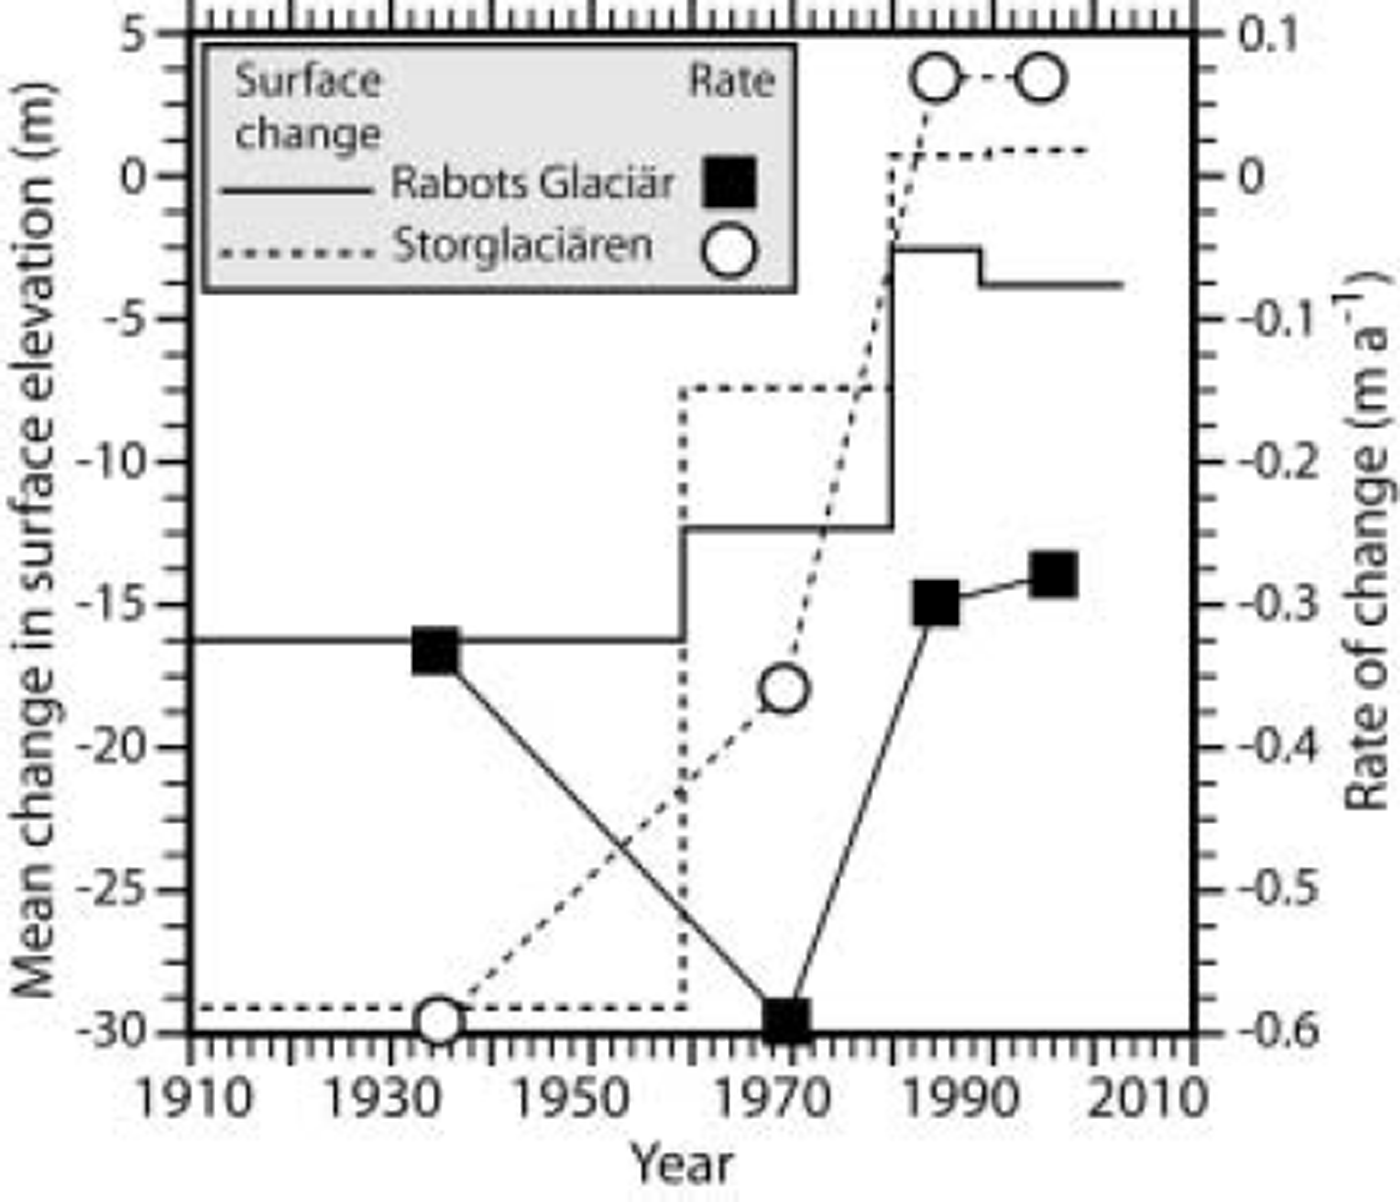
The calculated mean decrease in ice thickness on Storglaciären for the period 1910-2001 is on the order of 35 m. Over essentially the same period, the mean lowering of the surface of Rabots Glaciär was at least 35 m and will likely increase substantially as the glacier continues to retreat. Inferred variations in the time rate of change in
over this interval (Fig. 7) are also very different for the two glaciers. For Storglaciären, a consistent transition from a rapid rate of thinning to slight thickening is obvious. In contrast, thinning rates have been more variable on Rabots Glaciär. Most notable is the pronounced increase in the rate of thinning centered on the 1959-80 interval.
Volume changes
Volume changes on Rabots Glaciär for the period 1910-2003 are compared with those on Storglaciären in Figure 8. The general trends on Storglaciären mirror those in its retreat, in that there is a systematic decrease in volume (and, by inference, in the rate at which this decrease occurs) until about the late 1970s. By that time, Storglaciären had reached quasi-equilibrium, at least with respect to mass changes, as was noted by Reference HolmlundHolmlund (1987, Reference Holmlund1988). Increased winter accumulation over the last decade has led to a small increase in glacier volume. As of 2001 the total volume change from the 1910 configuration is estimated to be about -126.9 × 10⁶m3.
Volume changes for Rabots Glaciär and Storglaciären, 1910– 2003. Also shown are volume changes for Rabots Glaciär predicted using its dependence on area changes shown in Figure 6a. Uncertainties in the 1980, 1989 and 2003 data points reflect uncertainties in individual glacier surfaces.
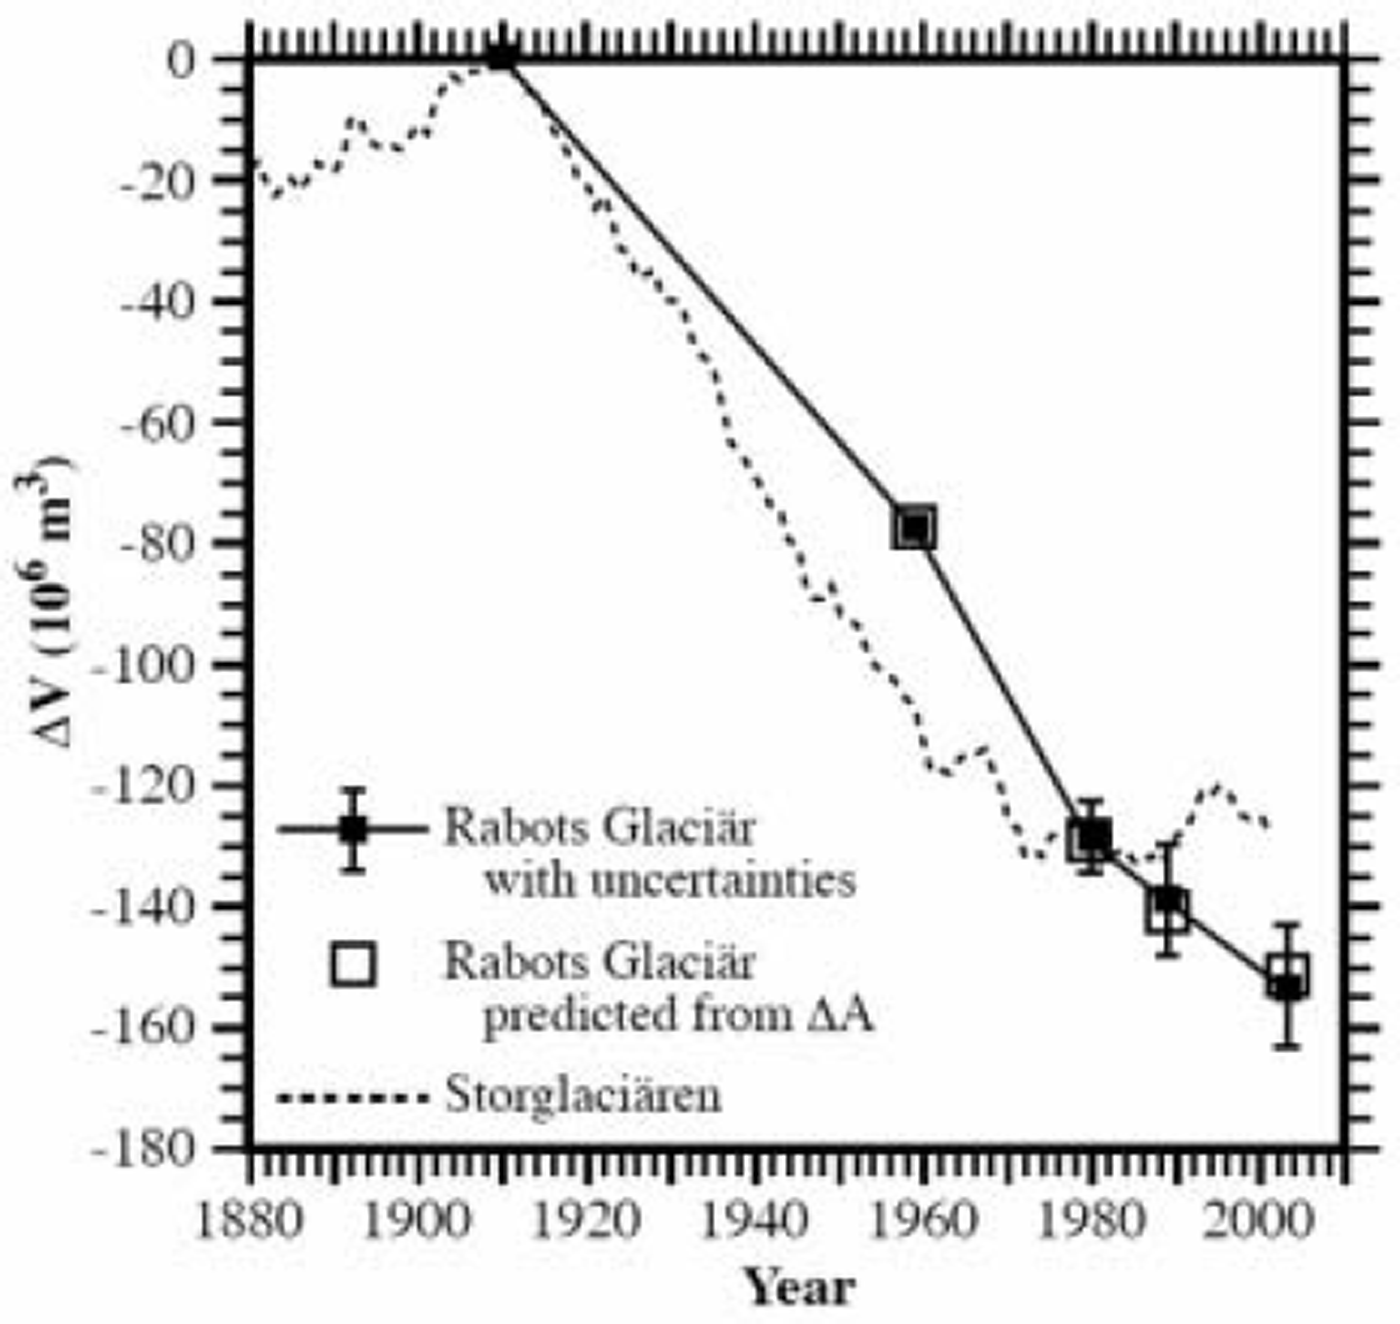
Conversely, Rabots Glaciär has consistently lost volume over the last century. Moreover, this loss appears to have occurred less systematically (Fig. 8). While the period of largest rate of volume loss on Storglaciären was 1910-59 (more specifically 1933-43 (Reference HolmlundHolmlund, 1987), also coinciding with very warm temperatures), on Rabots Glaciär it was 1959-80. This delay might again suggest Storglaciären’s greater sensitivity and therefore quicker reaction to a change in climate. Since 1980, volume loss on Rabots Glaciär has continued at a more-or-less constant rate (with due consideration of uncertainties) of ∼1.0×10⁶m3a–1. Total volume change on Rabots Glaciär during the period 1910-2003 is estimated to be about -153.2 × 10⁶ m3.
Conclusions
This study suggests that the geometry of Rabots Glaciär continues to adjust in response to a climatic warming that occurred at the beginning of the 20th century. The magnitude of ongoing changes in glacier length, volume and derived ice thickness implies that it is far from being in equilibrium with the existing climate. On the other hand, Storglaciären achieved steady state, albeit briefly, during the late 1970s and early 1980 when, respectively, its mass remained relatively constant and its terminus position stabilized. Therefore our results demonstrate the non-synchronous behavior of Rabots Glaciär and Storglaciären in response to early-20th-century warming. Moreover they are consistent with results from numerical modeling (Reference BruggerBrugger, 1992) that suggest a longer response time for Rabots Glaciär.
It is tempting to estimate a response time for Storglaciären on the basis of changes in glacier length and volume. Defined as the time required to essentially complete a response to a given climatic forcing, the observed response time would be on the order of ∼70years for Storglaciären and, from the modeling of Reference BruggerBrugger (1992), ∼140years for Rabots Glaciär. However, this is predicated on the assumptions that (1) the glaciers were essentially in steady state when they began to react to the earlier warming, and (2) their behaviors have not been unduly influenced by other, later climatic forcings (cf. Reference Raper, Briffa and WigleyRaper and others, 1996; Reference StroevenStroeven, 1996). We cannot say how post-1910 climatic variations might be manifest in the changes reported here for Rabots Glaciär. On the other hand, we can speculate about a scenario in which the glacier had not fully completed its last LIA advance. Most probably this would have delayed the onset, or lessened the effects, of its response to the 1910 warming event. This could explain why maximum retreat rates and volume changes of Rabots Glaciär lagged behind those of Storglaciären, as well as its continued retreat. Given its more immediate response to the later increase in temperature, Storglaciären would have had to be closer to its LIA steady-state configuration. This furthermore implies that it would have responded more quickly to those climatic parameters that forced LIA advances. Thus in any case, Storglaciären has a shorter response time than Rabots Glaciär.
Acknowledgements
The University of Minnesota’s Undergraduate Research Opportunities Program provided funding for two of the authors’ (K.A.R. and M.F.W.) participation in this research. Funds from the University of Minnesota’s Office of International Programs for helicopter support are gratefully acknowledged. Additional financial support for this study was provided by grants from the Educational Development Program and Center for International Programs at the University of Minnesota, Morris. A. Paquette assisted with fieldwork in 1998. M. Olson assisted in digitizing glacier surfaces. Very special thanks are extended to staff and scientists at the Tarfala Research Station for their valued assistance and contributions, particularly P. Jansson, P. Holmlund and M. Nyman. A. Glazovsky and F. Navarro provided helpful comments on the manuscript.



