

INTRODUCTION
The 2013 Kenyan general election, for all its other flaws, had one of the lowest levels of politically motivated violence of Kenyan general elections in the past 20 years, with the notable exception of 2002 (Ruteere & Wairuri Reference Ruteere, Wairuri, Njogu and Wekesa2016). The peaceful nature of the 2013 elections was due to a combination of political and social factors, which included concerted efforts by several parties to keep the peace: among them the NGO sector, donors, the government of Kenya (GoK), the media and citizens. These peacekeeping efforts included a heavy police and military presence. Further, multilateral NGOs, donors, the GoK and the Kenyan media itself promoted a sustained, intense media effort intended to promote a message of peace and non-violence ahead of the elections (e.g. Brown & Raddatz Reference Brown and Raddatz2014). Finally, in the run up to March 2013, the GoK implemented a system of heavy regulation and even censorship of information and communication technologies.
This paper explores the steps that the GoK took in an effort to minimise ‘hate speech’ during the 2013 election. This study also investigates the following research question: did state, donor and NGO efforts to promote peace and regulate information communications technologies (ICTs) in the Kenyan general elections of March 2013 reduce hate speech? This study examines political communication between voters and other citizens over SMS in the days right before the election, the day of the election and the days immediately following the election. As a caveat, this study recognises that significant amounts of speech occurred in other forums including in person, online, and in the media. However, this study focuses more narrowly on the use of text messaging (short message service or ‘SMS’) in the 2013 general election in Kenya. This paper argues that in 2013, citizens used SMS communication – which includes both discourse and dialogue – over cellular telephony to communicate a variety of political ideas including encouraging voting, providing information about candidates, promoting ‘peace speech’, discussing issues related to security and intimidating other voters.
This study makes an empirical and analytical contribution to the literature in political communication, comparative political science, African area studies and law. An emerging body of research, as will be described below, examines the impact of the Internet on organising and protests. However, scholarly work on the role that electronic media plays in politics on the African continent is limited (see Sambuli et al. Reference Sambuli, Morara and Mahihu2013; Benesch Reference Benesch2014a: 11). Studies on the use of information technology, including radio, social media and cellular telephony in elections are particularly rare in the African context. Accordingly, this study fills a gap in both data and analysis in communication studies, comparative politics and African studies, particularly as the use of information technology gains ascendancy in politics globally.
As Michelle Osborn has noted (Reference Osborn2008), commerce in political rumours and spoken political speech in English, in Sheng, in Kiswahili, and in the vernacular are crucial to Kenyan political discourse. She has documented the important role which political jokes, conversations, debates, discussions, and even arguments about politics played in the 2007 election, and reminds us that such debates occur in open spaces such as Kamkunji in Kibera, in bars, in matatus (low cost private transport), in private homes, in stores, and in crowds of people waiting to vote. This study does not attempt to measure such verbal speech, although it is undoubtedly important. For example, the National Commission for Integration and Cohesion (‘NCIC’) decided to send monitors during the 2013 election cycle to observe political rallies in an effort to limit hate speech by politicians.
In the run up to the 2013 election, the Government of Kenya adopted a hybrid censorship strategy that relied in part on regulation, in part on the presence of a strong security apparatus, and in part on the willingness of Kenyans to self-censor. These efforts to limit and censor speech may conflict with the free speech guarantees of the recently passed Kenyan Constitution. This approach to controlling political speech combined a mixture of regulation, requirements that telecommunications firms install specific software and hardware, and repeated public pronouncements designed to affect citizen behaviour. Further, the GoK created an extensive regulatory regime to deal with ICTs in the run up of the election. This regulatory framework had three key components: (1) eliminate the anonymity of subscribers to better allow tracking and (most likely) prosecution of hate speech; (2) force information service providers to employ sophisticated software and hardware that can assist in filtering information; and (3) cooperate with media houses to launch a pervasive peace campaign to reduce violent election-related behaviour.
This study finds that in terms of their SMS communications, Kenyan citizens cooperated in large part – but not completely – with state, NGO and donor supported efforts to limit political speech in a bid to achieve a peaceful election. This research documents significant breaches of the societal peace consensus in communication among voters. Voters, citizens and residents in Kenya used text messages to insult, offend, threaten and express contentious, as well as humorous, political speech. Interestingly, Kenyans used text messages to communicate politically despite repeated threats of fines and imprisonment from the full coercive force of the Kenyan state. The authors wish to emphasise one positive finding of this study: the vast majority of text messages documented in this study attempted to mobilise people to vote.
The GoK's efforts to control political communication during the 2013 election present a dilemma for policymakers, activists, civil society and scholars. Few people want to sanction or facilitate ethnically charged speech. A compelling argument can be made that reducing ‘hate speech’ had a beneficial impact on the 2013 election. Certainly, the Rwandan case (which resulted in genocide), as well as the case of the Kenyan election in 2007/2008 (which resulted in massive loss of life and displacement), demonstrate that hate speech can have a devastating effect on promoting genocide as well as interfering with free and fair elections. Yet, scholars and policymakers must also ask themselves what is the appropriate role for the government in monitoring or controlling both old and new media, and when do such efforts slide into censorship or even repression? This question of state controlled media during African elections becomes even more urgent in the face of efforts by President Yoweri Museveni to shut down social media and mobile money sites ‘as a temporary security measure’ during the Ugandan election of February 2016 (Daily Nation, 18 February 2016).Footnote 1
This paper is organised as follows. First, the paper explains the methodology used. The study then reviews the literature on the role of social media, the Internet and cellular telephony in elections and democratisation. The study then proceeds to discuss the efforts the Kenyan state made to reduce ‘hate speech’ and how these actions may have affected citizen communication during the election via SMS. After an analysis of the data the paper discusses further avenues for research, concluding with legal, policy and legislative recommendations.
METHODOLOGY
This study relies on a variety of data, both primary and secondary. Two large sets of original empirical data were collected from Kenyans in an attempt to answer the research questions.Footnote 2 The research team also reached out to a variety of government officials working in the media and information sector in an effort to document a variety of perspectives. Finally, one of the authors served as an accredited election observer during the 2013 Kenyan election.
Election Week Data
A research team organised by one of the authors interviewed over 100 citizens who had already voted, on the day of the election and the following week, using a structured questionnaire in both Kiswahili and English (Table I). The focus of the interview was voters’ use of technology during the election. Interviews were conducted as voters exited the polls. Although best efforts were made to speak to voters as they exited the polls, these interviews were nonetheless a convenience sample (Fowler Reference Fowler2008).
Data Sources Used in Analysis

Source: Authors’ description of various data sources.
In addition, during the election week, officials from five GoK ministries and one NGO involved with communications and media were invited to respond to a structured written questionnaire. Detailed responses were received from one high-ranking official from the Media Council of Kenya, and from one influential NGO involved in the protection of freedom of expression.
News reports by Kenyan media were also carefully scrutinised for references regarding hate and political speech. Relevant Kenyan regulations related to election speech were reviewed. All primary election week data was then coded, divided into themes and analysed.
Follow-Up Poll Data
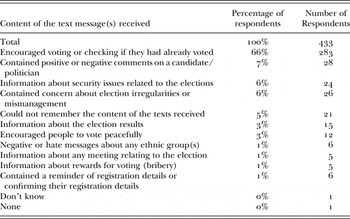
The election week interviews, along with a review of print sources, helped the authors determine what the most interesting research questions were. As a result, a follow-up of comprehensive poll data was collected from a sample of more than 2000 Kenyans approximately one year later focusing on two key questions (‘follow-up poll’). Although this poll was conducted after the election, citizens had a strong memory of their experience due to the significance of the event. Individuals were first asked a screening question: ‘If you can remember, did you receive any text message on the actual day of the election last year about the election or politics? That is, I am not asking you about any personal message.’ Of those sampled, 433 remembered receiving text messages about the election. Those persons were then asked to relay the major theme of that message and to characterise the messages they received into one of 13 categories (see Table II).
Content of election related text messages received on election day

Source: IPSOS Synovate.
CHARACTERISTICS OF THE DATA
Election Week Data
The election week data are well stratified by urban, peri-urban and rural observations as well as age. The data also exhibit a gender balance approaching that of the actual population. Interviews were conducted in ten Kenyan counties and 33 distinct constituencies. The election week interviews generated rich, accurate data on the details of text messages received, including the actual wording. Some interviewed citizens declined to tell us the content of text messages received, due to their offensive nature. Citizens were allowed to make their own determinations regarding which category messages fell into. Most shared the text messages verbatim, by writing down the messages they believed relevant, or reading them aloud, with the interviewers writing down the contents of the message as accurately as possible. Crucially this dataset allowed the authors to analyse the actual language of text messages that people received. The sample size on the election week interviews was limited. Accordingly, this data is suggestive, not definitive. Very little primary empirical research has been conducted on this question, however, and none that the author could find in Kenya. These data allowed the authors to generate grounded theory (Glaser & Strauss Reference Glaser and Strauss1967; Crooks Reference Crooks2001; Charmaz & Belgrave Reference Charmaz, Belgrave, Gubrium, Holstein, Mavasti and McKinney2012).
Follow-up Poll Data
After the initial election week interviews were analysed, questions were made more precise for the follow-up poll. The questions in the follow-up poll centred on text messaging. One of the authors commissioned a poll by a well-known Kenyan polling firm, which allowed examination of the responses of a representative and statistically significant sample, n > 2000. People were interviewed in every Kenyan county, and in every (former) Kenyan province. The sample included individuals from age 18 to 45+, all major religions including Catholic, Christian, Evangelical, Muslim and Other, and most major ethnic groups, including Bajun, Borana, Burji, Embu, Gabra, Galla, Kalenjin, Kamba, Kikuyu, Kisii, Kuria, Luo, Luyha, Maasai, Mbeere, Meru, Mijikenda, Nubian, Pokot, Somali, Swahili, Taita, Taveta, Teso, Tharaka, Turkana and those who identify their ethnic group as ‘Kenyan’. The sample included members of different education and income levels as well.
The polling firm used three stages to collect the data. First, the polling firm distributed the sample at the regional level stratified by rural and urban strata using 2009 Kenya Population and Housing census data, hence the use of former provinces. Then, for each region the polling firm selected primary sampling units (divisions or sub-counties) using probability proportion to population to size. In the third stage, the polling firm selected the secondary sampling units (the sub-location). Both the primary and secondary sampling units were selected using sampling intervals and random numbers, using Excel. At the end of the survey the polling firm weighted the results to correct any sample imbalance using post stratification weight with the main population parameter.
Decision to Focus on Text Messaging
After evaluating the interviews conducted during the week of the election, the research focus turned to text messaging for several reasons. First, around half of those interviewed in the week of the election received election-related text messages on the day of the election. Second, Internet penetration is not universal in Kenya. Third, cell phone usage is widespread in Kenya. Fourth, text messaging is very affordable. Finally, the authors found little empirical research on the use of cellphones during elections in Kenya.
In terms of Internet usage, the Communications Commission of Kenya (now the Communications Authority of Kenya) reported that the percentage of the Kenyan population with access to the Internet stood at about 41% at the end of 2012 (increasing from 28% in 2011) with an estimated 17·4 million users. Few Kenyans have access to their own computer. In addition, most rural counties do not have good Internet connectivity, nor do they have access to a constant electricity supply. Importantly, Internet connectivity relies on electricity to work, whereas cellular telephones generally utilise batteries, making them less susceptible to power outages. Most Kenyans obtain access to computers and the Internet at cyber-cafes or at work. Hence, a strong argument can be made that access to the Internet, and associated applications in Kenya tends to be the province of an urban elite.
By contrast, access to cellular telephony, and by extension, text messaging, is much more widespread in Kenya. Cellular telephone penetration rates in Kenya are extremely high and text messages are a widely used form of communication (Osborn Reference Osborn2008). At the end of 2012, the number of Kenyan mobile phone subscribers stood at over 30 million, with a 78% penetration rate (Communications Authority of Kenya 2014). Although some elites have smartphones – which would allow them to use the Internet on their phones – such devices are not commonplace in Kenya. Indeed, one reason that access to cellular telephony is so pervasive in Kenya is the affordability of basic handsets. In addition, communication over text messaging is extremely low cost, as low as one shilling per text message within a network, and two shillings across other networks. As a result of these facts, evaluating election-related communication over SMS appeared more fruitful, and more representative of the common Kenyan citizen than evaluating such communication over the Internet.Footnote 3 Finally, although the Umati project focused on election-related communication, particularly hate speech, on the Internet, limited empirical research has been conducted on hate speech over cellular telephony.
THE HISTORY OF KENYAN ELECTION VIOLENCE
The peacefulness of the 2013 election is worth reflection and comment by both social scientists and political analysts because Kenyan multiparty elections from 1992 to 2013 have been characterised by varying levels of politically sponsored violence, often in the form of ‘ethnic clashes’ (Klopp Reference Klopp2001; Barkan Reference Barkan2004; Roessler Reference Roessler2005). In highly contested elections, electoral violence may be a mechanism either to force ideological voters of the competing party to vote in their favour, or instead to prevent them from voting at all (Chaturvedi Reference Chaturvedi2005). Researchers have established that former Kenyan President Daniel arap Moi privatised violence in a bid to stay in power while also following donor demands for multi-party elections. In order to accomplish both goals simultaneously, Moi sponsored ethnic clashes around election periods beginning in 1992 (Roessler Reference Roessler2005). In 1992, at least 1,500 people were killed, and 300,000 displaced. Some observers noted that this earlier violence set in place the dynamics – the use of informal militias, hate speech and mobilisation based on exclusionary and nationalistic ideologies – that would lead to further violence. The 1997 election was characterised by communal violence and foul play (Barkan Reference Barkan2004). Violence escalated before and after multi-party elections in Kenya in 1997 (Klopp Reference Klopp2001). The KANU government under Moi created militias of local youth to engage in ethnic clashes, paying them for each person killed. This multi-ethnic violence was part of a strategy of derailment of the opposition (Klopp & Zuern Reference Klopp and Zuern2007). Strikingly, there were no ethnic clashes in 2002. Klopp and Zuern argue that this ‘state of peace’ occurred, in part, because President Kibaki may have promised former President Moi impunity for crimes under his rule. Other observers have noted that in the 2002 election both main candidates for president (Mwai Kibaki and Uhuru Kenyatta) were Kikuyu and were also both part of a powerful economic and political elite class with strong personal and political connections to each other. Kibaki had served under Moi, and Moi had served under Kenyatta's father. This line up of Uhuru Kenyatta versus Mwai Kibaki as presidential candidates in 2002 may have resulted, in part, from Moi's political calculation to have a peaceful election during his transition and one that ensured Moi's protection.
The Emergence of Hate Speech in Kenyan Elections
Older communication technologies, particularly radio, contributed to the genocide in Rwanda in 1994. In addition, hate speech over radio was a potent element in the Kenyan 2007/2008 elections and post-election violence, and had many characteristics in common with the Rwandan style of discourse, including using a narrative of outsiders (e.g. Mamdani Reference Mamdani2001). Local radio stations, often using the vernacular, broadcasted messages of hate and incited violence in the 2007/2008 Kenyan election crisis (Somerville Reference Somerville2011). Yet, a new technological element emerged as a factor in political discourse during the 2008 post-election violence. Citizens and voters are increasingly likely to communicate with new media during elections, including SMS, email and Internet applications such as Facebook (Cheeseman Reference Cheeseman2008). Further, new media increasingly play a role in disseminating political speech and campaign information very quickly to large groups of people (Howard & Parks Reference Howard and Parks2012).Footnote 4 As Michelle Osborn has noted, political rumours spread much more quickly with new technologies of communication (Reference Osborn2008). During the Kenyan election of 2007/2008, activists, citizens and vigilantes propagated hate speech by means of both old and new electronic media (radio, the Internet, SMS and television) (Goldstein & Rotich Reference Goldstein and Rotich2008). In 2007, militias organised over text messages. Calls to violence were made in the vernacular on indigenous FM radio stations and blogs encouraged score settling over land seizures (Africa Confidential 2008). Additionally, in the 2008 post-election violence crisis, text messages were used to instigate negative intra-group emotions (Osborn Reference Osborn2008; Sambuli et al. Reference Sambuli, Morara and Mahihu2013; Benesch Reference Benesch2014a) and mobile phones were inundated with hate messages on both sides (Dowden Reference Dowden2008; Etzo and Collender Reference Etzo and Collender2010; Somerville Reference Somerville2011). In particular, Osborn notes that ‘the use of SMS to incite violence transformed the mobile phone from a communications tool to a ‘weapon of war’’ (Osborn Reference Osborn2008).
In summation, Kenya has a violent and disturbing electoral past, which includes high levels of hate speech, an inflammatory political discourse and pervasive political violence following the 2007 election. As a response, Kenyan civil society, donors and the United Nations pushed for wide-reaching legal and institutional reforms, which may have contributed to the peaceful nature of the 2013 elections (Ruteere & Wairuri Reference Ruteere, Wairuri, Njogu and Wekesa2016). Kenya passed a new detailed and comprehensive constitution in 2010, which incidentally reinvigorated the Kenyan judiciary.
The Electoral Commission of Kenya, which failed in 2007, was reconfigured into the Independent Electoral Boundary Commission. The Commission of Inquiry into Post Election Violence led by Appellate Judge Philip Waki eventually led to the indictment of key political figures by the International Criminal Court (ICC). The decision by the ICC to prosecute high-profile figures including party leaders like Henry Kosgey, candidates Uhuru Kenyatta and William Ruto, as well as Kalenjin vernacular radio broadcaster Joshua arap Sang – who was personally accused of hate speech – may have acted as a deterrent to election violence in 2013 (Mueller Reference Mueller2014). Further, the surprising composition of the ‘Uhuruto’ Jubilee Alliance may have also suppressed election violence in the politically volatile Rift Valley, as those politicians believed it would be politically counterproductive (Lynch Reference Lynch2014).
In the end, the Kenyan election of 2013 was peaceful, but contentious. The election was determined to be free and fair by the European Union and the Carter Center, however, the election was marked by massive technological failures, which led many to challenge the validity of the final vote. Further, the IEBC took several weeks to release documents associated with the election, causing significant social discord in the period between the election and the Supreme Court decision. The vote was challenged by the opposition, but eventually upheld by a unanimous decision of the Kenyan Supreme Court in April 2013.
Although numerous legal, structural and institutional changes have pushed Kenya in a democratic direction during the period between elections, the GoK took some undemocratic steps in this period. Indeed, leading up to the 2013 elections, the Kenyan government sponsored unprecedented new levels of control on speech over electronic media and traditional media. In order to understand the significance of the GoK's actions, a review of what scholars know about the Internet, social media and cellular telephony in elections is warranted.
THE ROLE OF INFORMATION TECHNOLOGIES IN DEMOCRATISATION
There is a growing literature arguing that Internet communications can be used to enhance political connectivity, encourage political behaviour in individuals and facilitate collective action (Postmes & Brunsting Reference Postmes and Brunsting2002; Tolbert & McNeal Reference Tolbert and McNeal2003; Weber et al. Reference Weber, Loumakis and Bergman2003; Kelly Garrett Reference Kelly Garrett2006; Krueger Reference Krueger2006; Feezell et al. Reference Feezell, Conroy and Guerrero2016). New media have been used to facilitate organising by political groups, confront non-democratic governments (Xenos & Moy Reference Xenos and Moy2007), and to organise political protests against leaders (Shirky Reference Shirky2011; Tufekci & Wilson Reference Tufekci and Wilson2012).
However, information technologies do not always contribute to transparent and effective electoral processes. Governments can also use technology to enhance surveillance and control communication (Deibert & Rohozinski Reference Deibert and Rohozinski2010; Shirky Reference Shirky2011). Both authoritarian and democratic governments have endeavoured to control new media by means of regulations, software and hardware (Rodan Reference Rodan1998). More dramatically, authoritarian governments (including those of Egypt, Ethiopia, Sudan and Uganda) have gone so far as to shut off Internet, cellular telephony, Twitter, Facebook, regular telephony and television broadcasting in an effort to control protest and limit dissent (Golkar Reference Golkar2011; Etzo & Collender Reference Etzo and Collender2010; Bowman & Camp Reference Bowman and Camp2013; Daily Nation 2016).
Information technologies may actually make the political environment less stable and less predictable for both individuals and groups (Bimber & Davis Reference Bimber and Davis2003). Dale & Strauss (Reference Dale and Strauss2009) present impressive evidence that impersonal, noticeable messages, including SMS, increase the likelihood that a voter will make it to the polls, even if the voter and the messenger are not socially connected. Malhotra et al. (Reference Malhotra, Michelson, Rogers and Valenzuela2011) provide support for this finding, demonstrating that text messaging may be a key tool in voter mobilisation during elections.
THE INTERNET, SOCIAL MEDIA AND ELECTIONS IN AFRICA
Scholarship on the role of new media and information and communication technologies in African elections remains limited. The Umati Project was without a doubt the largest effort to date to monitor Kenyan hate speech online. Umati built on the success of the Ushahidi ProjectFootnote 5 and examined incidences of hate speech online (I-Hub Research 2013; Benesch Reference Benesch2014a).Footnote 6 For nine months (September 2012 to May 2013) Umati examined content from selected blogs, forums, online newspapers, Facebook and Twitter, collecting 5,683 examples of hateful speech (Benesch Reference Benesch2014a: 13). Additionally, vernacular content was also monitored.
The Umati report on online hate speech employed aspects of the Benesch dangerous speech framework, which is multifaceted and focuses on language that: targets a group of people; dehumanises the target; and contains a call to action such as a call to evict (Sambuli et al. Reference Sambuli, Morara and Mahihu2013: 26). The report stated that most Kenyans prefer to use English rather than vernacular when conversing online, and more than 90% of hate speech comments were drawn from Facebook, while Twitter contributed fewer than 5% (Benesch Reference Benesch2014a: 13).
In terms of scholarly research on new media in African elections, Catie Bailard conducted an important study preceding the 2010 presidential election in Tanzania. Using a control group of 65 people and an Internet group of 59 people (n = 124), Bailard found that access to the Internet negatively influenced citizen perception of election fairness (Bailard Reference Bailard2012). Bailard suggests that more research is needed to explore the subtle pathways through which information technology use may have a meaningful political impact. Chisango & Gwandure (Reference Chisango and Gwandure2011) assert that elections in Sub-Saharan Africa are characterised by ‘rhetoric and hate speech’ against opposition parties. Keith Somerville suggests that the Kenyan political discourse is inflammatory and often violent (Reference Somerville2011). Ligaga (Reference Ligaga2012) observes that the Internet in Africa in particular represents a relatively unmediated space of discourse, which is independent of mainstream media, and fairly free of state-centric control. Best & Meng (Reference Best and Meng2015) recently published an interesting paper on the role of Twitter in Kenya, Ghana and Nigeria in elections from 2011 through 2013, which found that Kenyan tweets were as likely to focus on tribal identity as campaign policy. While traditional media such as radio or print newspapers remain key, ideas of contentious speech and rapid distribution combine where SMS, cellular telephony, the Internet, and social media such as Facebook act as rapid avenues for the distribution of both ‘hate speech’ as well as ‘peace speech’.
KENYAN GOVERNMENT EFFORTS TO CONTROL POLITICAL SPEECH AND HATE SPEECH
As the millennium matures in its second decade, governments face a brave new world in the face of rapidly changing political communication and citizen behaviour. Newer information technologies throw a wrench into government efforts to reduce or eliminate political speech because they are much more difficult to regulate and censor than traditional print or broadcast media. Governments can employ several methods to prevent people from engaging in political communication, or indeed, to allow it. On the one end, political communication can be encouraged, with light requirements to hold protests or gatherings, such as getting a permit to hold a march. Alternatively, governments can attempt to prohibit political communication by preventing large gatherings, as occurred in Turkey in 2013.Footnote 7 Newspapers can be censored and television broadcasts can be tightly controlled, as is the norm in countries such as China, Myanmar and Iran. As a result, repressive governments – including Libya, the Sudan, Syria and the Egyptian government – have taken some extreme measures to control political communication over electronic and social media, including blocking Twitter and Facebook, and even shutting off cellular telephony and the Internet (Bowman & Camp Reference Bowman and Camp2013). Most recently, in the February 2016 Ugandan election, President Museveni shut off social media temporarily.
Kenya used a slightly softer approach. Under the Kenyan Information and Communications Regulations of 2012, service providers were ordered under article 4 (c) to ‘register users of its system, keep a record of all registrations of subscriptions made, and provide a copy of this record to the regulator upon request by the Commission’.Footnote 8 The registration process requires address details, and production of an ID from residents or a passport from aliens in order to receive the sim card required to use a cellular phone in Kenya. Although larger Information Service Providers (ISPs) such as Safaricom and Airtel comply, compliance is not perfect, and smaller providers such as YU do not maintain an effective registration system. This approach registered a large number of cell phone users, but undoubtedly left a large minority of cell phone users unregistered. According to Reuters, Kenya ordered that all lines that could not be traced to a known user be de-registered in an effort to discourage people from sending out provocative texts.
In March 2012, about 10 months before the election, Kenyan ISPs were directed by the GoK to install hardware that would eliminate anonymity of e-mail senders and other web users by December 2012. This effort was pitched by Michael Katundu, acting director for Information Technology at the CCK as critical to the ‘war against terror’ (Kagwe Reference Kagwe2012). However, in the authors’ view it is more likely that this software was, in part at least, a way of monitoring political messages in preceding Kenya's general election. In March, the CCK demanded that mobile operators install the Network Early Warning Systems (NEWS), an Internet traffic monitoring tool. This allowed the CCK to monitor both incoming and outgoing email traffic ‘in an effort to detect and facilitate responses to possible cyber threats’ (Business Daily, the Standard 2012).
Internet service providers protested that this software requirement was in breach of Article 31 of the 2010 Kenyan Constitution, which grants citizens the right to privacy, including a clause preventing infringement of ‘the privacy of their communication’. Prominent Kenyan lawyers also protested. Paul Muite asked that the Kenyan government seek a court order before installing the sensors. According to Citizen Lab, other countries that have employed such domestic surveillance tools include Afghanistan, Bahrain, China, India, Indonesia, Iraq, Kuwait, Lebanon, Malaysia, Nigeria, Qatar, Russia, Saudi Arabia, South Korea, Singapore, Thailand, Turkey and Venezuela.Footnote 9 The fact that Kenya is on this list suggests that the Kenyan state currently values security and surveillance over citizen privacy and freedom of expression.
Safaricom (a major mobile telephony provider and information service provider in which the Kenyan government has a significant number of shares) issued guidelines in June 2012 for political mobile advertising aimed at reining in negative political messages nearly nine months ahead of the general election. In September 2012, the CCK issued similar guidelines. Political text messages were limited to English and Swahili (BBC News 2013). Politicians had to send bulk campaign messages for screening through their mobile operators 48 hours in advance.
By February 2013, one month before the election, the NCIC flagged key vernacular words in Kikuyu, Luo and Kalenjin. The NCIC expressed a concern that those communities in particular, who were implicated in the 2007 electoral violence, might use SMS to insult each other (The Star, 13 February 2013). Key words such as ‘thief’, ‘uncircumcised’, ‘dog’, ‘monkey’ and other animal phrases used in political contexts were expressly flagged by the NCIC, because these phrases had been widely used during the 2007/2008 election violence (Capital FM, 7 February 2013). Those found guilty of ‘fanning hatred through text messages’, faced fines of up to $56,000 or three years in jailFootnote 10 (BBC News, February 2013). Warning notices were sent in February to as many as 30 bloggers.
Further, the NCIC closely monitored political campaigns. For example, government sponsored NCIC field officers went so far as to attend political rallies to monitor what was said, and warning those they believed were guilty of incitement (Africa Research Bulletin 2013). Further, the independent Media Council of Kenya, created by Constitutional article 34(5), monitored radio stations, TV channels and newspapers round the clock to keep track of ‘retrogressive utterances’ (BBC News February 2013). Former Permanent Secretary for Information and Communications Dr Bitange Ndemo reported that cell phone service providers blocked 300,000 hate speech texts per day to prevent a repeat of 2008 post election violence. In the authors’ view, this is somewhat unlikely, as it would have strained the capacity of the providers. However, Ndemo's comments may have been aimed to ensure that Kenyan citizens were aware of the coercive power of the Kenyan State. Hate speech expert Susan Benesch terms approaches such as blocking access to SMS and the Internet, or prosecuting inflammatory speakers as ‘punitive or censorious’ (Benesch Reference Benesch2014b: 4).
The final step in controlling political communication was a massive media campaign by both the GoK and mainstream media promoting peace. As the BBC aptly noted, ‘a media blitz of tolerance’ flooded the airwaves (BBC News, 26 February 2013). The Luo vernacular radio Ramogi FM hosted peace road shows and the Kalenjin-language radio station KASS FM – which was previously implicated in hate speech – played songs calling for peace and cohesion. Even the General Services Unit, the elite Kenyan military unit comparable to the Marines special forces, released a song called Mungu Baba (God is our father) in conjunction with the Kenya Symphony Orchestra highlighting ethnic and gender diversity and praying for peace. Artist Solo Muyundo painted the words ‘Peace Wanted Alive’ on a sidewalk in Kibera (Benesch Reference Benesch2014a). Donors got involved as well. A USAID/Mercy Corps funded project ‘Yes Youth Can’ created coding which allowed Kenyan subscribers to post directly to the project's peace oriented website via SMS (Docksai Reference Docksai2013). UNICEF sponsored a Kenyan patriotic peace song, ‘Amani’ by Boma, which featured photos of young people of different ethnicities, possibly located in Kibera, holding signs saying ‘Amani’ meaning peace in Kiswahili. Indeed, Nation journalist Murithi Mutiga aptly termed this massive nationwide multi-sectoral effort ‘the peace industry’ (Benesch Reference Benesch2014a). A high-ranking Kenyan working at a multilateral NGO dedicated to freedom of information informed the authors that the ‘media combined efforts with peace organisations in getting out messages’ (Media NGO official, int., 28 June 2013). Seen as a whole, this sustained and concentrated effort to focus on peace preceding the election appears to have had the effect of suppressing contentious speech, at least for the period immediately before and after the election.
ANALYSIS OF FREQUENCY OF TEXT MESSAGES BY DEMOGRAPHIC GROUP
Both sets of data collected for this study indicate that communication via SMS about the Kenyan election of 2013 was high. Indeed, about half of those interviewed the week of the election received political text messages from family and friends the day of the election, whereas in the follow-up poll, about one fifth of those interviewed reported that they received an SMS on the actual day of the election about the election or politics (Table II). These high levels of communication over SMS are notable because the GoK actively warned citizens not to send political messages on the day of the election.Footnote 11
Messages about Voting and Comments on Candidates
In terms of frequency, two-thirds of the respondents in the follow-up poll stated that the texts they received were encouraging them to vote, or checking to see if they had already voted. Citizens in different parts of Kenya had different probabilities of receiving a message encouraging them to vote or checking to see if they had already voted (Tables III and IV). In terms of region, citizens in the former provinces of Coast, Eastern and Western were less likely to report receiving a message encouraging voting, or checking to see whether they had voted than predicted whereas residents of the former provinces of Nyanza, and the Rift Valley, were more likely to report receiving a message encouraging voting, or checking to see whether they had voted. In terms of ethnic groups, Kisii were more likely to report receiving messages encouraging voting than other ethnic groups.
Differences between selected responses based on rural or urban residence

Source: Authors’ analysis of IPSOS Synovate Data.
* These results are statistically significant at the 95% confidence level.
Differences Between Selected Responses Based on Region*

Source: Author's analysis of IPSOS Synovate Data.
‡ The authors were unable to perform a statistical analysis on the results from the former Northeastern province, because the numbers of the people polled were so low, and so different in size from the numbers polled in other regions.
* The polling firm utilised former Kenyan provinces, because it relied on the 2009 census.
** These figures are statistically significant at the 99% confidence interval.
a Number of yes answers higher than predicted by the sample mean.
b Number of yes answers lower than predicted by the sample mean.
The percentage of women and men who reported receiving an election related text messages was statistically the same between men and women, regardless of the question asked.Footnote 12 Citizens in the former Western Province were much more likely to report receiving a positive or negative message about a candidate. In addition, people who identified themselves as belonging to the Luhya ethnic category were statistically more likely to report receiving positive or negative messages about a candidate or political party.
Messages about Hate Speech
Among those interviewed the week of the election, about 15% of those whom we spoke to received a text message they perceived as insulting (maneno ya matusi) or threatening (maneno ya kutisha). The follow-up poll asked much more tailored questions in an effort to obtain more precise data on exactly what kind of messages Kenyan citizens were likely to receive. For example, in the follow-up poll, 1% reported receiving a negative or hate message about an ethnic group, with an additional 1% received a message about a possible bribe for voting; 6% reported receiving security messages relating to the election; and 6% remembered receiving messages about election irregularities or mismanagement.
Reports of hate speech messages were difficult to analyse because of the low number of reports of such messages. No such reports were made in the former provinces of Central, the Coast, Eastern, Nairobi or Nyanza (Table IV). Only respondents who lived in the former provinces of Northeastern, Rift Valley and Western reported receiving text messages containing hate messages about any ethnic group(s) on election day. Rural residents were statistically more likely to report receiving hate messages than urban residents (Table III). Importantly, in the follow-up poll, only rural residents reported receiving negative or hate messages about another ethnic group. The authors were unable to confirm that there was a statistically significant difference in the rate at which different ethnic groups received hate speech messages (Table V). Residents of the Rift Valley were statistically more likely to report receiving hate speech messages (Table IV).
Differences in reports of messages received based on ethnicity

‡ The authors were unable to perform a statistical analysis on all the ethnic groups for which we had data, due to small sample sizes of many groups.
* These figures are statistically significant at the 95% confidence level.
a Number of yes answers higher than predicted by the sample mean.
b Number of yes answers lower than predicted by the sample mean.
The follow-up poll indicates that 1% of those polled reported receiving messages containing a negative ‘hate message’ about another ethnic group. Importantly, it was left up to the recipient to determine whether the message was a ‘hate message’. Because the follow-up poll was conducted some time after the election, it is likely that some citizens received hate messages which they did not remember. These facts point towards underreporting of hate speech. However, it remains reasonable to conclude that the number was much depressed from the 2007/2008 period. In neither the election week poll nor the follow-up poll did citizens report receiving high numbers of hate speech messages.
Election Irregularities
Rural residents were statistically more likely to report receiving messages about election irregularities than urban residents. Citizens in Eastern and Nyanza province were less likely to report receiving messages about election irregularities whereas residents of the former Western province were statistically more likely to report receiving messages about election irregularities than residents in other areas of the country. Those who self-identified as Luhya were more likely to report receiving expressions of concern about election irregularities, whereas Luo and Kisii were statistically less likely than other groups to report receiving expressions of concern about election irregularities or mismanagement (Table V).
Security Issues
Somewhat surprisingly, citizens in the former Eastern and Western provinces were statistically less likely to report receiving messages about security issues related to the election whereas citizens of the former Rift Valley province were more likely to report receiving such messages than residents of other regions of the country. The follow-up poll did not indicate that there were statistically significant differences between residents in different regions reporting rewards for casting votes.
ANALYSIS OF CONTENT OF SMS/TEXT MESSAGES SENT ON ELECTION DAY
As noted above, text messages represented a rich source of communication in the 2013 Kenyan general election, between candidates, voters, friends, relatives and even strangers. Certainly, there was a lot of political talk, in English, in Kiswahili, and in various vernacular languages about the election in homes, public transportation, bars, private residences and the street. The benefit of tracking communication over SMS is that the communication is written, and therefore can be recorded. The election week interviews were very useful in helping to document the kind of text messages that voters and citizens sent to each other about the election, during the election.
The most common kind of text message received was one from family and friends encouraging a fellow voter to go the polls. Such reminders can be very effective in increasing voter turnout (Dale & Strauss 2009). The follow-up poll indicated that two-thirds of voters who reported receiving an election-related message received one encouraging them to go vote, or checking to see whether they had voted. Numerous citizens interviewed shared the messages they had received encouraging them to vote. The language was very consistent across regions. For example, ‘Wake up, come and vote.’ [I also heard a] Vuvuzela. I received ten [messages] before 5 a.m. Several people we spoke to during election week also mentioned receiving messages of peace. Peace-related messages were often detailed and thoughtful.
We need our country even after elections so we can continue with daily lives. Let us vote peacefully and avoid incitement. We are all Kenyans!
LET THIS ELECTION BE PEACEFUL, if you must burn anything burn MOVIES, if you are throwing anything, THROW A BASH, if you are cutting anything, CUT A CAKE, kama lazima umwage damu mwaga ya KUKU, (if you must shed blood, shed the blood of a chicken) kama ni kuchoma choma Taka TAKA, (if you have to burn, burn trash) nakama nikupiga, piga KURA, (if you have to hit, hit a vote-kupiga kura means to vote) help me sambaza (forward) this peaceful message to all KENYANS … Let's leave as BROTHERS and SISTERS, Plz … Thanks.
Dear customers, as we go vote, may God help us to dwell in unity and peace. [From CMAP (a new bank)]
Several messages with a clearly campaign-based message were sent on the day of the election. According to the follow-up poll, messages about a specific candidate were relatively common, ranking right after messages encouraging people to go to the polls (Table II). Family and friends were often encouraged by fellow voters to vote for a specific candidate or party, sometimes in a fairly direct manner.
I exchanged texts with a friend reminding me to vote wisely for the candidate of our choice.
Absolutely, my mother directed me to vote for Jubilee flagbearer Uhuru Kenyatta.
My dad informed me to vote for Yusuf Hassan MP.
In terms of campaign messages that did not come from specific family or friends, respondents were often not clear about who had sent them the message, or where the messages had come from.
The CORD coalition in conjunction with FORA (Friends Of Raila) kindly urges you to come out in large numbers on 4th March and vote for His Excellency the Rt. Hon. PM. Dr. RAILA AMOLO ODINGA to be the 4th president of the Republic of Kenya: Plz pass this to other friends of RAILA.
Jubilee 3:16- For Kenyatta so loved Kenya that he gave out his son that whoever votes for him shall never get bored in Kenya but enjoy life in the country.
Vote Jubilee, they have the welfare of the youth at heart. So vote for change.
Some text messages encouraged voting for a specific local candidate.
Some messages asked me to vote for certain governors, members of parliament and country representatives. I deleted most of them but have this one that reads:
“Nakuomba unipigie kura yako ya ugavana Mombasa. Karatasi ya kura ya magavana ni ya blue. Jina ni L___ K___ M____. Chama ni PDU, alama ya chama ni mamba.” (I ask you to cast your vote for me for governor of Mombasa. The paper for voting for Governor is blue. My name is L.K.M. The party is PDY. The picture is a crocodile.)
Despite repeated warnings on television, radio, newspaper and social media against such expression, as many as 14% of the election week interviewees reported receiving messages that they characterised as provocative (ulipokea maneno ya kukera?) or threatening (ulipokea maneno ya kutisha?). These messages range from intimidation to avoid the ballot box, to the extremely obscene, to the insulting. One of the most disturbing messages shared with interviewers specifically warned a voter against exercising the franchise on the basis of religion: ‘You should not vote, you daughter of Osama bin Laden.’
Twelve voters interviewed during election week reported receiving messages that they felt were threatening. One of them received the following message: ‘Even if you vote, your vote will not count.’ It was not always obvious that the messages were, in fact, threatening. Rather, these messages aim to get a point across, and hopefully persuade voters in a certain direction. One voter found the message below to be provocative, although other voters found the message humorous, and several burst out laughing when told about this message: ‘CORD ikishinda mtajua malenge ni mboga’ (If CORD wins, then you are going to realise that the pumpkin is also a vegetable). This message was very intriguing, because it is only meaningful in context. If you are not a Kenyan, you may have trouble deciphering the meaning. The pumpkin may be a food that is not eaten in Kenya until times are desperate. Accordingly, the subtext of this message is that there are going to be ‘dire consequences’ if CORD is elected. Other messages were more direct regarding why one party was more desirable than another: ‘Voting for CORD will be suicidal and will lead to bloodshed, anarchy and mayhem.’ Although this message does not threaten force directly, it suggests that voting for one party will lead to violence, and the use of force.
Other messages indicated how difficult it is to correctly interpret political speech, particularly over text, which tends to be short. For example, ‘democracy is kifua’. This message again uses a sophisticated combination of Swahili and English, both allowed by the regulators’ pen. It can be interpreted as ‘democracy is ‘force’’. It could be read to mean that democracy must be gained by force, or muscle. Or, it could be read as ‘Democracy is forced [on a people]’, or ‘the people have no say’. In Kiswahili ‘kifua’ (chest) is associated with ‘force’ as in ‘usitumie kifua’ ‘do not use force’, which suggests that people were being forced to vote in a certain way, and that was threatening to them. This text was reported by a voter who cast their vote in Garissa, which is a location with high violence levels. Furthermore, the person interviewed reported feeling scared while voting and mentioned the presence of the terrorist group Al Shabaab in the vicinity. Given the brevity of text messages, these snippets of meaning are highly contextual. Yet, this example shows the difficulty of determining whether a specific message is hate speech.
Other types of political speech did not reference violence at all, yet contained political subtexts. An interesting text message which was a variation on ‘vote wisely and peacefully’, is shared below: ‘It's your vote that will count on 4th March. Not pollster's agenda. Vote right.’ This message is intriguing because one of the last reputable polls in the period right before the election had presidential candidate Uhuru Kenyatta with a very slight lead. Several other polls showed opposition presidential candidate Raila Odinga in the lead. Depending on whom this message was sent to, and who sent it, it is likely to be an encouragement to vote for a co-ethnic.
One provocative message read as follows: ‘The IEBC is under pressure to rig the election.’
On the one hand, this message could be viewed as ‘inciting’, because it aims to weaken voter confidence in the electoral system. Alternatively, this message could simply be a statement of opinion by a voter of the difficult situation faced by the IEBC.
It should be noted that a rumour in a text message that went viral in 2007/2008 and led to rioting alleged – incorrectly – that Raila had been imprisoned (Osborn Reference Osborn2008). Indeed, spreading misinformation via text messaging, blogging and Facebook may actually be more damaging than speech which threatens violence (Osborn Reference Osborn2008). Michelle Osborn notes that text messages stating that notable ODM officials had been arrested and were targets of assassination plots may have contributed to the second wave of violence in 2008. Notably, the SMS message noted above about the rigging by the IEBC contained no threats of violence, and no banned words. Accordingly, this message could be viewed as a sophisticated evasion of the Kenyan anti-hate speech regulations. These examples demonstrate that it is impossible to completely control contentious speech that can be sent across cellular telephony.
Our election week interviews did not yield any messages that suggested a certain ethnic group be attacked. Further, no one we spoke to during election week reported receiving a text message containing the ‘banned’ vernacular words. But short of that, messages ran the gamut. Several persons interviewed the week of the election mentioned that they had been so offended by messages they had received that they deleted them immediately. Given that the research team conducted the majority of the interviews on the actual day of the election this may mean that people received messages that they found very upsetting, or that made them fearful. This may have been because citizens were afraid they would get in trouble if they shared such messages. Although it is likely that the follow-up poll understated the number of hate messages received, the initial election week study also did not find high percentages of negative messages. These low numbers are also supported by the Umati paper, which found no more than 10 ‘hate speech’ messages online on any given day of the week of the Kenyan election of 2013 (Sambuli et al. Reference Sambuli, Morara and Mahihu2013: 23).
Considering Citizen Responses to Government Efforts to Control Communication
A review of the messages above indicates the difficulty in determining which messages are actually hate speech, as well as the importance of context in interpreting political messages. Accordingly, what is the appropriate role for the government in monitoring, or controlling both old and new media, and when do such efforts shade into censorship, or even repression? On one side of this equation are governmental efforts to prevent election-related violence caused by hate speech (Bekoe Reference Bekoe2012). On the other side of the equation, state-sponsored efforts to control election-related and political speech in Africa have frequently not been benign, as in the case of the DRCs ban on all text messaging and the shutdown of opposition radio stations and newspapers on 3 December 2011 (Ighobor Reference Ighobor2013) or the case of Uganda President Yoweri Museveni's efforts to censor Facebook and Twitter during the ‘Walk to Work Campaign’ (Bowman & Camp Reference Bowman and Camp2013) and during the 2016 Ugandan general election. The authors argue that shutting down the Internet, or television broadcasting (as the Kenyan government did in 2008) or specific social media sites such as Twitter is an unmistakable act of censorship. The GoK's efforts to control citizen communication during the 2013 election were, in the main, less obvious than this, and may be characterised as ‘soft censorship’.
THE LEGALITY OF HATE SPEECH
Pursuing this line of argument, if the GoK indeed did censor speech in 2013, is such censorship allowed by Kenyan law? The Kenyan Constitution (2010) does have strong guarantees of freedom of expression as well as freedom of the media. Article 33(1) gives citizens the right to freedom of expression, including the right to receive, seek or impart information or ideas. Article 34(1) guarantees freedom and independence of the electronic, print and other types of media, but again this protection does not apply to the areas delimited by 33(2). Article 34 does provide citizens some protection, enjoining the government from interfering with broadcasting or publication via any medium.
The right of freedom of expression in Kenya, however, is a limited right. Under Article 33(2) of the 2010 Constitution, freedom of expression does not extend to the right to propagate war, incite violence, participate in hate speech, advocate hatred or support discrimination. Hate speech was criminalised through the passage of the National Cohesion and Integration (NCIC) Act of 2008.Footnote 13 The NCIC was established in 2008 as an independent body to spearhead national reconciliation, cohesion and integration and to eliminate discrimination, especially ethnic, racial or religious discrimination, after Kenya went into post-election violence. Under section 13 of the NCIC Act, the focus is on speech that is ‘threatening, abusive, or insulting’, if the person ‘intends to stir up ethnic hatred’. Under the NCIC, Ethnic hatred refers to colour, race, nationality or ethnic or national origins but excludes religion, gender and other group categories. A key provision in the NCIC Act is in Section 62. This section holds liable any media enterprise for publishing any utterance considered to amount to hate speech.
The language of the Kenyan Constitution as well as the NCIC Act of 2008 specifically acknowledges the emergence of new media. Yet, because the Kenyan Constitution is relatively recent, the courts have not had the occasion to interpret the meaning of ‘hate speech’. Nor have the Kenyan courts made definitive statements about where freedom of expression ends, and where hate speech begins. These questions remain largely open, and the Kenyan General Election of 2013 represented a testing ground where the Kenyan government could attempt to push the interpretation in its favour.
During the electioneering period, Kenya's government monitored blogs and social media outlets for hate speech and consequently launched several investigations against bloggers for their alleged hate speech activities (Mukinda Reference Mukinda2013). However, it is not clear whether these cases were prosecuted. So although both the Kenyan Constitution and the NCIC Act ban hate speech, lack of enforcement may render those provisions weaker than they appear to be in the legal texts. Additionally, the GoK has not developed a clear framework to regulate hate speech online, or over social media, although some observers believe that the GoK should step in to tackle hate crimes on the Internet when necessary (CHRIPS 2013).
Legal Precedent Regarding Hate Speech in Other Countries
Unquestionably, the literature on hate speech globally is voluminous, particularly in the legal arena (see e.g. Delgado & Yun Reference Delgado and Yun1995; Kapur Reference Kapur1996; Brison Reference Brison1998; Whitman Reference Whitman2000). Some scholars have argued that hate speech poses a complex challenge to modern-day constitutional rights to freedom of expression (Rosenfeld Reference Rosenfeld, Herz and Molnar2012: 1523). As a point of comparison, India has a similar constitutional construction as Kenya, where free speech is guaranteed, with some limits under Article 19(2) (Kapur Reference Kapur1996). Notably, the American Constitution does not contain the explicit provisions that the Kenyan Constitution does on this issue (Brison Reference Brison1998). Despite the lack of explicit provisions banning hate speech, American courts will not protect certain kinds of speech, including the ‘fighting words’ doctrine, which arguably encompasses hate speech. The USA is much more tolerant of such speech than European courts (Whitman Reference Whitman2000). Kenya is not required, however, to accept either the European or the American model of hate speech. There is an important opportunity here for Kenyan scholars, courts and lawmakers to develop their own definition of hate speech that focuses on ethnic incitement relevant to the Kenyan context.
CONCLUSION
This study lends empirical support for the proposition that the three-pronged effort by the GoK, donors and NGOs to regulate, censor and educate caused Kenyans to restrain their political speech over SMS, at least through election day. This study provides also provides strong support for the conclusion that ‘hate speech’ over SMS declined between the 2007 and the 2013 election, at least for the period of the actual election.Footnote 14
This study also represents an empirical baseline study on hate speech over SMS, much in the same way that Umati represents a baseline study of hate speech on Facebook. This study provides data regarding hate speech as well as other types of political speech distributed over SMS during an election in Kenya. Hopefully, the growing body of literature in this area will spur lawyers, scholars, human rights practitioners and activists to work on filling this constitutional, legal and regulatory gap regarding the definition of ‘hate speech’ in the Kenyan context.
One positive and unexpected surprise was that Kenyan citizens frequently expressed ‘peace speech’ using text messages to encourage their friends to avoid violence. This ‘peace speech’ may have been correlated with a citizen desire for a ‘peace vote’ in an election which followed a post-conflict election (see Batty Reference Batty2015). Yet, despite government regulations and omnipresent media warnings to the contrary, some texts were sent intimidating people away from the polls, or sending politically incendiary messages. Interestingly, none of the actual text messages collected by the research team could be characterised as hate speech, even under the nuanced definition proposed by Benesch.
Statistically, there were regional and ethnic differences in the kinds of messages Kenyans reported receiving. The results gained from a statistical analysis of the follow-up poll (Tables III, IV and V) are interesting, and some are slightly surprising. The authors hypothesised that negative messages would have been higher in the volatile Rift Valley, which was the epicentre of post-election violence in 2008. In fact, residents of the former Rift Valley province reported receiving significantly higher levels of messages about election insecurity, hate speech and voting than residents of other regions. Interestingly, the former Western province is an area of unusually high levels of political communication over SMS, and those who self-identified as Luyha reported statistically significantly elevated levels of messages regarding (1) electoral irregularities and mismanagement and (2) messages about candidates or political parties. The authors believe that these results may be attributed in part to the high ethnic, linguistic and political heterogeneity of this area, as well as its high population density. Although the numbers of people polled in the former Northeastern Province were too small to analyse statistically, examining both the election week and the follow-up poll data together indicates a spike of hate messages among citizens of Northeastern.Footnote 15 Additional research should be conducted in the next election to confirm this.
In addition, although it was a very small number in absolute terms, the election week interviews indicated that as many as 8% of the people interviewed during election week changed their vote based on a Facebook post or an SMS. In a tight election in which the victor was determined by less than 10% of the vote, this is a large enough group that it calls for further investigation. Further careful empirical research is warranted during the next election to evaluate whether well-timed social media messages can be sufficient to change Kenyan citizens’ voting behaviour.
Scholars, activists and human rights practitioners should ask themselves what was lost in the GoK's effort to control political speech? Censoring on the basis of ‘banned words’, is a blunt and imprecise instrument at best and not feasible in the long run. Although this study did not find specific examples of people receiving banned words, voters did provide several specific examples of incendiary, obscene and threatening text messages that were not censored by the GoK apparatus and made it through the ban. This study argues that what makes messages ‘hate speech’, or provocative, insulting or threatening is very much contextual, and can be easily evaded by someone with a mastery of their own vernacular, Swahili or even English. Indeed, many of the messages received were ambiguous in their intent. Given that a variety of repressive governments – including several in Africa and the Middle East – are engaged in the business of filtering, monitoring and censorship, Kenya's flirtation with filtering software and censorship of text messages should likely be viewed with alarm by scholars and activists.
Kenya has made massive strides towards becoming a constitutional, multi-party democracy over the past 20 years. The Kenyan Constitution is in a period of interpretation, implementation and reification and the process of making the 2010 Kenyan Constitution the law of the land – as opposed to words on a page – is far from complete. Accordingly, Kenyan lawyers, scholars, activists and those interested in strengthening the freedom of expression guarantees contained in the Constitution should engage in a robust debate and work to clarify and codify freedom of speech guarantees as well as clearly define and outline the limit of ‘incitement’, ‘hate speech’ and other terms contained in Article 34 so that those terms are not ‘void for vagueness’.
At least during election week, text messages were less likely to be exchanged, and media pronouncements were muted due to the potentially chilling effect of criminal sanctions. As voters anxiously waited for election results and as the Kenyan Supreme Court considered the outcome, the relative quiet that had characterised Kenyan political discourse during the week of the election degenerated into a cacophony of political vitriol. In the period after the election was concluded, hate speech arguably shifted to the Internet, particularly on blogs and social media platforms such as Facebook and Twitter (CHRIPS 2013). Indeed, after election week, Kenyan social media, particularly Facebook, famously devolved into politically and ethnically fueled viciousness (Christian Science Monitor, 21 March 2013). Although the GoK's regulations and filtering were effective in the moment, they likely pushed contentious debates around land, inequality, women's rights and ethnic privilege to other forums. Criminalising hate speech does not, in and of itself, eliminate the conditions that spawn such utterances. Instead, a nationwide process of reconciliation and discussion of contentious issues may provide a strong platform for debate of the underlying national tensions (see Sambuli et al. Reference Sambuli, Morara and Mahihu2013).
Eliminating voter intimidation is a key element of ensuring a free and fair election. Government officials and civil society activists may wish to discuss alternative ways to reduce intimidation of voters, without actually encouraging or engaging in censorship. One of the impressive findings from both the election week interview data as well as the follow-up poll data was the extent to which Kenyan voters were really dedicated to the concept of peace. These data may point to the idea that voter education is really a very effective mechanism, and indeed, more effective than efforts at censorship.
Appendix 1. Methodology for calculating robust statistics
We describe how we analysed data obtained from the follow-up poll from voters in the Kenyan election of 2013. The data consist of ‘yes’ or ‘no’ answers from voters to a series of (13) questions. In addition each voter was identified according to his or her gender, province (seven provinces were analysed) and ethnic group. We assume that the number of ‘yes’ answers to any of the questions (n) follows a binomial probability distribution (Cramér Reference Cramér1999).
 $$P\left[ {n,\,t,\,a} \right] = \displaystyle{{t!} \over {n!\left( {t - n} \right){!}}}a^n\left( {1 - a} \right)^{t - n}$$
t is the number of answers (number ‘yes’ + number ‘no’) and a is the probability that any one answer is ‘yes’. We wish to test statistically if the probability parameters for different provinces (or ethnic groups) are different or the same.
If both n and t − n are large, P[n, t, a] approaches a discrete Gaussian probability distribution.
 $$P\left[ {n,\,t,\,a} \right] \to \displaystyle{1 \over {\sqrt {2\pi} \sigma}} e^{\displaystyle{{{\left( {n - at} \right)}^2} \over {2\sigma ^2}}}$$
 $$\sigma \to \sqrt {t\,a\left( {1 - a} \right)} $$
The probability parameter, a , is the probability that the answer is ‘yes’ for a single trial.
For our dataset, t − n and n are not always large and the probability distribution may not be Gaussian. Furthermore, the number of voters is different for different provinces and ethnic groups. For both these reasons, we cannot use a T test to determine if the probability parameters for different provinces are different.
We resort to direct application of the binomial distribution to test the null hypothesis that for each question the probability parameters for all provinces are the same. We have data in the form {t 1, t 2, t 3, … t m } and {n 1, n 2, n 3, … n m }. For each question t k and n k are the number of respondents and ‘yes’ answers for some question for province k. The null hypothesis is that the all provinces have a common probability parameter, a. We assume that the null hypothesis is true and estimate the common probability parameter by combining the data for all provinces (or ethnicities).
 $$N = \sum\limits_k {n_k} $$
 $$T = \sum\limits_k {t_k} $$
 $$a = \displaystyle{N \over T}$$
The Gaussian approximation is better for the combined sample because N and T are larger than t k and n k for any individual sample. (The uncertainties in the estimates are given in the results section and are small for all cases.) We then calculate two probabilities for each province:
P g is the probability that the number of ‘yes’ answers is greater than or equal to the actual number of ‘yes’ answers by chance and P l is for less than or equal to by chance.
 $$P_g = \displaystyle{1 \over 2}P\left[ {n_k,\,t_k,\,a} \right] + \sum\limits_{n = n_k + 1}^{t_k} {P\left[ {n,\,t_k,\,a} \right]} $$
 $$P_l = \displaystyle{1 \over 2}P\left[ {n_k,\,t_k,\,a} \right] + \sum\limits_{n = 0}^{n_k - 1} {P\left[ {n,\,t_k,\,a} \right]} $$
If P g <.05 or P l <.05 then with 95% confidence we say that the null hypothesis is false and different provinces (or different ethnicities) have different probability parameters.
Appendix 2. Questionnaire for Government and NGO Officials
[We] are writing a paper on use of ICTs during the elections. We would like to hear your views on the conduct or the media, and the issue of hate speech. We therefore request you to answer in as much detail as possible the following questions:
-
1. What was the role of the media in the 2013 elections, in your view?
-
2. What responsibilities did the media have, if any, to prevent violence?
-
3. Do you agree that the media participated in a ‘peace narrative’ where they refused to discuss controversial issues? Why or why not? Elaborate.
-
4. What responsibilities, if any, did citizens have to control their communications on Facebook or SMS to avoid hate speech?
-
5. We understand that there were government regulations banning hate speech in the election of 2013.
-
a) What did you think of the regulations?
-
b) Were the regulations effective?
-
c) What impact do you think the regulations had on citizens?
-
-
6. Was your organisation involved in monitoring facebook posts, rallies, or other citizen communications vis-à-vis freedom of expression? Please describe what that entailed and what your organisation was looking for.
Please answer these questions in detail for us in writing, and return at your earliest convenience but hoping not later than June 26th.
Appendix 3. Structured Exit Interview for Recent Voters in Kenyan Election, 2013
-
1. Did you vote in the Kenyan General Election today?
-
2. Where did you vote? Please indicate polling place, constituency, and county.
-
3. What is your age and gender?
-
4. Can you characterise your voting experience?
-
5. Did you receive any text messages from family and friends the day of election?
-
6. Did those texts encourage you to vote for a certain candidate?
-
7. Did you receive any text messages informing you of the likelihood of a certain candidate winning the election?
-
8. Did you receive any messages warning you to stay away from the polls, or telling you your vote did not matter?
-
10. Did you receive any leaflets the day of the election?
-
11. Did you receive any text messages that you found provocative or threatening?
-
a. Please describe any such messages.
-
-
12. Do you have a Facebook account?
-
a. Did you post any information about the election on Facebook in the days before the election or the day of the election?
-
b. Did you receive any Facebook messages encouraging you to attend to attend a political rally?
-
-
13. Did you actually change your vote, or attend any rallies as a result of a Facebook, SMS or leaflets?
-
14. Is there any other information you would like to tell us about your election experience?