Introduction
The tropics are divided into two main biogeographical regions, the Paleotropics and the Neotropics. Together they are referred to as the Pantropical region. According to Takhtajan et al. (Reference Takhtajan, Crovello and Cronquist1986), five biogeographical subkingdom regions (African, Madagascan, Indomalesian, Polynesian and Neocaledonian) can be recognized in the Paleotropics, and another five in the Neotropics (Caribbean, Guayana highlands, Amazonian, Brazilian and Andean). The tropics include important forest ecosystems, covering a total area of 23·6 million km2 (Coad et al. Reference Coad, Burgess, Bomhard and Besancon2009). Furthermore, the tropics represent a major reservoir of species diversity in most groups of terrestrial organisms, including lichen-forming fungi (Hawksworth Reference Hawksworth2001, Reference Hawksworth2012; Wiens & Donoghue Reference Wiens and Donoghue2004; Mittelbach et al. Reference Mittelbach, Schemske, Cornell, Allen, Brown, Bush, Harrison, Hurlbert, Knowlton and Lessios2007). However, our understanding of the processes that shaped the diversity of lichen-forming fungi in tropical habitats is still in its infancy. Using phylogenetic estimates to address issues of historical biogeography can assist in identifying the causes of distribution patterns and diversification shifts, such as climatological and geological processes, vicariance and long-distance dispersal (Crisci Reference Crisci2001; Donoghue & Moore Reference Donoghue and Moore2003). The advent of DNA sequencing technologies and recent advances in analytical tools have allowed researchers to address biogeographical patterns in some groups of lichenized fungi (reviewed in Divakar & Crespo Reference Divakar and Crespo2015), despite the relatively small amount of fossil data available for lichens (Kaasalainen et al. Reference Kaasalainen, Schmidt and Rikkinen2017; Lumbsch & Rikkinen Reference Lumbsch and Rikkinen2017). DNA inferred phylogenetic estimates, coupled with analytical methods for inferring ancestral distributions in a phylogenetic context (Ree et al. Reference Ree, Moore, Webb and Donoghue2005; Nylander et al. Reference Nylander, Olsson, Alstrom and Sanmartin2008; Ree & Smith Reference Ree and Smith2008; Sanmartin et al. Reference Sanmartin, Van der Mark and Ronquist2008; Ree & Sanmartin Reference Ree and Sanmartin2009; Ronquist & Sanmartin Reference Ronquist and Sanmartin2011), provide a powerful tool to identify forces determining geographical distributions.
Most studies addressing historical biogeography of lichen-forming fungi have focused on groups occurring predominantly in temperate or arctic habitats, with very few exceptions studying tropical clades (Lücking Reference Lücking2003; Lücking et al. Reference Lücking, Papong, Thammathaworn and Boonpragob2008; Divakar et al. 2010 Reference Divakar, Ferencova, Del Prado, Lumbsch and Crespoa ; Geml et al. Reference Geml, Kauff, Brochmann and Taylor2010; Otálora et al. Reference Otálora, Martínez, Aragón and Molina2010; Amo de Paz et al. Reference Amo de Paz, Cubas, Divakar, Lumbsch and Crespo2011, Reference Amo de Paz, Crespo, Cubas, Elix and Lumbsch2012; Sérusiaux et al. Reference Sérusiaux, Villarreal, Wheeler and Goffinet2011; Werth Reference Werth2011; Leavitt et al. Reference Leavitt, Esslinger, Divakar and Lumbsch2012a, Reference Leavitt, Esslinger, Spribille, Divakar and Lumbsch2013; Del-Prado et al. Reference Del-Prado, Blanco, Lumbsch, Divakar, Elix, Molina and Crespo2013; Núñez-Zapata et al. Reference Núñez-Zapata, Alors, Cubas, Divakar, Leavitt, Lumbsch and Crespo2017). Given the number of tropical species of lichen-forming fungi, understanding their distribution patterns is pivotal for comprehending the diversity of these organisms.
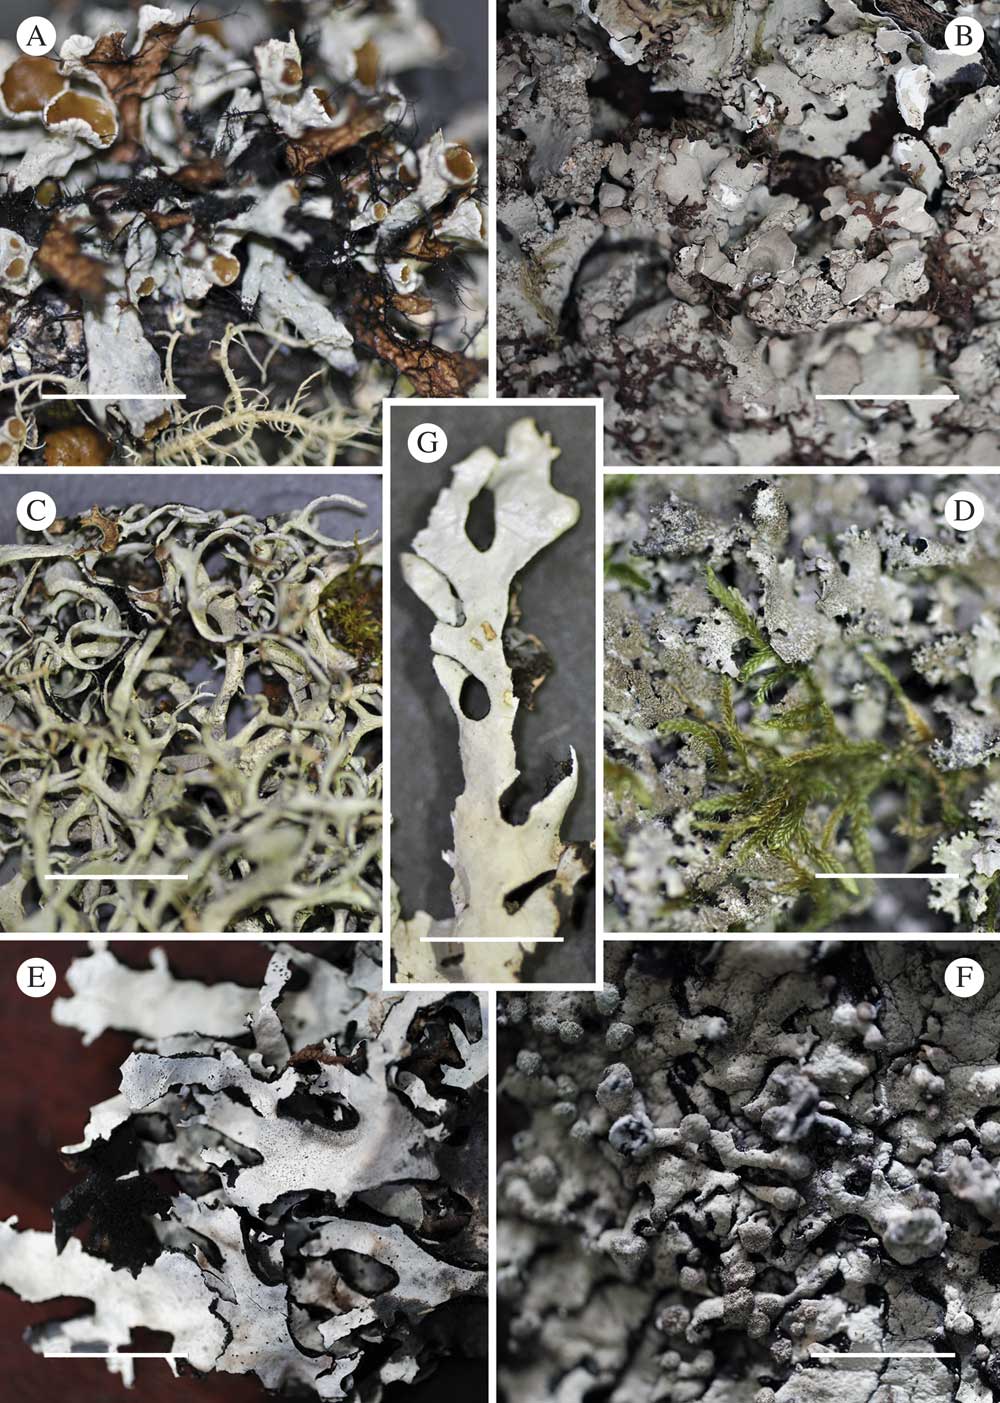
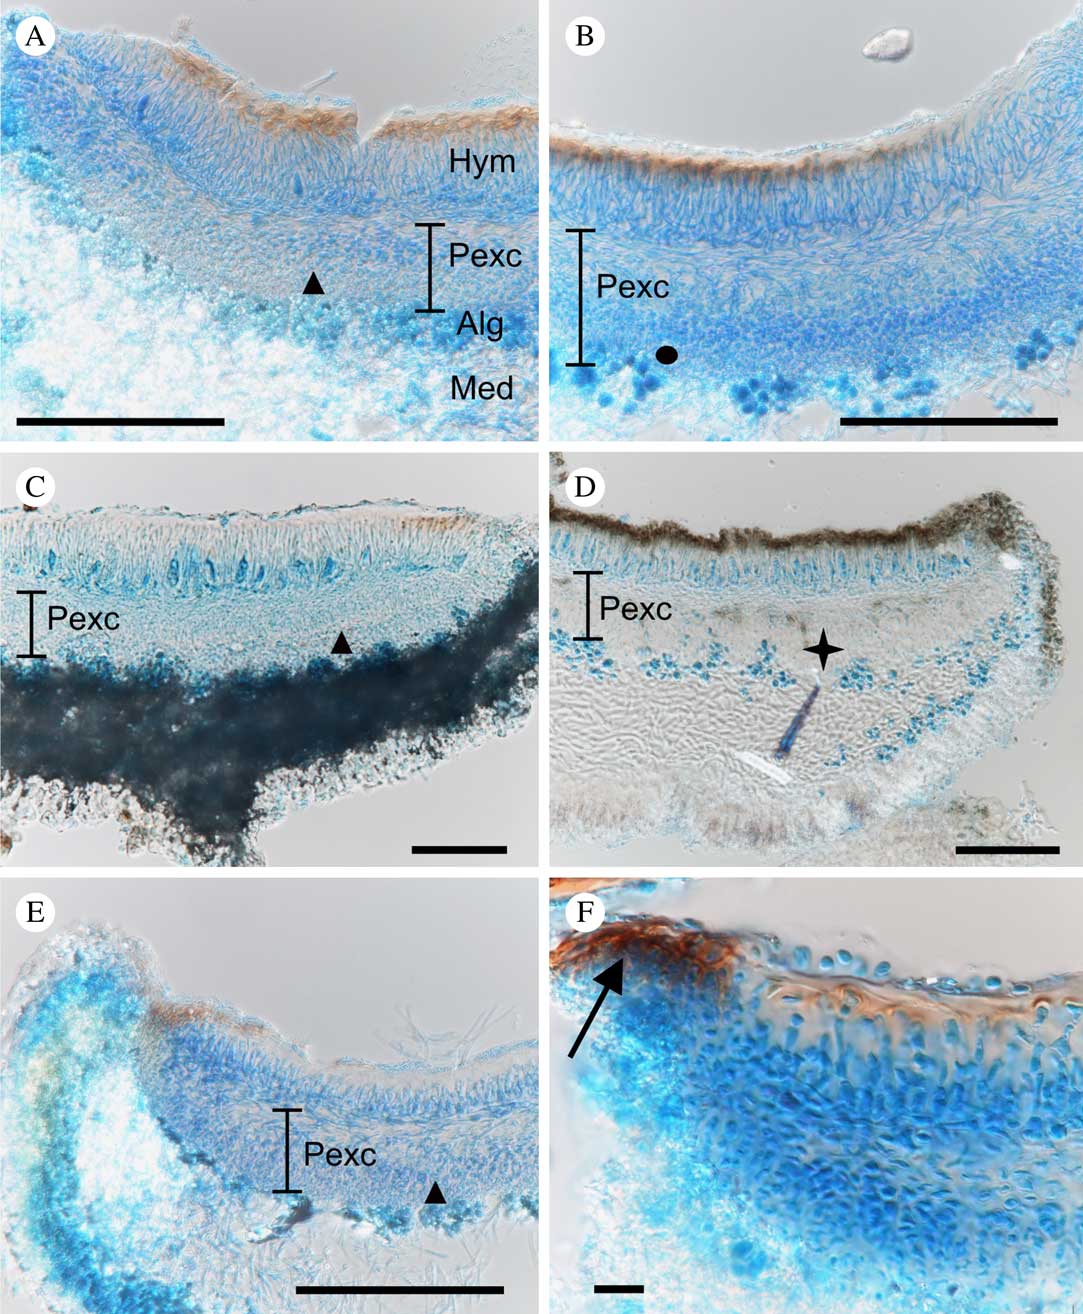
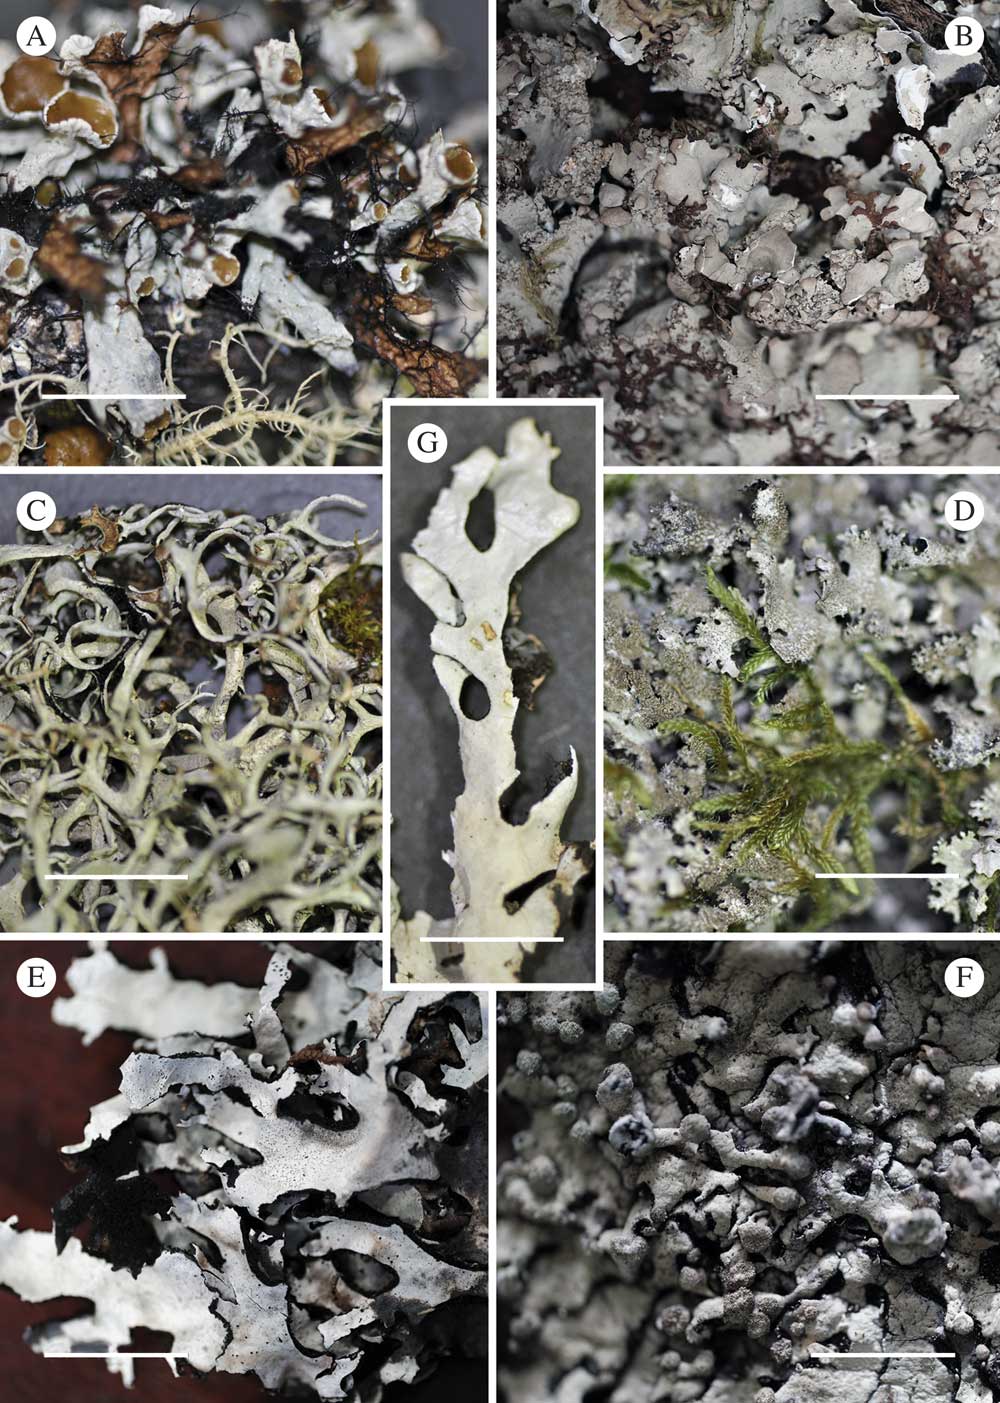
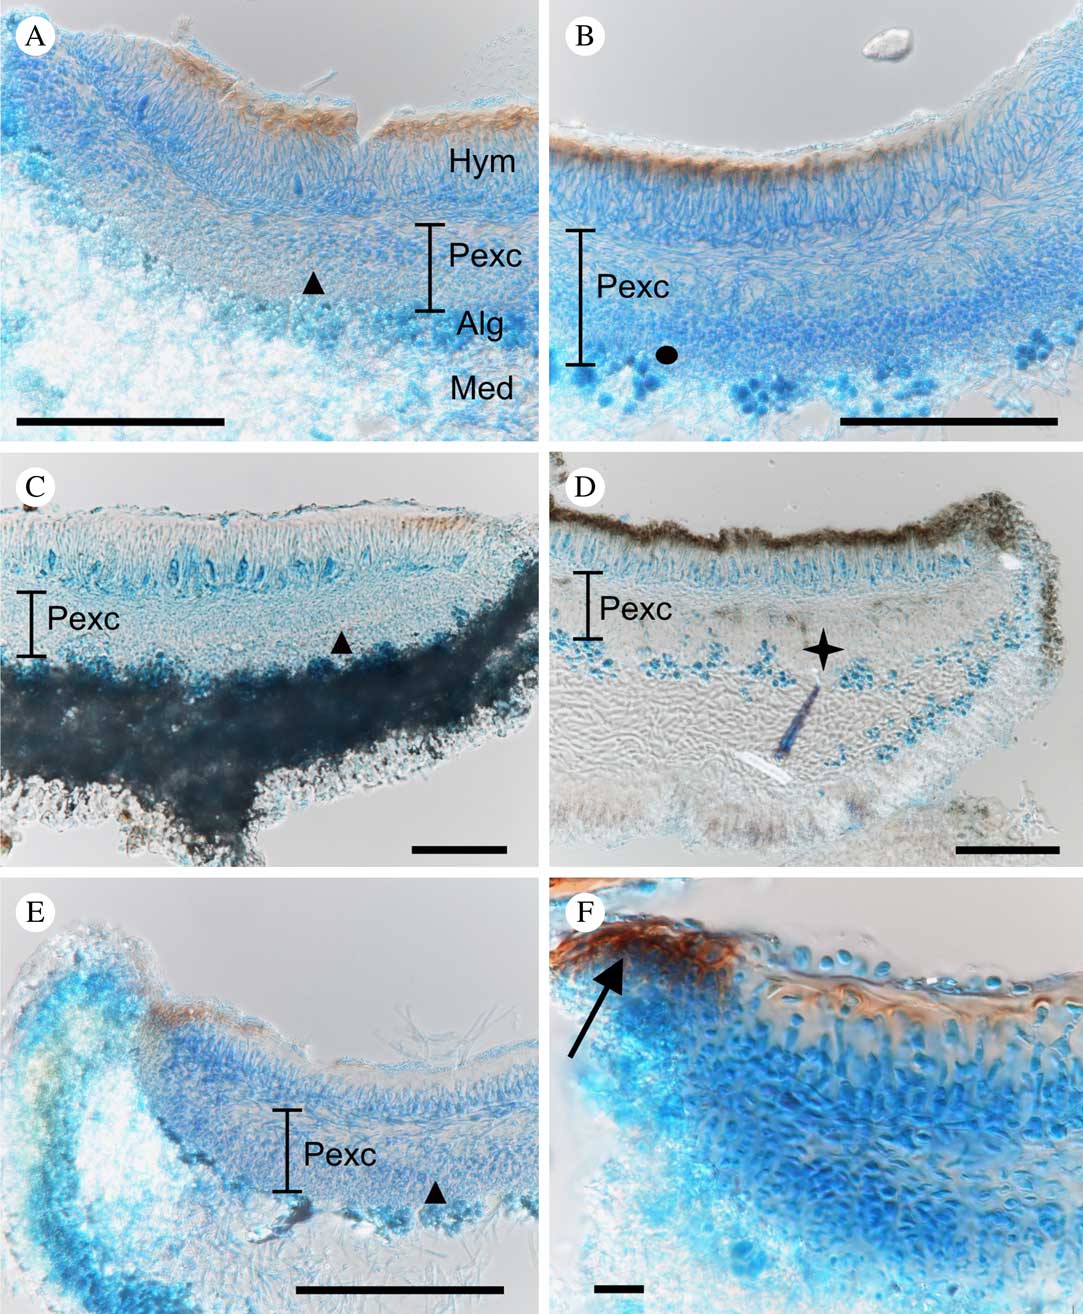
The family Parmeliaceae is the most speciose among lichen-forming fungi with c. 2800 currently accepted species (Jaklitsch et al. Reference Jaklitsch, Baral, Lücking and Lumbsch2016; Lücking et al. Reference Lücking, Hodkinson and Leavitt2016; Divakar et al. Reference Divakar, Crespo, Kraichak, Leavitt, Singh, Schmitt and Lumbsch2017). The origin of the family is estimated to have occurred during the Cretaceous, with diversification of major clades, including the most diverse parmelioid clade (Thell et al. Reference Thell, Crespo, Divakar, Kärnefelt, Leavitt, Lumbsch and Seaward2012), during the Paleogene and a major increase in diversification during the Miocene (Amo de Paz et al. Reference Amo de Paz, Cubas, Divakar, Lumbsch and Crespo2011; Divakar et al. Reference Divakar, Crespo, Wedin, Leavitt, Hawksworth, Myllys, McCune, Randlane, Bjerke and Ohmura2015; Kraichak et al. Reference Kraichak, Divakar, Crespo, Leavitt, Nelsen, Lücking and Lumbsch2015). Within the parmelioid clade, the genus Hypotrachyna (Vainio) Hale is characterized by having a pored epicortex, narrow, sublinear to linear elongate lobes with truncate apices, dichotomously branched rhizines, oval-ellipsoid ascospores and bifusiform conidia (Sipman et al. Reference Sipman, Elix and Nash2009; Crespo et al. Reference Crespo, Kauff, Divakar, del Prado, Pérez-Ortega, Amo de Paz, Ferencova, Blanco, Roca-Valiente and Núñez-Zapata2010; Divakar et al. Reference Divakar, Crespo, Núñez-Zapata, Flakus, Sipman, Elix and Lumbsch2013). Moreover, the genus presents vast morphological variability including different lobe morphologies and cortical chemistries (Fig. 1). Furthermore, it has anatomical variation in the structure of the proper excipulum of the apothecium (i.e. relative width of layers, quantity of intercellular matrix in the lower layer and presence/absence of a dark pigmentation in the rim) (Fig. 2; Ferencova Reference Ferencova2012). Previously separated genera, such as Cetrariastrum Sipman, Everniastrum Hale ex Sipman and Parmelinopsis Elix & Hale, have been included in Hypotrachyna and a revised classification of subgenera within Hypotrachyna was proposed based on molecular phylogeny and morphological data (Divakar et al. Reference Divakar, Crespo, Núñez-Zapata, Flakus, Sipman, Elix and Lumbsch2013), including the recognition of two new subgenera, viz. subgen. Longilobae Divakar et al. and subgen. Sinuosae Divakar et al. This revised generic circumscription, to include the previously separated genera, fits well within the temporal range of genera in Parmeliaceae (Divakar et al. Reference Divakar, Crespo, Kraichak, Leavitt, Singh, Schmitt and Lumbsch2017).
Habit of selected species of the main clades in Hypotrachyna. A, H. kaernefeltii (Peru, MAF-Lich. 15620); B, H. taylorensis (United Kingdom, MAF-Lich. 9921); C, H. cirrhata (Peru, MAF-Lich. 13976); D, H. horrescens (Spain, Pontevedra, MAF-Lich. 10400); E, H. longiloba (Peru, MAF-Lich. 18909); F, H. sinuosa (Chile, MAF-Lich. 19337); G, H. brasiliana (Brazil, MAF-Lich. 17019). Scales: A=5 mm; B=10 mm; C=20 mm; D=8 mm; E & G=7 mm; F=6 mm. In colour online.
Cross-section through the apothecium of Hypotrachyna species showing variability in the structure of the proper excipulum. A, H. fissicarpa; B, H. osseoalba; C, H. horrescens; D, H. ecuadoriensis; E, H. reducens; F, H. physcioides. Hym=hymenium, Pexc=proper excipulum, Alg=algal layer, Med=medulla. Symbols refer to differences in the lower layer of proper excipulum: star=wide lower layer with large amount of intercellular matrix, triangle=lower layer of intermediate width with less intercellular matrix, circle=narrow lower layer with scarce intercellular matrix, arrow=dark pigmentation in the rim of the proper excipulum. Scales: A–E=100 µm; F=10 µm. In colour online.
Currently, Hypotrachyna is comprised of c. 260 species (Divakar et al. Reference Divakar, Crespo, Wedin, Leavitt, Hawksworth, Myllys, McCune, Randlane, Bjerke and Ohmura2015). The genus is among the most common groups of lichens found in tropical montane forest habitats, especially in moderate to high altitudes. The highest diversity occurs in tropical America, particularly in the Andes (Sipman et al. Reference Sipman, Elix and Nash2009). It is absent or very rare in drier areas and lowland rainforests (Hale Reference Hale1975). While most Hypotrachyna species occur in tropical areas, some occur in temperate regions of the Old and New Worlds. Based on current distribution patterns, the Neotropics were previously hypothesized as the geographical origin of the genus (Hale Reference Hale1975; Culberson & Culberson Reference Culberson and Culberson1981) but this hypothesis has not yet been tested using a statistical approach.
Here we aim to 1) study the ancestral range evolution of Hypotrachyna in a likelihood framework, 2) estimate the timing of diversification events of main lineages to elucidate potential factors driving diversification, and 3) assess the impact of vicariance and/or long-distance dispersal in shaping the current distribution of Hypotrachyna species. We use a three-locus dataset which includes 77 species to address these issues.
Materials and Methods
Data assembly and alignment
Our present study uses a three-gene dataset recently published in Divakar et al. (Reference Divakar, Crespo, Núñez-Zapata, Flakus, Sipman, Elix and Lumbsch2013). Two datasets were prepared. For dataset 1, two species of Myelochroa were used as outgroup since this genus has previously been shown to be closely related to the Parmeliopsis and Hypotrachyna clades (Divakar et al. Reference Divakar, Crespo, Wedin, Leavitt, Hawksworth, Myllys, McCune, Randlane, Bjerke and Ohmura2015). Dataset 2 included samples of the Hypotrachyna clade, and the genera Parmeliopsis and Myelochroa, with two species of Nipponoparmelia as outgroup following Divakar et al. (Reference Divakar, Crespo, Kraichak, Leavitt, Singh, Schmitt and Lumbsch2017).
DNA sequences for each locus were aligned using the program MAFFT version 6 (Katoh & Toh Reference Katoh and Toh2008). For the internal transcribed spacer (ITS) region and the nuclear ribosomal large subunit (nuLSU) loci, we applied the G-INS-I alignment algorithm, ‘20PAM/K=2’ scoring matrix, and offset value=0·0, with the remaining parameters set to default values; for the mitochondrial SSU (mtSSU) we used the E-INS-I alignment algorithm, ‘20PAM/K=2’ scoring matrix, and offset value=0·0. While the alignment of nuLSU was straightforward, the ITS and mtSSU alignments contained a number of ambiguous regions. We used the program Gblocks v.0.91b (Talavera & Castresana Reference Talavera and Castresana2007) to delimit and remove regions of alignment uncertainty, applying the ‘less stringent’ option, including the ‘Allow smaller final blocks’, ‘Allow gap positions within the final blocks’, and ‘Allow less strict flanking positions’ options.
Phylogenetic and molecular dating analyses
Both datasets (1 and 2) were analyzed by maximum likelihood (ML) of the concatenated three-locus dataset (ITS, nuLSU and mtSSU) performed in RAxML v.8.1.11 (Stamatakis Reference Stamatakis2014) using the GTRGAMMA model and without a parameter for estimating the proportion of invariable sites. Each locus (ITS, nuLSU and mtSSU) was treated as a separate partition. Nodal support was evaluated with 1000 bootstrap pseudoreplicates using the same settings and data partitions as in the search for the optimal tree. The analysis was carried out using the program RAxML v.8.1.11, as implemented on the CIPRES Web Portal (http://www.phylo.org/portal2/). Exploratory analyses using alternative partitioning (e.g. ITS1, 5.8S, ITS2, nuLSU and mtSSU) schemes resulted in identical topologies and highly similar bootstrap support values.
Diversification ages were estimated using an uncorrelated Bayesian relaxed molecular clock model implemented in the program BEAST v.1.8.0 (Drummond et al. Reference Drummond, Suchard, Xie and Rambaut2012). We used the most likely tree derived from the three-locus RAxML phylogenetic analysis as the starting tree for each dataset. In BEAST, the partitioned alignment dataset was analyzed with unlinked substitution models across the loci and a relaxed clock model (uncorrelated lognormal) for each partition. A Yule prior was assigned to the branching process. The most appropriate model of DNA sequence evolution was selected for each marker using the program PartitionFinder v.1.1.1 (Lanfear et al. Reference Lanfear, Calcott, Ho and Guindon2012), treating ITS, nuLSU and mtSSU as separate partitions. Due to the lack of appropriate fossil evidence for the Hypotrachyna clade, we used the molecular evolutionary rate for ITS estimated for Melanelixia by Leavitt et al. (Reference Leavitt, Esslinger, Divakar and Lumbsch2012 b) (2·43×10−9 substitutions site−1 y−1) to estimate the time of the most recent common ancestor (MRCA) for all clades for the two datasets. Substitution rates for the other two markers (nuLSU and mtSSU) were co-estimated along the run under a lognormal prior and an exponential prior distribution. Exploratory analyses provided similar results between both analyses (results not shown), hence we selected the lognormal prior for final analysis.
In addition, for dataset 1 we implemented a secondary calibration constraining the split between the Parmeliopsis and Hypotrachyna clades at 62·99 million years ago (Ma) based on a recent study (Divakar et al. Reference Divakar, Crespo, Wedin, Leavitt, Hawksworth, Myllys, McCune, Randlane, Bjerke and Ohmura2015). For dataset 2, two secondary calibration points were used based on a recent study (Divakar et al. Reference Divakar, Crespo, Kraichak, Leavitt, Singh, Schmitt and Lumbsch2017): 1) 62·98 Ma was set at the split between the Nipponoparmelia and Parmeliopsis/Hypotrachyna/Myelochroa clades, and 2) 35·45 Ma at the Hypotrachyna node (excluding subgen. Longilobae/ H. fissicarpa). We excluded the subgen. Longilobae/H. fissicarpa lineage because it was not included in Divakar et al. (Reference Divakar, Crespo, Kraichak, Leavitt, Singh, Schmitt and Lumbsch2017). The resulting chronograms of both datasets were very similar (except the lack of support for the Laevigata group in dataset 2) and no significant differences were found in the divergence times (see Supplementary Material Fig. S1, available online). However, for the biogeographical analyses it is crucial to include outgroups with wide distributional ranges and Nipponoparmelia is restricted to East and South-East Asia. Thus, we considered dataset 1 most appropriate for the biogeographical analyses.
We ran four dating analyses with different assumptions (dataset 1 and 2, each with lognormal and exponential priors), and for each dating analysis two independent Markov chain Monte Carlo (MCMC) of 50 million generations were conducted, sampling one tree every 1000 generations. Chain mixing and convergence were evaluated in Tracer v.1.6 (Rambaut et al. Reference Rambaut, Suchard, Xie and Drummond2014), considering effective sample size (ESS) values >200 as a good indicator. Two runs were combined using the program LogCombiner v.1.8.0, and after a 25% burn-in cut-off a consensus tree was generated in TreeAnnotator. Median node age, 95% highest posterior density (HPD) interval and posterior probability (PP) were mapped on the maximum clade credibility tree. Phylogenetic trees were drawn using the program FigTree v.1.4.2 (Rambaut Reference Rambaut2009).
Ancestral area estimation
For the estimation of ancestral range probabilities we used the R package BioGeoBEARS (Matzke Reference Matzke2014), as explained in Nuñez-Zapata et al. (2017). Species distributions were obtained from selected literature (Hale Reference Hale1975; Elix Reference Elix1994; Divakar & Upreti Reference Divakar and Upreti2005; Sipman et al. Reference Sipman, Elix and Nash2009). The ranges for each species were assigned to eight major geographical regions (Takhtajan et al. Reference Takhtajan, Crovello and Cronquist1986), simplified to reflect the distributional ranges of Hypotrachyna species: Holarctic North America (A), Holarctic Eurasia (B), East Asia (C), Neotropical America (D), Paleotropical Africa and adjacent areas (E), Paleotropical Asia (F), extratropical South America (G) and Australasia (H). The species distribution range dataset used for the analyses is shown in Supplementary Material Table S1 (available online).
The analyses were performed using the dated tree, pruned to contain only one specimen of each monophyletic species. For non-monophyletic species (e.g. H. livida), each lineage was considered to be a distinct species. All ranges were allowed assuming a wide past distribution of the studied taxa and equal rates of dispersal between any two regions. Results of the ancestral area estimations (log-likelihood values) were compared using the Akaike information criterion (AICc) which gives a sense of the relative probability of each model. Likelihood ratio tests (LRT) were used to compare different biogeographical models.
Results
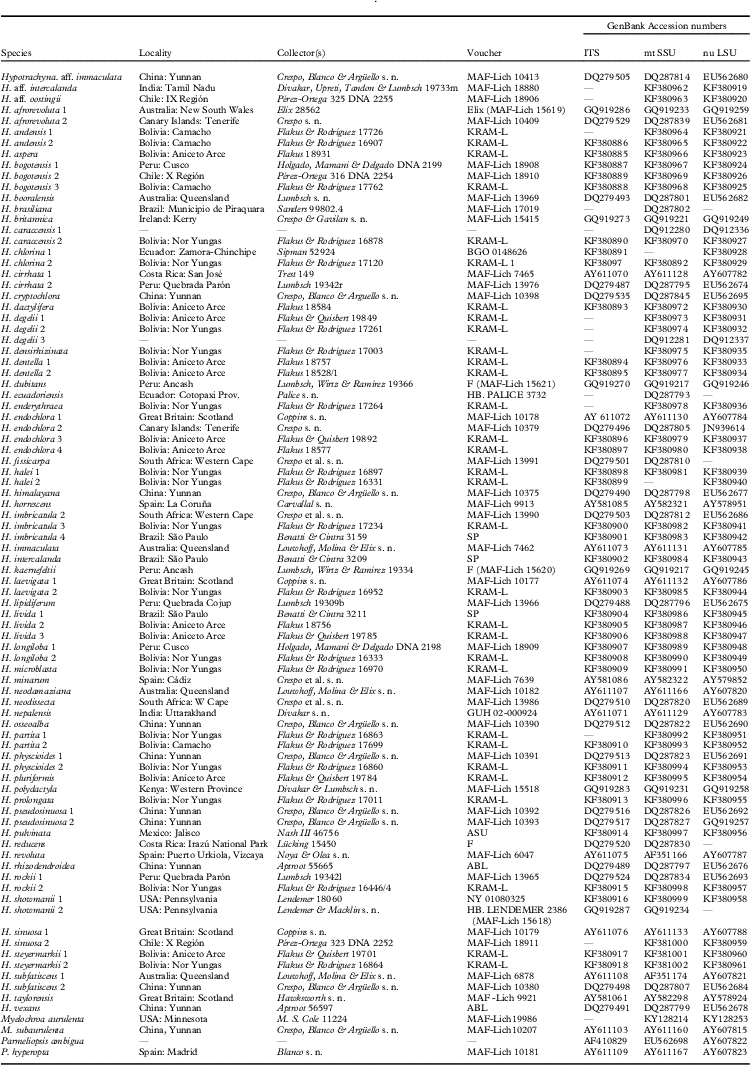
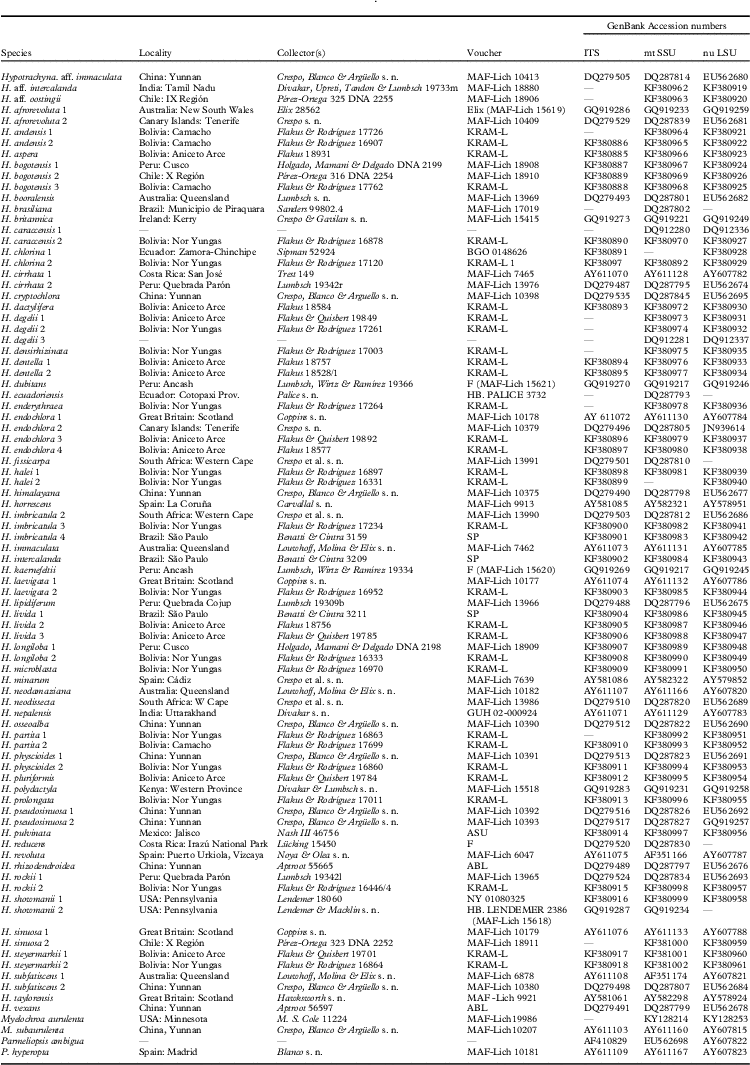
The aligned data matrix included 89 specimens (Table 1) and 2017 nucleotide position characters (ITS: 453; nuLSU: 835; mtSSU: 729). Similar topologies were obtained from ML (LnL=−15490·405) and B/MCMC (LnL=−15175·923) analyses of the multi-locus datasets and no conflict was found in the single-locus analysis (data not shown). For the MrBayes analysis, ESS reached high values (>300) for all parameters indicating adequate sampling of the posterior distribution. The best models were SYM+G, GTR+I+G and HKY+I+G for the ITS, nuLSU and mtSSU markers, respectively.
Specimens used in the study with location, reference collection detail and GenBank Accession numbers. Missing data are indicated with a dash (−)
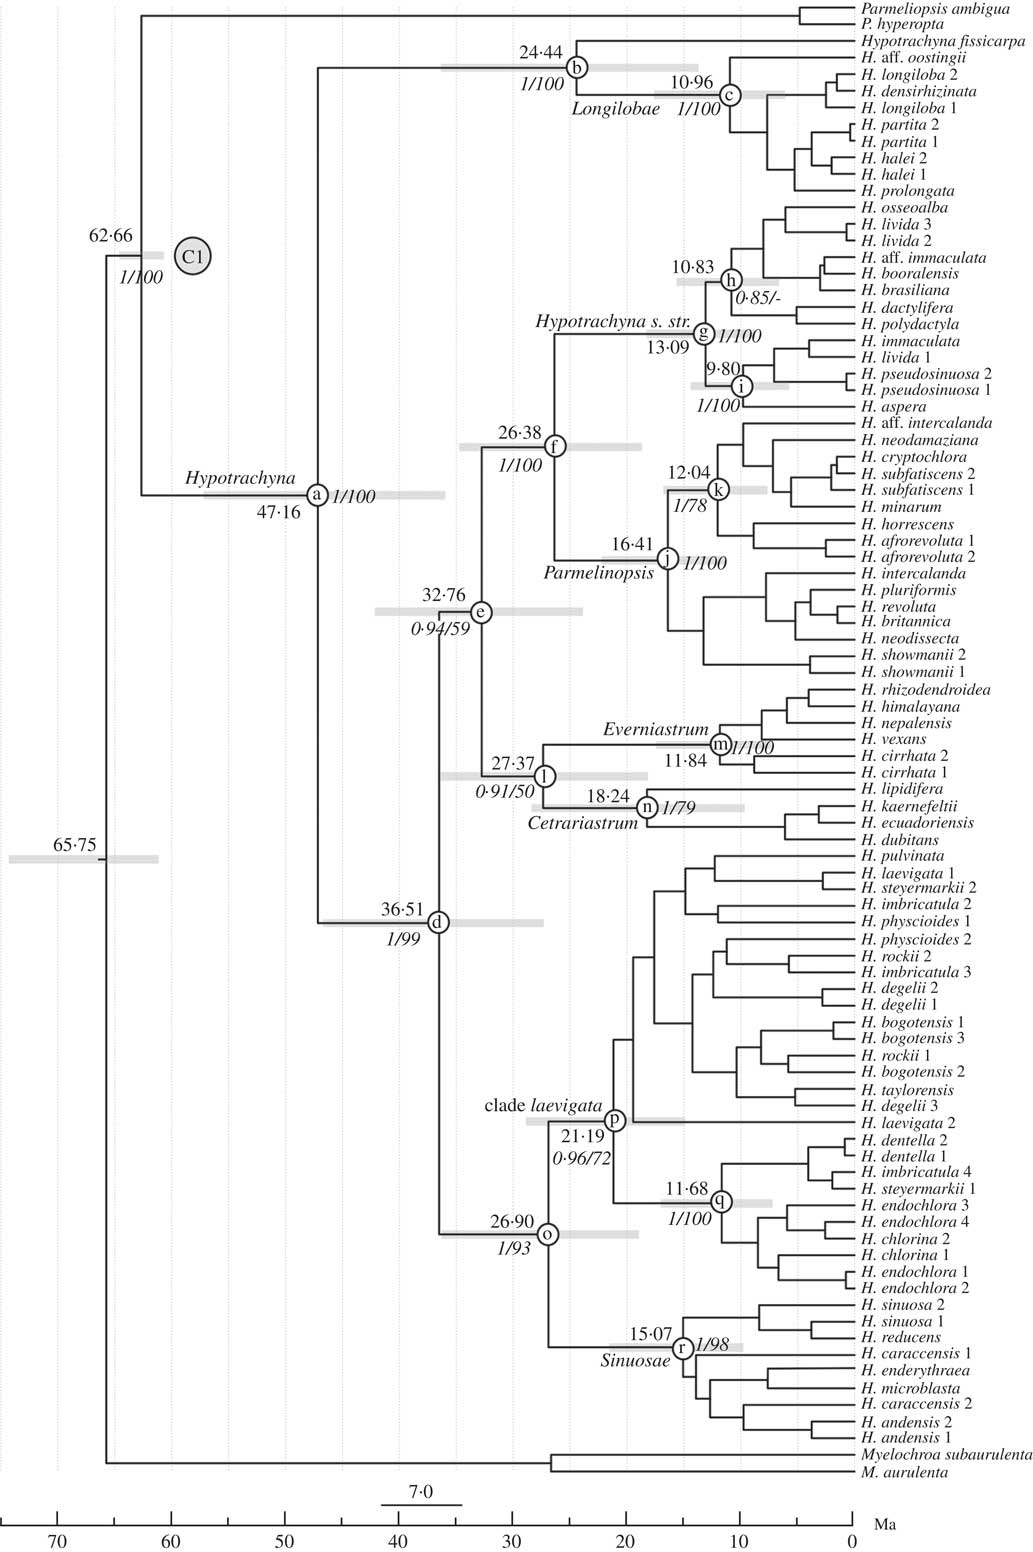
In the dated phylogenetic tree (Fig. 3), the six clades found in Divakar et al. (Reference Divakar, Crespo, Núñez-Zapata, Flakus, Sipman, Elix and Lumbsch2013) and a clade including H. laevigata and other species were recovered and well supported. The phylogenetic relationships were the same as in our previous study (Divakar et al. Reference Divakar, Crespo, Núñez-Zapata, Flakus, Sipman, Elix and Lumbsch2013) and are therefore not discussed further here.
Chronogram derived from the maximum clade credibility tree estimated using BEAST. Posterior probabilities (before the slash) and ML bootstrap values (after the slash) are indicated in italics at the nodes. 95% highest posterior density intervals (HPD) are shown as light grey bars. Letters inside circles denote nodes referred to in Table 2. Calibration point is indicated at the node, C1.
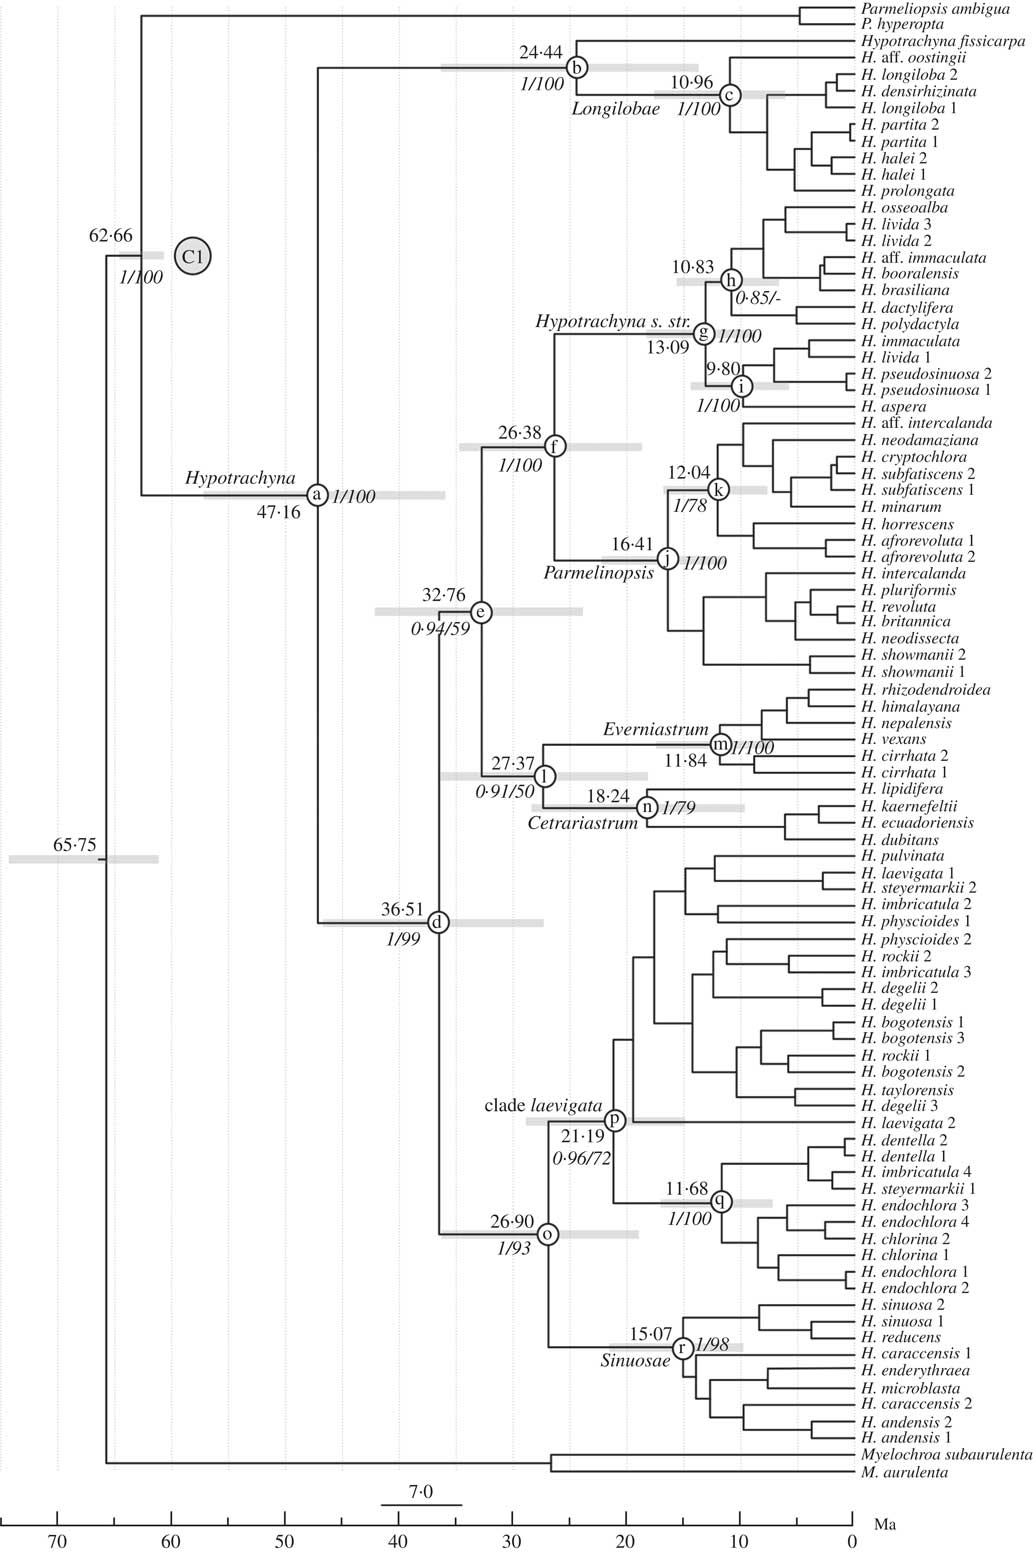
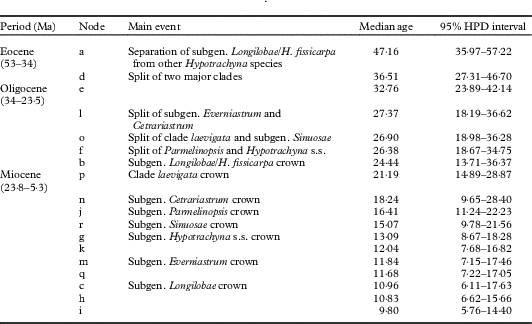
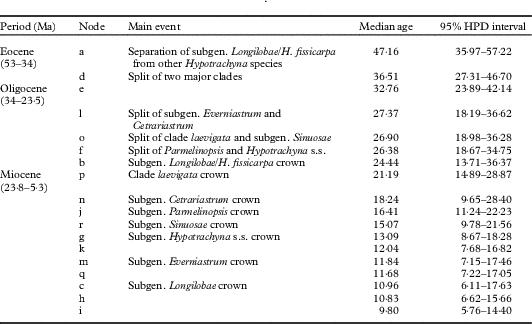
The median node ages and divergence date ranges (95% highest posterior density intervals, HPD) of the clades are shown in Table 2 and Fig. 3. The split of Hypotrachyna from Parmeliopsis occurred at 62·66 Ma (60·68–64·61Ma). The separation of the early diverging subgen. Longilobae Divakar et al./ H. fissicarpa lineage from other Hypotrachyna species was estimated at 47 Ma (35·97–57·22 Ma), whereas the split of two major clades (one including subgen. Sinuosae Divakar et al. and the H. laevigata clade, the other including subgen. Cetrariastrum, Everniastrum, Hypotrachyna s. str. and Parmelinopsis) was estimated at 36 Ma (27·31–46·70 Ma). The divergence analysis indicates that the separation of each of the subgenera in Hypotrachyna happened during the Oligocene, with subsequent diversification within each of the clades during the Miocene and the Pliocene (Table 2).
Divergence time estimations for Hypotrachyna obtained using the partitioned dataset (consisting of three markers: ITS, mtSSU and nuLSU) in BEAST analyses with molecular evolution rates for ITS (2·43×10−9 substitution site−1 y−1) and a secondary calibration constraining the split of the Hypotrachyna and Parmeliopsis clades at 62·99 Ma. Nodes refer to those in Figs 3 & 4. HPD=highest posterior density
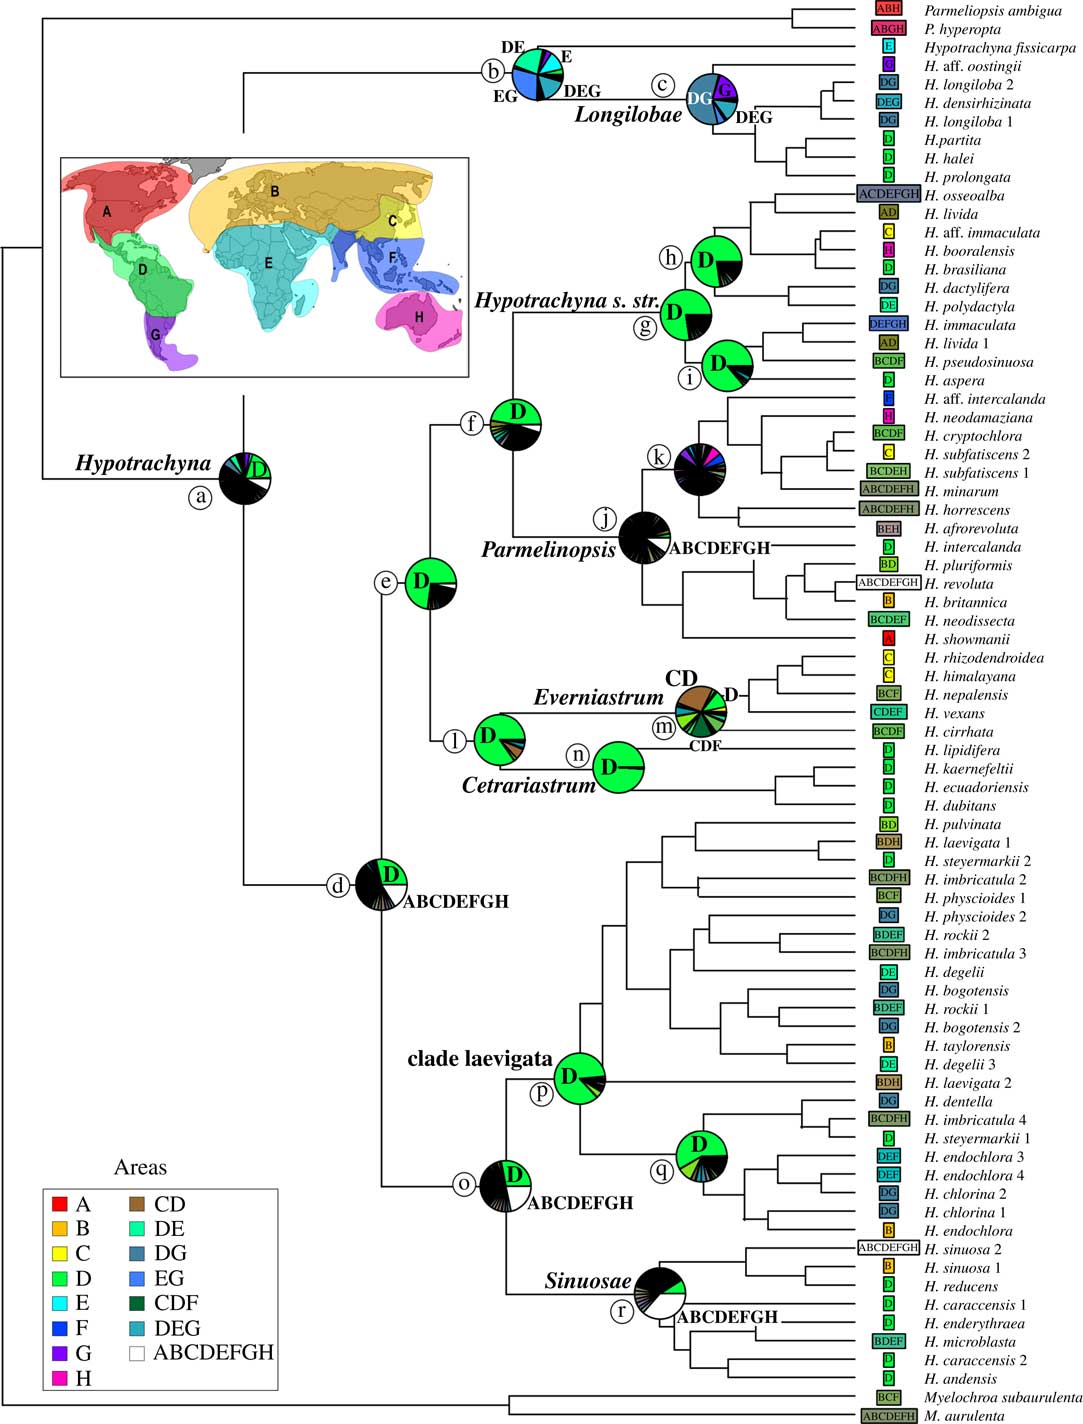
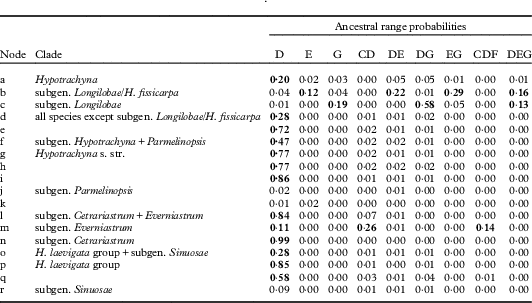
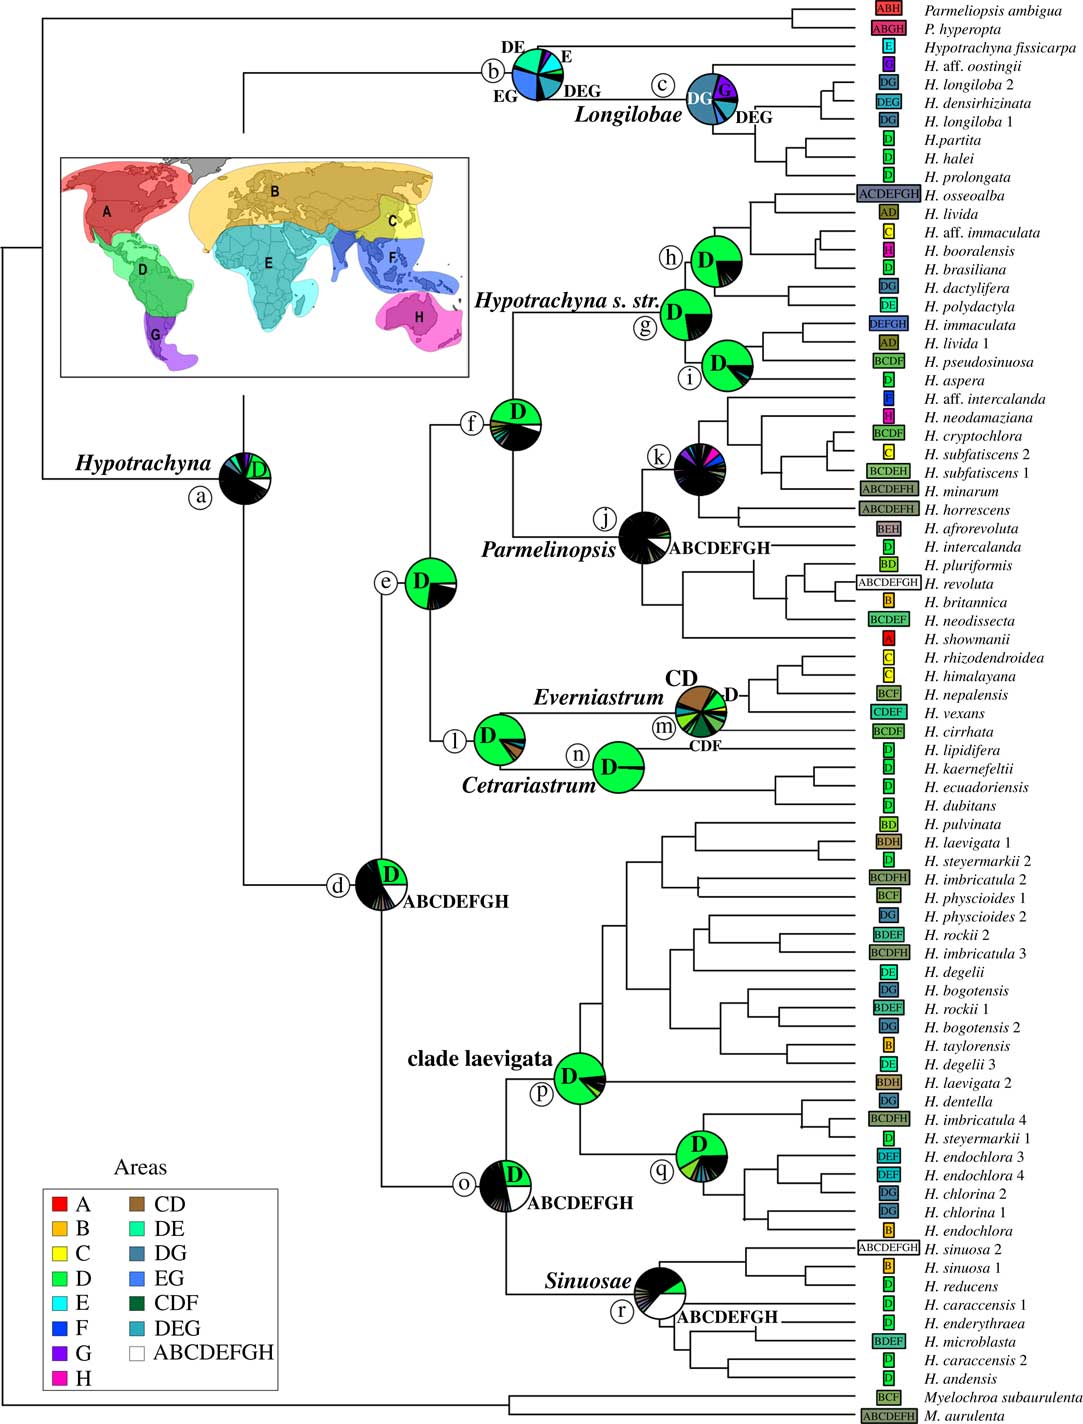
The results of the ancestral range estimations are summarized in Table 3 and Fig. 4. Overall, the most likely biogeographical model was the DEC model (LnL=−344·9, AICc=694·1, AICc weight=0·73) which, however, was not significantly better than the DEC+J model (LnL=−344·8, AICc=696·0, AICc weight=0·27). While the analysis did not yield unequivocal results for the ancestral area of the common ancestor of Hypotrachyna (node a), its ancestor being in Neotropical America was moderately supported (0·20, Table 3). The analysis rejected other areas as potential ancestral areas for the group. The ancestral area of subgen. Longilobae (node c) was estimated either as the Neotropics and extratropical South America (P=0·58), or extratropical South America (P=0·19), or the Neotropics, extratropical South America and Africa (P=0·13), with subsequent diversification primarily in the New World (Table 3, Fig. 4). The ancestral areas at node d, including all subgenera except subgen. Longilobae, did not yield conclusive results with only moderate support for the Neotropics (P=0·28). The ancestral area at node b, including subgen. Longilobae/H. fissicarpa, remained uncertain with moderate support for either extratropical South America (P=0·29), Neotropical America and Paleotropical Africa and adjacent areas (P=0·22), or Neotropical America, Paleotropical Africa and adjacent areas and extratropical South America (P=0·16). The ancestor of subgenera Hypotrachyna and Parmelinopsis (node f) as well as that of Hypotrachyna s. str. (node g) were estimated to have occurred in the Neotropics (P=0·47, P=0·77, respectively) with subsequent diversification of the latter in the Neotropics, whereas the results for subgen. Parmelinopsis (node j) were inconclusive.
Maximum likelihood estimations of geographical range evolution in Hypotrachyna according to the DEC model of ancestral ranges using a BioGeoBEARS analysis. Pie charts at the nodes show the relative probabilities of possible geographical ranges (see Table 3). For abbreviations of supported ancestral areas see Table 3. Sections of the pie charts in black correspond to the sum of areas that are <0·1 probability.
Ancestral range probabilities estimated with the DEC model in BioGeoBears, considering eight geographical areas. Areas with values ≥0·1 are in bold and highlighted in Fig. 4. Supported ancestral areas include: Neotropical America (D), Paleotropical Africa and adjacent areas (E), extratropical South America (G), East Asia and Neotropical America (CD), Neotropical America, Paleotropical Africa, and adjacent areas (DE), Neotropical America and extratropical South America (DG), Paleotropical Africa and adjacent areas, and extratropical South America (EG), East Asia, Neotropical America and Paleotropical Asia (CDF), Neotropical America, Paleotropical Africa and adjacent areas, extratropical South America (DEG). Nodes refer to those in Figs 3 & 4
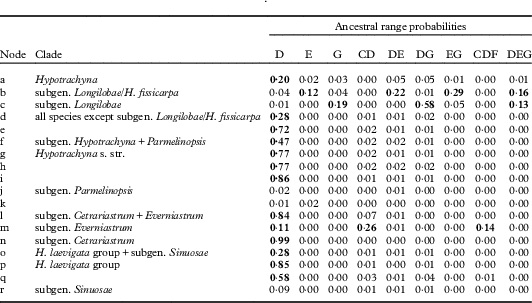
The ancestor of the clade including the subgenera Cetrariastrum and Everniastrum (node l) was estimated as having been in the Neotropics (P=0·84) as was the ancestral area of subgen. Cetrariastrum (node n, P=0·99). However, the ancestral area of Everniastrum (node m) remained uncertain with moderate support for either the Neotropics and East Asia (P=0·26), the Neotropics, East Asia and Palaeotropical Asia (P=0·14), or the Neotropics (P=0·11). The Neotropics were supported as the ancestral area for the H. laevigata group (node p, P=0·85) and node q (P=0·58) within the group, and the clade (node o) including the H. laevigata group and subgen. Sinuosae, although the latter with moderate support only (P=0·28). For subgen. Sinuosae (node r) the ancestral area estimation remained uncertain.
Discussion
Geological and climatic processes during the Tertiary had a severe impact on tropical ecosystems, leading to the current diversity and distribution patterns of tropical species (van der Hammen & Hooghiemstra Reference van der Hammen and Hooghiemstra2000; Pennington et al. Reference Pennington, Lavin, Prado, Pendry, Pell and Butterworth2004; Jaramillo et al. Reference Jaramillo, Rueda and Mora2006; Hoorn et al. Reference Hoorn, Wesselingh, ter Steege, Bermudez, Mora, Sevink, Sanmartin, Sanchez-Meseguer, Anderson and Figueiredo2010). To better understand the impact of these historical events on tropical lichens in a phylogenetic framework, we chose the pantropical genus Hypotrachyna which is diverse in all tropical areas and also extends to temperate areas, and for which a well-supported phylogenetic framework exists (Divakar et al. Reference Divakar, Crespo, Núñez-Zapata, Flakus, Sipman, Elix and Lumbsch2013). Our analyses solely rely on phylogenetic estimates inferred from DNA sequence data of extant taxa, since the fossil record of lichenized fungi is relatively poor or difficult to interpret (Taylor et al. Reference Taylor, Krings and Taylor2015; Lumbsch Reference Lumbsch2016; Kaasalainen et al. Reference Kaasalainen, Schmidt and Rikkinen2017; Lumbsch & Rikkinen Reference Lumbsch and Rikkinen2017) and we acknowledged this limitation.
Despite these caveats, our study strongly suggests that the major diversification of Hypotrachyna took place in the Neotropics. While the split of the major lineages happened primarily during the Eocene and Oligocene, the major diversification within those clades is estimated to have occurred during the Miocene, which is consistent with numerous other genera of lichenized fungi, including Flavoparmelia, Melanelixia, Melanohalea, Montanelia, Nephroma, Oropogon, Parmelina and Xanthoparmelia (Sérusiaux et al. Reference Sérusiaux, Villarreal, Wheeler and Goffinet2011; Amo de Paz et al. Reference Amo de Paz, Crespo, Cubas, Elix and Lumbsch2012; Divakar et al. Reference Divakar, Del Prado, Lumbsch, Wedin, Esslinger, Leavitt and Crespo2012; Leavitt et al. 2012 Reference Leavitt, Esslinger, Divakar and Lumbscha , c, 2013; Del-Prado et al. Reference Del-Prado, Blanco, Lumbsch, Divakar, Elix, Molina and Crespo2013; Lumbsch Reference Lumbsch2016; Núñez-Zapata et al. Reference Núñez-Zapata, Alors, Cubas, Divakar, Leavitt, Lumbsch and Crespo2017). This suggests that the timing of diversification events in tropical lineages of lichenized fungi does not differ from that in extratropical regions. It also confirms that the current diversity of lichen-forming fungi is mainly driven by Miocene diversification and to a lesser extent by more recent diversification during the Pliocene.
Our taxon sampling limitation (77 of 260 described species analyzed) might influence the divergence time estimates. Nonetheless, our taxon sampling included representatives of all the five subgenera known so far in the Hypotrachyna clade (Divakar et al. Reference Divakar, Crespo, Núñez-Zapata, Flakus, Sipman, Elix and Lumbsch2013), including the early diverging lineage (subgen. Longilobae/H. fissicarpa). We therefore consider the divergence time estimates reliable.
South America began to separate from Africa in the Early Cretaceous (135 Ma) with the opening of the South Atlantic Ocean at the latitude of Argentina and Chile. Northern South America and Africa remained connected until the mid-late Cretaceous (110–95 Ma), when a transform fault opened between Brazil and Guinea (Sanmartín & Ronquist Reference Sanmartin and Ronquist2004). As the Hypotrachyna clade originated much later (62·66 Ma) than the break-up of Africa and South America, the disjunct distribution patterns of species in the Southern Hemisphere cannot be explained by vicariance. Transoceanic long-distance dispersal is the most plausible explanation for these distributional ranges. This is also consistent with studies in other lichen-forming fungal clades (Otálora et al. Reference Otálora, Martínez, Aragón and Molina2010; Amo de Paz et al. Reference Amo de Paz, Crespo, Cubas, Elix and Lumbsch2012; Del-Prado et al. Reference Del-Prado, Blanco, Lumbsch, Divakar, Elix, Molina and Crespo2013; Lumbsch Reference Lumbsch2016; Núñez-Zapata et al. Reference Núñez-Zapata, Alors, Cubas, Divakar, Leavitt, Lumbsch and Crespo2017). Species producing amphigenous (symbiotic) diaspores (soredia or isidia) in particular have wide, intercontinental distributions. However, this requires confirmation as a number of species from which more than one sample was included did not form monophyletic groups. This is consistent with other genera of parmelioid lichens in which numerous cryptic species were found (Crespo & Pérez-Ortega Reference Crespo and Pérez-Ortega2009; Crespo & Lumbsch Reference Crespo and Lumbsch2010; Divakar et al. 2010 Reference Divakar, Figueras, Hladun and Crespob ; Del-Prado et al. Reference Del-Prado, Divakar and Crespo2011; Hodkinson & Lendemer Reference Hodkinson and Lendemer2011; Lumbsch & Leavitt Reference Lumbsch and Leavitt2011; Molina et al. 2011 Reference Molina, Del-Prado, Divakar, Sánchez-Mata and Crespoa , Reference Molina, Divakar, Millanes, Sánchez, Del-Prado, Hawksworth and Crespob ,; Nuñez-Zapata et al. Reference Nuñez-Zapata, Divakar, Del-Prado, Cubas, Hawksworth and Crespo2011; Leavitt et al. Reference Leavitt, Esslinger, Divakar and Lumbsch2012b, Reference Leavitt, Divakar, Ohmura, Wang, Esslinger and Lumbsch2015; Alors et al. Reference Alors, Lumbsch, Divakar, Leavitt and Crespo2016).
This study provides a preliminary insight into the diversification and historical biogeography of a major tropical clade of lichen-forming fungi. It also provides a framework for studying where and when the tropical diversity of lichen-forming fungi evolved. Additional sampling of taxa from currently poorly known regions, such as Africa, will allow us to better understand the shaping of Hypotrachyna diversity, and studies focusing on species delimitation of polyphyletic clades will assist in gaining a better understanding of distributional patterns of species in this clade.
It is our pleasure to dedicate this publication to our friend, colleague and mentor Professor Ana Crespo to celebrate her 70th birthday and an astonishing career influencing numerous colleagues, not only in lichenology but also botany and evolutionary biology. Financial support by the Ministerio de Ciencia e Innovación (CGL2013-42498-P) is gratefully acknowledged. Sequencing was carried out at the Unidad de Genómica (Parque Científico de Madrid, UCM).
Supplementary Material
For supplementary material accompanying this paper visit https://doi.org/10.1017/S0024282918000191