

Introduction
FoxReference Fox1 first synthesised phenylthiocarbamide while researching artificial sweeteners. He discovered accidentally that some individuals found the chemical intensely bitter, while others (including himself) found it as tasteless as chalk or paper. The non-taster condition was found to be transmitted in a simple autosomal recessive fashion.Reference Blakeslee2
Harris and KalmusReference Harris and Kalmus3 introduced a threshold method to describe the taste of phenylthiocarbamide. This method has since dominated research. The bitter taste of phenylthiocarbamide was correlated to the presence of the N-C ═ S (thiocyanate) chemical group.Reference Barnicot, Harris and Kalmus4 All substances containing this chemical group would be tasted as bitter by phenylthiocarbamide tasters. Kalmus,Reference Kalmus5 on the basis of the threshold method, argued that the phenylthiocarbamide tasting allele was an incomplete dominant. A different approach led to the same conclusion.Reference Reed, Bartoshuk, Duffy, Marino and Price6
Later studies began using another thiocyanate containing salt, 6-n-propylthiouracil (PROP) in place of phenylthiocarbamide. There have been many efforts to resolve the formal genetics of PTC/PROP tasting ability. Reed et al. Reference Reed, Namthakumar, North, Bell, Bartishuk and Price7 localised the 6-n-propyl-thiouracil (PROP) taste gene to chromosome five, with another region on chromosome seven influencing the phenotype. On the contrary, Kim et al. Reference Kim, Jorgenson, Coon, Leppert, Risch and Drayna8 isolated a region on chromosome 7q (7q35–36) which contained a single gene that encoded a member of the bitter taste receptor gene family (TAS2R). This region contains more than 150 other genes. Of these, nine were known to produce proteins for bitter taste receptors on the tongue. Three coding single-nucleotide polymorphisms, and giving rise to five haplotypes, have been identified. These haplotypes completely explain the bimodal distribution of phenylthiocarbamide taste sensitivity. This tasting ability is associated with Proline Alanine Isoleucine (PAV) haplotypes, and individuals with this haplotype have the highest sensitivity; this guanine nucleotide-binding protein (G-protein) has proline, alanine and valine amino acids at positions 49, 262 and 296, respectively. In contrast, the Alanine Valine Isoleucine (AVI) version of the gene, which makes up the vast majority of non-taster haplotypes, encodes an alanine, a valine and an isoleucine at these three positions, respectively. This locus explains 60–80 per cent of the phenotypic variation in phenylthiocarbamide tasting ability observed between individuals, and has been designated as TAS2R38. A secondary locus on chromosome 16p has also been reported to influence phenylthiocarbamide phenotype (Because they would find the taste of alcohol too bitter to be palatable).Reference Drayana, Coon, Kim, Elsner, Cromer and Otterud9
Phenylthiocarbamide taste sensitivity has many applications in health and disease. Pathology can reduce or increase the perceived bitterness of phenylthiocarbamide. A high frequency of non-tasters is observed amongst patients with epilepsy,Reference Pal, Sharma, Pathak, Sawhney and Prabhakar10, Reference Sharma11 schizophrenia,Reference Moberg, Roalf, Balderston, Kanes, Gur and Turetsky12 polynodular goitreReference Facchini, Abbati and Campagnoni13 and cervical cancer.Reference Ahuja, Reddy and Reddy14 Individuals who find phenylthiocarbamide bitter are suspected to reject substances such as thiourea, thiouracil and others containing the N-C ═ S chemical group, present in the Brassicaceae family of plants. Thiourea and its derivatives have been recognised as goitrogensReference MacKenzie and MacKenzie15 that inhibit thyroid function. Similarly, phenylthiocarbamide tasters would find the taste of cigarettes bitter, which could make strong tasters reject smoking and/or drinking (Because they would find the taste of alcohol too bitter to be palatable).Reference Fischer, Griffin and Kaplan16–Reference Di Carlo and Powers19
Motion sickness, or kinetosis, is a generic term used commonly to describe a syndrome provoked by many forms of travel, by fairground amusement rides and by various forms of motion. The syndrome is characterised by a long list of symptoms which may include pallor, drowsiness, salivation, cold sweating, disorientation, disequilibrium, dizziness, headache, nausea and vomiting. Continued exposure leads to adaptation through conditioning effects. Many possible mechanisms have been suggested to link motion exposure to motion sickness.Reference Reason and Brand20, Reference Yardley21
Sharma and Aparna,Reference Sharma and Aparna22 invoking the threshold model to explain the genesis of motion sickness, have found that ears and eyes are the most important receptors of provocative motion causing motion sickness. The sense of balance which is disturbed in motion sickness is maintained by the nervous system, which processes many types of information supplied by sensor receptors from different parts of the body. SharmaReference Sharma23 had earlier shown that genetic factors are involved in motion sickness susceptibility, reporting a very high concordance rate for motion sickness susceptibility in monozygotic compared with dizygotic twins. It has been observed that individuals susceptible to motion sickness also exhibit greater sensitivity to taste and smell, compared with non-susceptible individuals.Reference Sharma and Aparna22
Phenylthiocarbamide tasting ability has also been correlated with the general tasting ability of an individual; the latter may affect the scalar component of the former and vice versa. For example, the bitterness of dilute caffeine is more intense to phenylthiocarbamide tasters.Reference Hall, Bartoshuk, Caine and Stevens24 This point has been reinforced by the results of a study using saccharine and sugar.Reference Bartoshuk25 These studies imply that phenylthiocarbamide taste sensitivity may serve as a probe for genetic variation in bitter taste sensitivity.
The phenylthiocarbamide tasting threshold distinguishes non-tasters (i.e. raised threshold) from tasters (i.e. lowered threshold). Susceptibility to motion sickness is known to correlate with general sensitivity to taste and smell.Reference Sharma and Aparna22 The present study is the first attempt to link quantified phenylthiocarbamide bitter taste recognition threshold with motion sickness susceptibility. The authors set out to test the hypothesis that individuals exhibiting higher phenylthiocarbamide taste acuity, measured in terms of ability to taste weaker solutions of phenylthiocarbamide (signified by higher threshold solution numbers), would show a greater susceptibility to motion sickness, compared with phenylthiocarbamide non-tasters and weak tasters.
Material and methods
The study was conducted on 291 teenage Rajput children (146 males and 145 females; age range 13–19 years) drawn from various schools in Dadahu, Deed Panār and Sangrah in the Sirmour district of Himachal Pradesh. The Sirmour district extends between 30°22′30″ and 31°01′20″ north latitude and 77°01′12″ and 77°49′40″ east longitude at an altitude of 3643 m. The district is predominantly mountainous.
Rajputs are the major ethnic group of the area, and in previous times constituted the martial and princely caste of society. Ethnically, they predominantly belong to Indo-Aryan and Indo-Afghan stock of the Mediterranean subdivision of the Caucasoid race, with little admixture with other ethnic strains. There is a little mongoloid admixture in Himalayan Rajputs. Gurkhas and Tibetans are the major mongoloid populations in the region. However, Rajputs and these populations are separate endogamous groups, with negligible gene flow between them. Marriages are decided by the parents of the prospective spouses. Since Rajputs constitute a separate endogamous group, the data on prevalence of motion sickness and phenylthiocarbamide tasting ability are specific to this population.
The people are predominantly vegetarian. Wheat, maize and rice form their staple foods; they also eat seasonal vegetables and pulses.
The study subjects were personally interviewed with the help of an interview schedule and questionnaire, in order to investigate their susceptibility to motion sickness. The interview schedule and questionnaire used in this study were altered versions of those used earlier by Sharma and Aparna.Reference Sharma and Aparna22
The interview had two major parts. The first part was directed at all subjects included in the study, while the second part was directed only at those susceptible to motion sickness.
The inclusion or exclusion of the subject was based on their response to the question of how often they had travelled in various types of vehicles. Those who had not travelled five or more times in at least one of the types of vehicle listed (e.g. car, bus, train, aeroplane, ship) were excluded from the study at the initial stage of data collection. The inclusive criterion was that the subject should have travelled five or more times in one of the various types of vehicles listed.
Subjects were earmarked as motion sickness susceptible if they reported signs and symptoms of motion sickness on these occasions. They were also asked about a large number of factors related to motion sickness, e.g.: frequency of sickness, nausea and vomiting; severity of motion sickness symptoms; general irritable sensitivity to petrol, diesel fumes, unpleasant odours, smoke etc; and the presence or absence of disorders such as spatial disorientation, vertigo, migraine, persistent stomach trouble, vision defects and hearing defects. Motion sickness susceptible individuals were asked about the frequency and chronology of their motion sickness signs and symptoms, and about acclimatisation to motion sickness (if any).
The questions pertaining to choice of foods and eating habits before traveling included avoidance of fried/heavy/stuffy foods; travel with full stomach/light stomach/empty stomach; taste preference: salty/sweet/no preference; and whether food eaten before travelling acted as a vomiting trigger.
Data analysis was limited to studying the interrelationship between phenylthiocarbamide taste sensitivity and motion sickness susceptibility. (Detailed epidemiological data on motion sickness will be published in another paper.)
Care was taken not to include blood relatives in the study. If two or more brothers or sisters were studying in the same school, only one was included in the study.
Phenylthiocarbamide taste sensitivity was measured by administering a serial dilution of a freshly prepared phenylthiocarbamide solution, following the method of Harris and Kalmus.Reference Harris and Kalmus3 Solution one had 1300 mg of phenylthiocarbamide powder dissolved in 1 l of water; solution two was half as concentrated as solution one, and so on to solution 13. First, the most dilute solution (number 13; 2.08 × 10⁻⁶ M) was administered. If the subject did not perceive a bitter taste, then the next higher concentration of solution (number 12) was given. This procedure was followed until the most concentrated solution was used (number one; 8.54 mM). If the subject could not perceive solution one, their taste threshold was recorded as zero. A higher taste sensitivity was indicated by the ability to taste phenylthiocarbamide at a higher threshold solution number. When the subject perceived a bitter taste, he or she was submitted to a blind sorting test that required distinguishing phenylthiocarbamide solutions at the perceived concentration, versus natural water, in order to confirm the taste score.
Taster and non-taster phenotypes were distinguished by studying the frequency distribution of their phenylthiocarbamide threshold values. The antimode value of the bimodal curve was chosen as the cut-off value between tasters and non-tasters. If the threshold value was at antimode value or below, then the subject was designated a non-taster; if the threshold value was higher than the antimode value, the subject was designated a taster. Non-taster phenotype individuals would always be homozygous genotypically for the recessive allele ‘t’ (i.e. tt). The frequency of the non-taster allele ‘t’ was calculated by taking the square root of the percentile frequency of non-tasters (√tt). The frequency of the taster allele ‘T’ was calculated by subtracting the frequency of the non-taster ‘t’ allele from the unity (i.e. T = 1 − t), following the Hardy–Weinberg principle. Penrose's bimodal distribution test indexReference Penrose26 was calculated by dividing the difference between the mean thresholds of tasters and non-tasters by the mean standard deviation (SD) of the two groups.
The frequency and quantitative data on phenylthiocarbamide taste thresholds and motion sickness susceptibility were analysed statistically by employing descriptive statistical tools such as mean, median, quartiles and SD. The significance of differences between these groups was tested by two-tailed t-tests, Fisher's exact test, and the contingency table chi-square test. Although there may be concern about assumptions of normality and heteroscedasticity of the data, the t-test is considered robust enough to allow for departures from its theoretical assumptions.Reference Zar27 However, the Mann–Whitney U test was also used to test the differences in the frequency distribution of phenylthiocarbamide taste thresholds between motion sickness susceptible and non-susceptible individuals. The association between the qualitative dichotomies of taster versus non-taster status and susceptibility to motion sickness was made by using Yule's coefficient, because here we can determine not only the nature of the association (i.e. whether the attributes are positively or negatively associated or independent) but also the extent to which two attributes are associated. Yule's coefficient is denoted by the symbol Q. The value of this coefficient lies between ±1. The normal deviate (Z) test was used to evaluate differences in the proportions. The terms ‘prevalence and incidence’ are used loosely as interchangeable terms, and not in their strict epidemiological sense.
Results
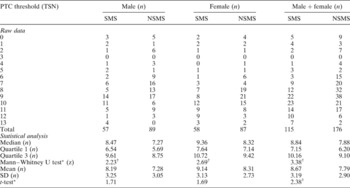
Table I summarises subjects' phenylthiocarbamide taste threshold data in relation to their sex and motion sickness susceptibility.
Subjects' phenylthiocarbamide taste thresholds, by sex and motion sickness susceptibility

* Comparing motion sickness susceptible and non-susceptible subjects; †p < 0.05. PTC = phenylthiocarbamide; TSN = threshold solution number; SMS = susceptible to motion sickness; NSMS = not susceptible to motion sickness; SD = standard deviation
The median and mean phenylthiocarbamide threshold scores of motion sickness non-susceptible individuals were less than those of susceptible individuals, in both sexes and in the pooled sample. Little difference was seen between means and medians. Higher threshold solution number values indicate lower thresholds but higher taste sensitivities. The Mann–Whitney U test rejects the null hypothesis of μ1 = μ2, thus confirming the existence of differences in the distributions of phenylthiocarbamide thresholds, comparing motion sickness susceptible and non-susceptible individuals. These differences were significant in males, females and in the pooled data. These differences were not only observed for frequency distribution but also for medians and means. In the total sample (i.e. sexes pooled), the mean phenylthiocarbamide threshold score of motion sickness susceptible individuals was higher than that of their non-susceptible counterparts. These differences could not be assigned to sex differences in the thresholds of males and females, because the sexes were equally distributed in both the groups. To enable sex correction, the percentage differences between threshold solution number means of the two sexes were calculated (i.e. mean threshold solution number of females − mean threshold solution number of males/mean threshold solution number of males). The female threshold solution number mean was 11.6 per cent higher than that of males in motion sickness susceptible individuals, and 14.1 per cent higher in non-susceptible individuals. These results indicate that motion sickness susceptible females were 11.6 per cent more sensitive than motion sickness susceptible males in their mean ability to taste phenylthiocarbamide. Deducting this fraction from the phenylthiocarbamide threshold solution number value of each motion sickness susceptible female, the female threshold solution number value was converted to a value independent of the fraction attributed to the female sex, in the motion sickness susceptible category. Similar sex correction was utilised for data from motion sickness non-susceptible individuals. Even after applying these sex corrections, the mean threshold differences of the total sample, comparing motion sickness susceptible and non-susceptible individuals, were significant. The mean quantitative phenylthiocarbamide taste sensitivity of motion sickness susceptible individuals was approximately 13–25 per cent greater than that of non-susceptible individuals.
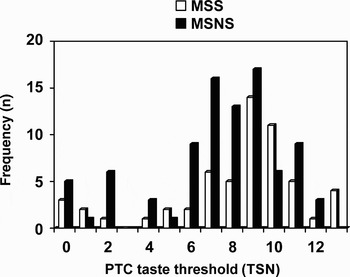
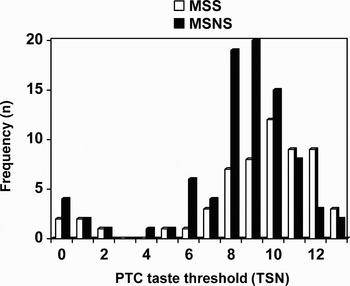
Figures 1 and 2 present frequency data for the phenylthiocarbamide threshold scores of males and females, respectively. Distributions of phenylthiocarbamide threshold solution number scores show significant bimodality, with a cut-off value of three, which separates the tasters (i.e. threshold solution number ≥ four) from the non-tasters (i.e. threshold solution number ≤ three), as explained in the Materials and Methods section.
Frequency of differing phenylthiocarbamide taste thresholds in motion sickness susceptible (MSS) and motion sickness non-susceptible (MSNS) male subjects. TSN = threshold solution number

Frequency of differing phenylthiocarbamide taste thresholds in motion sickness susceptible (MSS) and motion sickness non-susceptible (MSNS) female subjects. TSN = threshold solution number

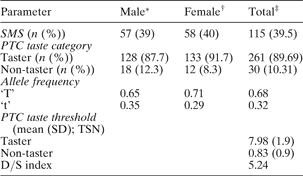
Table II presents data on the prevalence of motion sickness, frequency of phenylthiocarbamide tasting and non-tasting ability, allele frequency and mean phenylthiocarbamide taste thresholds. All the subjects included in the study had travelled in a vehicle five or more times. The incidence of motion sickness was slightly higher in females (40 per cent) than in males (39 per cent). The frequency of phenylthiocarbamide tasters was higher in motion sickness susceptible individuals than in non-susceptible individuals. The estimated mean of phenylthiocarbamide threshold solution number scores for tasters was 7.98 (SD 1.86) and for non-tasters was 0.83 (SD 0.87). The Penrose bimodal distribution test index in this study was 5.24, indicating a bimodal distribution of phenylthiocarbamide threshold scores. The frequency of the taster allele (0.68) was much higher than that of the non-taster allele (0.32).
Subjects' motion sickness susceptibility, PTC taste ability, allele frequency and PTC taste threshold, by sex

* n = 146; †n = 145; ‡n = 291. PTC = phenylthiocarbamide; SMS = susceptible to motion sickness; ‘T’ = taster; ‘t’ = non-taster; SD = standard deviation; TSN = threshold solution number; D/S = Bimodal distribution test
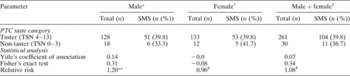
Table III presents the incidence of motion sickness among phenylthiocarbamide tasters and non-tasters. Yule's coefficient of association and the relative risk index values, also shown, indicate that qualitative dichotomisation of phenylthiocarbamide data into taster and non-taster categories had a poor and insignificant association with the occurrence of motion sickness; only males show some positive association between the two.
Subjects' PTC taste ability categorised by taste phenotype, by sex and motion sickness susceptibility

* n = 146; †n = 145; ‡n = 291. **χ2 = 0.28; §χ2 = 0.02; #χ2 = 0.11. PTC = phenylthiocarbamide; SMS = susceptible to motion sickness; TSN = threshold solution number
To extend the above results on association, individuals were further categorised, on the basis of their phenylthiocarbamide threshold scores, into three categories: non-tasters and weak tasters (threshold solution numbers zero to five), medium threshold tasters (threshold solution numbers six to 10) and super threshold tasters (threshold solution numbers 11 to 13). These subcategories were based on the following rationales: (Reference Fox1) the threshold solution number range amongst tasters was too large, varying from four to 13; and (Reference Blakeslee2) there was the likelihood of overlap between the threshold solution number distributions of phenylthiocarbamide tasters and non-tasters (more details of this categorisation are given in the Discussion section). Results on the incidence of motion sickness in relation to the above three taste categories, for the two sexes and the pooled sample, are presented in Table IV. This Table clearly shows that the incidence of motion sickness was highest among the super threshold tasters, in both sexes as well as in the pooled sample. The normal deviate (Z) tests showed significant differences, at a 99 per cent confidence limit, in the incidence of motion sickness between medium and super threshold tasters, in females and in the pooled sample. However, Z tests showed insignificant differences between non-tasters + weak tasters and medium threshold tasters, for motion sickness susceptible individuals.
Subjects' PTC taste ability categorised by taste degree, by sex and motion sickness susceptibility

* n = 146; †n = 145; ‡n = 291. **p < 0.01. PTC = phenylthiocarbamide; SMS = susceptible to motion sickness; Z = normal deviate test; TSN = threshold solution number
The above picture may further be improved by excluding subjects with a threshold solution number of 11 from the category of super threshold tasters (‘supersensitive’ tasters) and merging them with the average taster category (i.e. by extending this category by one threshold solution number, to become four to 11), because there was no higher risk of motion sickness among subjects with a threshold solution number of 11, compared with those with a threshold solution number of 10. By reanalysing data on the basis of this alteration, we find more interesting results. The ratio of motion sickness susceptible to motion sickness non-susceptible individuals becomes 1:1.7 for the non-tasters (threshold solution numbers zero to three) and weak + medium threshold tasters (threshold solution numbers four to 11), but the trend is reversed for the supersensitive tasters (threshold solution numbers 12 and 13), in whom the ratio is 2:1 (see Table I). These new results seem to demonstrate that there is no difference in motion sickness susceptibility between weak + medium tasters and non-tasters, but there is twice the risk of motion sickness for supersensitive tasters.
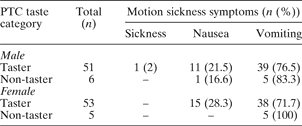
Table V presents subjects' phenylthiocarbamide tasting ability in relation to their reported experience of various symptoms of motion sickness. Table VI presents subjects' reported experience of migraine and vertigo, in relation to motion sickness susceptibility and phenylthiocarbamide tasting ability. Past experiences of migraine and vertigo or spatial disorientation occurred less frequently among non-tasters compared with tasters, especially in motion sickness non-susceptible individuals.
Subjects' PTC taste ability, by reported history of motion sickness symptoms

PTC = phenylthiocarbamide
Subjects' PTC taste ability, by motion sickness susceptibility and reported history of migraine and vertigo

PTC = phenylthiocarbamide; SMS = susceptible to motion sickness; NSMS = not susceptible to motion sickness
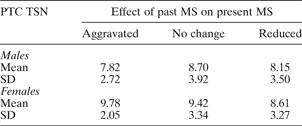
Past experience of motion sickness may act as a triggering factor during subsequent journeys.Reference Blakeslee2Reference Blakeslee2 Such past experience may also lead to adaptation or acclimatisation to motion sickness, as a result of habituation due to continued exposure to motion stimuli. Table VII presents the mean phenylthiocarbamide threshold solution numbers of individuals with varying degrees of motion sickness adaptation. Subjects' present motion sickness response, compared with their past response, was divided into three categories: aggravated, no change and reduced. The finding of an aggravated motion sickness response has not been reported by previous studies. These results do not show any distinct relationship or association between altered motion sickness response and mean phenylthiocarbamide threshold solution number among males. However, among females, the mean phenylthiocarbamide threshold solution number score was lower in individuals who had become either immune or less susceptible to motion sickness, compared with those showing no such adaptation. Adaptation means that the brain has the capacity to change the neural responses of a particular brain area responsible for a particular attribute, either qualitatively or quantitatively. This capacity is termed ‘plasticity’, and may be responsible for the reduced phenylthiocarbamide tasting acuity and motion sickness susceptibility seen with ageing.
Subjects' PTC taste threshold numbers, by reported effect of past motion sickness on present motion sickness severity

PTC = phenylthiocarbamide; TSN = threshold solution number; MS = motion sickness; SD = standard deviation
Discussion
The results of the present study support the proposed hypothesis that phenylthiocarbamide taste sensitivity, as measured quantitatively using thresholds, is greater in individuals prone to motion sickness. Phenylthiocarbamide tasting ability is a threshold trait. There are two types of threshold: detection threshold, the lowest concentration at which a taste can be detected; and recognition threshold, the lowest concentration at which taste quality can be recognised.Reference Bartoshuk28 Phenylthiocarbamide tasting ability is a recognition threshold trait, as the individual must recognise that the stimulus of phenylthiocarbamide is bitter. Any other type of recognition stimulus (e.g. sweet) should ideally not be included in the category of tasting phenylthiocarbomide bitter, because this may be due to a gene mutation at the phenylthiocarbamide locus, resulting in taste dysfunction; alternatively, some other factor may cause such a taste dysfunction. In a strict sense, it is a misnomer to label an individual as a phenylthiocarbamide non-taster, because the non-taster category also includes those who can recognise the bitter taste of phenylthiocarbamide at concentrations higher than the antimode. There are two continuous, bimodal phenotypic distributions of phenylthiocarbamide tasting ability, separated by a cut-off point (the antimode). In Figures 1 and 2, the first distribution, from threshold solution numbers zero to three, represents non-tasters, who are homozygous for the phenylthiocarbamide non-taster allele. The second distribution represents individuals who are either homozygous or heterozygous for the phenylthiocarbamide taster allele.
These recognition thresholds were used to divide individuals into three categories: non- and weak tasters; medium threshold tasters; and super threshold (supersensitive) tasters. The phenylthiocarbamide tasting threshold is correlated with the phenylthiocarbamide locus. This categorisation differs from that developed for psychophysical studies of phenylthiocarbamide and 6-n-propyl-thiouracil.Reference Bartoshuk, Duffy and Miller29 These studies used bitterness intensity as a criterion to separate super tasters from medium tasters. Bitterness intensity may vary between individuals having the same phenylthiocarbamide threshold. BartoshukReference Bartoshuk30 showed that the average 6-n-propyl-thiouracil function (magnitude estimates) varies from one to 10, at 0.0032 M 6-n-propyl-thiouracil. Bartoshuk also suspected that super tasters might have two dominant alleles while medium tasters might have one dominant allele. However, this psychophysical criterion of rating 6-n-propyl-thiouracil has not been found to correlate with the phenylthiocarbamide locus, because of clear evidence that thresholds are related to the TAS2R38 locus.Reference Prodi, Drayna, Forabosco, Palmas, Maestrale and Piras31 Therefore, our method of categorising individuals into weak, medium and super threshold tasters, on the basis of the classical threshold method, was more scientific and relevant to the phenylthiocarbamide locus. The threshold method has been criticised by psychophysicists on the basis that it varies in inverse proportion to the size of the area stimulated.Reference McBurney and Pfaffmann32 This objection can be overcome by using the same quantity of phenylthiocarbamide solution for taste testing. Although the extent of bitterness at various thresholds may differ between individuals, there should be no error in perceiving the bitter taste of phenylthiocarbamide. Our categorisation of non-tasters with weak tasters (i.e. threshold solution number ≤ five) also addressed another objection to the threshold method, i.e. that the false antimode may bring non-tasters into the taster range and vice versa.
The rationale for choosing a threshold score cut-off of ≤ five (between non-tasters + weak tasters and medium threshold tasters) was also based on carefully reasoned criteria, informed by various published studies on phenylthiocarbamide taste sensitivities. The antimode in these studies varied between three and five. Hence, a threshold score of five was kept as a cut-off point. A recent genetic study has shown that a threshold cut-off point of five serves as a good indicator to distinguish non-tasters and low threshold tasters from medium threshold tasters. Prodi et al. Reference Prodi, Drayna, Forabosco, Palmas, Maestrale and Piras31 analysed the correlation between phenylthiocarbamide haplotypes and phenylthiocarbamide taste threshold scores, and showed that the presence of many Alanine Valine Isoleucine/Alanine Valine Isoleucine (AVI/AVI) homozygotes was associated with low phenylthiocarbamide taste threshold scores. They also found a large number of heterozygous individuals with Alanine Valine Isoleucine/Proline Alanine Valine and homozygous Proline Alanine Valine/Proline Alanine Valine, genotypes among the subjects with scores above the cut-off value of 4.5. Although the cut-off value may vary from population to population, the value of five seems a conservative cut-off point to distinguish non- and weak tasters from medium and super threshold tasters. By using this approach, we found that the number of super threshold tasters was double that of non- and weak tasters, in motion sickness susceptible individuals. In contrast, no such dichotomy was observed in motion sickness non-susceptible individuals, in whom the frequency of the two categories was equal, at 14.2 per cent each. These results confirm the hypothesis that motion sickness susceptibility is much greater in supersensitive phenylthiocarbamide tasters.
The incidence of motion sickness in Rajput Indians of the Sirmour district of Himachal Pradesh seems to be comparatively high; 39.5 per cent of subjects gave a history of motion sickness, with, interestingly, no significant sex differences (39 per cent of males vs 40 per cent of females). In north-west India, Sharma and AparnaReference Sharma and Aparna22 reported a motion sickness incidence of 32 per cent in females and 20 per cent in males. The higher incidence in the present sample may be due to the fact that our subjects were inhabitants of a mountainous area, where travel was more likely to provoke motion sickness. Previous studiesReference Sharma and Aparna22, Reference Money33 have shown that motion sickness affects more people when the journey is difficult and involves hilly terrain and uncomfortable vehicles.
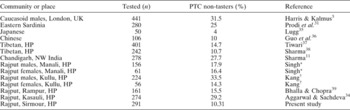
The higher incidence of motion sickness found in the present study may also be correlated with the higher frequency of phenylthiocarbamide tasters (89.7 per cent) in the regional population sampled. SharmaReference Sharma11 reported a 27.7 per cent frequency of non-tasters in the Chandigarh region of India. Aggarwal and SachdevaReference Aggarwal and Sachdeva34 found a 29.2 per cent frequency of non-tasters among Rajputs in the Kasauli region of Himachal Pradesh. The frequency of non-tasters among Rajputs of Himachal Pradesh varies from 10 to 30 per cent. Mongoloid populations have a low frequency of non-tasters, varying between 4 and 15 per cent (see Table VIII). Incidentally, in the present sample, the incidence of a past history of migraine and vertigo or spatial disorientation was higher in phenylthiocarbamide tasters than in non-tasters.
Incidence of PTC non-tasters in different populations

* D Singh, unpublished MSc dissertation, Panjab University, 1964; †HK Kang, unpublished MSc dissertation, Panjab University, 1965. HP = Himachal Pradesh, India
To address the crucial question of the role of the TAS2R38 locus in motion sickness susceptibility, one needs a general understanding of bitter taste receptors and their molecular pathways. A literature review indicated that the bitter taste sense is determined by taste receptors present on the tongue and palate epithelium (see Lindemann,Reference Lindemann40 Chandrashekar et al. Reference Chandrashekar, Mueller, Hoon, Adler, Feng and Guo41 and Matsunami et al. Reference Matsunami, Montmayeur and Buck42). Furthermore, these studies reveal that such taste receptors are encoded by a large family of seven transmembrane G protein coupled genes, TAS2Rs, as shown by both in vitro and in vivo functional assays. Experimental studies have also revealed that multiple TAS2R genes are expressed in each bitter taste receptor cell.Reference Chandrashekar, Mueller, Hoon, Adler, Feng and Guo41 Twenty-five putatively functional TAS2R genes and eight pseudo-genes have been mapped on chromosomes five, seven and 12.Reference Shi, Zhang, Yang and Zhang43 The phenylthiocarbamide locus is a part of this conglomeration.
Such evidence may lead to a number of hypotheses, although these may not be mutually exclusive. First, alleles at the TAS2R38 locus, through collusion with other TAS2R genes, might affect an individual's neural threshold, triggering a panic reaction to hostile motion. Second, the TAS2R38 gene may be a sensitive genetic marker which correlates with an individual's neural sensitivity. This neural sensitivity differs from individual to individual, since the human sensory system processes diverse sensory inputs as the individual is exposed to various cultural, biological and environmental experiences throughout their life. It is now accepted that individuals who are born sensitive to phenylthiocarbamide and 6-n-propyl-thiouracil may become less sensitive with age.Reference Bartoshuk, Duffy, Reed and Williams44–Reference Mennella, Pepino and Reed46 A similar relationship is observed for motion sickness; individual susceptibility also decreases with increasing age, due to habituation and acclimatisation. These observations lend support to the proposed hypotheses interlinking these two separate attributes via neurological pathways which may be genetically or biologically interrelated. Explaining the genesis of motion sickness on the basis of a threshold model, Sharma and AparnaReference Sharma and Aparna22 found that sensitivity to smells and bad odours, the sex of the individual, and equilibrium disorientation were important determinants of motion sickness. Genetic factors associated with these neurological impulses and receptors determined how an individual would respond to a panic situation created by hostile motion. Sharma and Aparna also observed ethnic and cultural variations in motion sickness susceptibility.
• Fox synthesised phenylthiocarbamide while researching artificial sweeteners, and discovered accidentally that some individuals tasted the chemical as intensely bitter, while others found it tasteless
• Phenylthiocarbamide taste sensitivity has many applications in health and disease. Pathology can reduce or increase the perceived bitterness of phenylthiocarbamide
• The present study is the first attempt to link quantified phenylthiocarbamide bitter taste recognition threshold with susceptibility to motion sickness
• The results support the hypothesis that phenylthiocarbamide taste sensitivity, as measured quantitatively by thresholds, is higher in individuals prone to motion sickness
The findings of the present and previous studies emphasise the advantages of studying genotype effects on behavioural outcome in children, especially in traits related to neurological maturation and conditioning. These studies stress the importance of gradual exposure of genetically sensitive children to panic situations so as to blunt their effects, whether motion sickness or other neurological and behavioural traits. The assessment of such modified responses, achieved through training and habituation, should be the focus of future research.
Conclusion
The present study describes, for the first time, a specific relationship between hereditary, individual, quantitative differences in bitter taste perception thresholds and motion sickness susceptibility. The influence of genetics and culture on the ontogeny of complex developmental and behavioural traits is an important research area for meaningful neuroanthropological studies, and one which needs to be explored.