Twelve million unauthorized immigrants currently reside in the United States (Office of Immigration Statistics 2018). Roughly half live outside traditional destinations (e.g., CA, FL, IL, NY, and TX). In 2018, Immigration and Customs Enforcement (ICE) forcibly removed over 250,000 of them, many of whom were apprehended after successfully passing the border and settling in the interior. With the spread of enforcement into the interior, large regional differences in enforcement patterns have emerged. Furthermore, although almost half of all immigrants were born outside of Latin America, nearly everyone (94% in 2018) deported by ICE is Latino (Transactional Records Access Clearinghouse 2019).
Immigration enforcement now pervades the lives of Latinos, authorized and unauthorized, native-born and immigrant. As far back as 2011, one-in-four foreign-born Latinos personally knew someone who had been deported (Rocha, Knoll, and Wrinkle Reference Rocha, Knoll and Wrinkle2015). Heightened immigration enforcement also directly affects the lives of native-born Latinos. As local police join forces with immigration authorities, both native- and foreign-born Latinos are more likely to be arrested (Armenta and Alvarez Reference Armenta and Alvarez2017) and are less trusting of civic institutions (Rocha, Knoll, and Wrinkle Reference Rocha, Knoll and Wrinkle2015).
In this paper, we examine whether geographic differences in immigration enforcement affect linked fate among Latinos, an attitude that spurs other forms of political activity (Shaw, Foster, and Combs Reference Shaw, Foster and Combs2019). This question is important because, compared to African Americans' racial identity, feelings of linked fate among Latinos are low. According to a recent survey, nearly 70% of blacks believe their lives are linked to those of others of their race, whereas only 58% of Latinos report feeling a sense of ethnic linked fate (Barreto et al. Reference Barreto, Frasure-Yokley, Vargas and Wong2016).
Scholars have suggested a variety of reasons for this difference, emphasizing notions such as nativity and panethnicity. We argue that geographic differences in patterns of immigration enforcement play a role. They affect Latino linked fate in two ways: First, immigration policy may directly affect feelings of linked fate for the same reason it alters other types of political orientations because it sends signals about the type of treatment Latinos can expect from the government (see Rocha, Knoll, and Wrinkle Reference Rocha, Knoll and Wrinkle2015). Second, and more importantly for our purposes, immigration enforcement may indirectly lead to increased ethnic linked fate by determining where and how demographic context will be salient. Demographic context is one of the most frequently studied predictors of racial/ethnic attitudes among both minorities and Anglos (non-Hispanic whites); however, findings vary, and policy may explain why. Latinos may be differently aware of and sensitive to the effects of their demographic context across policy environments. In other words, we suggest that the effect of demographic context on feelings of linked fate is likely determined by the level of policy enforcement in one's environment.
We also argue that immigration enforcement is likely to have a strong effect on the way demographic context shapes linked fate for native-born Latinos, even though they are not directly targeted by policy. High levels of immigration enforcement signal to native-born Latinos that their acceptance in the United States as full, valued citizens is tied to the treatment of immigrants, making the size of the immigrant population more influential on native-born Latinos' feelings of ethnic linked fate.
We further contend that immigration enforcement has, ironically, only limited effects on those most directly targeted by policy: foreign-born Latinos. Scholars argue that, for some groups, racial or ethnic group membership is likely to be “so important and enduring” that individuals are always aware of their group ties (Welch et al. Reference Welch, Sigelman, Bledsoe and Combs2001, 98). For foreign-born Latinos, who are consistently reminded of how their lives are structured by ethnicity and the immigrant experience, ethnic group ties are likely salient in all policy contexts.
Below, we discuss how immigration policy has come to target Latinos and explain how its enforcement may change the way Latinos think about their identities directly, but in particular, how it may structure the effect of immigrant population size on Latinos' feelings of linked fate. We define linked fate both as feeling that what happens to Latinos generally affects what happens in one's life (referred to simply as linked fate) and as a positive reaction to this sense of connection (referred to as positive linked fate). We combine information on local immigration enforcement with the Latino Decisions' 2016 Collaborative Multiracial Post-Election Survey to test our arguments. Although we find little evidence that immigration enforcement directly affects native-born Latinos' sense of ethnic linked fate, we show that immigration enforcement indirectly shapes linked fate by determining when and how demographic context matters in forming attitudes. We find that native-born Latinos have a stronger sense of linked fate when they live in counties with large concentrations of immigrants and rates of enforcement are high. When enforcement is low, the presence of immigrants has a negligible effect on native-born Latinos' attitudes. Foreign-born Latinos' sense of linked fate, however, is unaffected by the policy environment. This suggests that, as immigration policy becomes more intense, conservative politicians may see increased backlash from native-born Latinos, at least in certain communities, because feelings of ethnic linked fate have been correlated with increased participation and pro-immigrant policy stances (Masuoka Reference Masuoka2008).
Immigration Policy and Latino Linked Fate
Immigration Policy Trends
Starting with the 1965 Immigration and Nationality Act, the United States has limited legal immigration opportunities for Latin Americans. Since then, the unauthorized population has grown from 3.5 million in 1990 to over 11 million in 2014, with roughly 77% from Latin America (Massey, Durand, and Malone Reference Massey, Durand and Malone2002; Migration Policy Institute 2014). In response, politicians have framed Latino immigrants—and, by extension, all Latinos—as a “grave threat to the nation” (Massey and Pren Reference Massey and Pren2012, 5).
Now, because local police have become involved with interior immigration enforcement, the federal targeting of Latino immigrants has spilled over to state and local entities. This change began with George W. Bush's presidency. The Bush administration greatly expanded local law enforcement agencies' cooperation with ICE through the 287(g) program and creation of Secure Communities. The 287(g) agreements allow local police to voluntarily join forces with ICE and directly enforce federal immigration law. While created in the mid-1990s, the number of agreements rose after 2001. Bush also created Secure Communities, a program requiring immigration status checks for any individual arrested by local authorities and allowing unauthorized individuals to be detained beyond their original sentence to ensure deportation. The program expanded under President Obama, leading to the highest level of interior removals (more than 200,000 annually) to date (Capps et al. Reference Capps, Chishti, Meissner and Mittelstadt2018). Under Bush and Obama, these programs were theoretically aimed at serious criminals. However, localities participating in 287(g) or Secure Communities demonstrated greater arrest rates for Latino immigrants and citizens, perpetuating a culture of fear in these communities (Capps et al. Reference Capps, Chishti, Meissner and Mittelstadt2018).
Interior enforcement intensified under the Trump administration. Trump reversed policies focusing on serious criminals, expanding enforcement priorities to include all noncitizens. ICE now arrests more refugees, immigrants with humanitarian protection claims, and individuals who live with unauthorized immigrants, despite not being the initial target of an ICE arrest (Capps et al. Reference Capps, Chishti, Meissner and Mittelstadt2018). This is unsurprising given Trump's claims that Latin American—and specifically Mexican—immigrants are criminals, drug dealers, and rapists (Washington Post Staff 2015).
In today's climate, neither the media, nor apparently the police, distinguish between Latino immigrants and nonimmigrants. As a result, the negative stereotypes fostered by immigration enforcement affect all Latinos, regardless of authorization or immigrant status. Thus, when government agents detain or deport unauthorized immigrants at greater rates, it signals to all Latinos that their ethnic group is not valued and that they can expect negative government treatment, likely changing how all Latinos think about ethnic group ties. However, the way in which they affect ties may still vary for these two segments of the Latino community—a possibility we investigate in this paper.
Immigration Policy's Effects on Latino Linked Fate
Some Latinos feel a strong sense of linked fate with coethnics, and some do not. Latinos who are poor or speak Spanish are more likely to believe that doing well depends on other Latinos doing well (Sanchez and Masuoka Reference Sanchez and Masuoka2010). Education, age, national origin, and nativity also play roles (Masuoka Reference Masuoka2008). However, policy context may also shape feelings.
Policy divides society into politically relevant groups and changes how we see ourselves (Campbell Reference Campbell2005). By allocating benefits to a group, policy teaches us the group is valued by society, and individuals work to maintain ties to that group. When policy punishes groups, like unauthorized immigrants, individuals realize that group membership carries risks. To avoid punitive policy outcomes, individuals may distance themselves from the group. These effects spill over to those who lack personal policy contact (Maltby Reference Maltby2017; Rocha, Knoll, and Wrinkle Reference Rocha, Knoll and Wrinkle2015). When government programs and actions send signals about the statuses of policy recipients, they socially construct all individuals who fit within a general group targeted by policy. In the case of immigration policy, this group includes all Latinos.
We suspect that the effect of immigration policy differs for foreign- and native-born Latinos. Foreign-born Latinos living in areas where enforcement is high may cling more tightly to their ethnic ties than foreign-born Latinos living in areas where enforcement is low. Although group discrimination can lead to low self-esteem and high anxiety (Armenta and Hunt Reference Armenta and Hunt2009), a strong group identity can provide a “psychological buffer” to such negative effects (Cronin et al. Reference Cronin, Levin, Branscombe, van Laar and Tropp2012, 394). Past researchers have found that group discrimination does lead to increased feelings of linked fate for Latinos (Lu and Jones Reference Lu and Jones2019). Thus, foreign-born Latinos' feelings of ethnic linked fate may become stronger in the face of intense immigration enforcement.
Alternately, policy may have limited effects on foreign-born Latinos' attitudes. For some, group identity is always salient and unlikely to change as a result of outside factors (Welch et al. Reference Welch, Sigelman, Bledsoe and Combs2001). The outsider status that foreign-born Latinos face upon arriving in the United States makes their ethnic group ties relevant in all contexts. If ethnic identity is always important, the effect of immigration enforcement on foreign-born Latinos' linked fate will be negligible. This explains research showing that first-generation immigrants do not reliably display increased group identification when they perceive ethnic-based discrimination (Wiley et al. Reference Wiley, Lawrence, Figueroa and Percontino2013). Conversely, foreign-born Latinos' identity may be shaped more by personal experiences with policy than levels of enforcement in their areas of residence. If true, we are unlikely to capture this by simply examining differences in enforcement levels across space.
Native-born Latinos, though only indirectly targeted by immigration policy, are not immune to immigration enforcement's effects. Previous researchers have found that native-born Latinos' attitudes (Filindra and Manatschal Reference Filindra and Manatschal2017), political orientations (Rocha, Knoll, and Wrinkle Reference Rocha, Knoll and Wrinkle2015), and participation (White Reference White2016) are responsive to immigration policy. This may be because native-born Latinos have close ties to those directly affected by policy. Nearly one in three native-born Latinos knows an unauthorized immigrant (Barreto et al. Reference Barreto, Frasure-Yokley, Vargas and Wong2016). However, the effect of policy is likely also direct for this group because native-born Latinos have “perceived themselves as the intended target” of past anti-immigrant legislation (Pantoja and Segura Reference Pantoja and Segura2003, 267). Because policies signal how receptive the public is to the target group (see Condon, Filindra, and Wichowsky Reference Condon, Filindra and Wichowsky2015), native-born Latinos may feel unwelcome in communities pursuing intense immigration enforcement.
Because they are not directly targeted by policy, native-born Latinos may react differently to immigration enforcement than their foreign-born counterparts. High levels of immigration enforcement may lower the perceived importance of ethnicity among Latinos born in the United States. Native-born Latinos are already likely to feel socially distant from immigrants, and harsh immigration enforcement may teach native-born Latinos that close ethnic-group ties lead to discrimination. Although this may lead to increased feelings of ethnic linked fate for foreign-born Latinos, the rejection-identification model predicts the opposite for the native-born population. This model assumes that discrimination leads to increased group identity partly because individuals are not accepted by higher-status groups (Cronin et al. Reference Cronin, Levin, Branscombe, van Laar and Tropp2012). Native-born Latinos have greater access to resources and are more assimilated into U.S. culture, making them better able than the foreign-born population to build connections to other, more powerful groups (Massey, Durand, and Malone Reference Massey, Durand and Malone2002). In the face of discriminatory policy, native-born Latinos may emphasize connections with non-Latinos and minimize shared ethnic ties. This may explain why Pérez (Reference Pérez2015) found that the most acculturated Latinos are less sensitive to anti-immigrant rhetoric than those closer to the immigrant experience.
Does Demographic Context Affect Latino Linked Fate?
Scholars have long suggested that demographic context, here the size of the foreign-born population in a community, shapes ethnic linked fate. However, support for this idea is mixed. Some argue that the presence of a foreign-born population drives a wedge between Latinos. Native-born Latinos feel socially distant from less-acculturated immigrants (Massey, Durand, and Malone Reference Massey, Durand and Malone2002), and foreign-born Latinos are more committed to national-origin ties than broader panethnic identities (DeSipio Reference DeSipio1996). Thus, residing in an area with a large concentration of immigrants may weaken ethnic ties.
Others suggest Latinos respond positively to large immigrant populations. Living among immigrants reminds native-born Latinos of their commonalities with the foreign-born population (Lopez and Espiritu Reference Lopez and Espiritu1990), possibly increasing linked fate. For foreign-born Latinos, residing in areas with large concentrations of immigrants provides economic opportunities that would be otherwise unavailable (Zhou Reference Zhou1997), making strong panethnic group ties more beneficial.
A third possibility is that the effect of the demographic context on Latino linked fate is conditional. Past researchers have argued that demographic context cannot be studied in isolation; its effect appears dependent on the socioeconomic environment (Branton and Jones Reference Branton and Jones2005) and segregation (Rocha and Espino Reference Rocha and Espino2010). However, these studies only considered social factors, omitting the role of political determinants. In this paper, we thus argue that immigration policy explains when and how demographic context affects Latinos' feelings of linked fate. In other words, without knowing the political conditions of one's area of residence, it is unclear what direct effect demographic context has on linked fate, if any. In the next section, we explain how immigration enforcement and demographic context work together to shape a sense of linked fate among Latinos.
Does Policy Moderate the Effect of Context?
Both demographic context and policy likely individually affect Latinos' sense of linked fate. However, the interplay of these two factors is also vital. Policy determines when demographic context is important and changes how individuals relate to others. For Latinos, immigration enforcement may affect the point at which immigrant-population size will be a significant factor in shaping ethnic linked fate. However, the indirect effect of immigration enforcement on context depends on Latinos' nativity and thus sensitivity to policy outcomes.
Immigration enforcement may be particularly important for structuring how native-born Latinos respond to demographic contexts. Absent the political factors that emphasize how their lives are connected to immigrants, native-born Latinos may not consider the size of the immigrant population in their communities when forming feelings of ethnic linked fate. In fact, unless they perceive discrimination against their ethnicities, highly acculturated Latinos are more likely to have attitudes similar to Anglos (Pedraza Reference Pedraza2014). Native-born Latinos may feel a sense of linked fate only when prompted by political circumstances, such as high immigration enforcement.
We suggest that immigration enforcement reminds native-born Latinos of their connection to immigrants for several reasons. First, areas with high levels of ICE activity may lead to greater concern for family, friends, and neighbors who are unauthorized. Because one-in-three native-born Latinos report knowing someone who is unauthorized (Barreto et al. Reference Barreto, Frasure-Yokley, Vargas and Wong2016), it is likely that knowledge of others' statuses will be more salient in these areas. Second, being in areas of intense immigration enforcement reminds native-born Latinos of how the government views Latinos. Because of the association between immigration and Latinos as immigrants, law enforcement is likely to stop all Latinos for minor traffic violations as a pretext for asking about immigration documents (Mucchetti Reference Mucchetti2005). Recent studies show that as local police become engaged in immigration enforcement, Latinos, including those who are native-born, are more likely to be arrested (Armenta and Alvarez Reference Armenta and Alvarez2017). Furthermore, we believe that intense levels of immigration enforcement affect the lives of native-born Latinos regardless of personal police experience or knowledge of others' immigrant statuses. The rhetoric used by the media when discussing immigration reminds native-born Latinos that most Americans likely confuse them with immigrants (see Chavez Reference Chavez2008). Thus, in areas with intense immigration enforcement, native-born Latinos are reminded that their lives are connected to immigrants. As the immigrant population becomes more salient to native-born Latinos, the size of the foreign-born population is more likely to influence their sense of ethnic linked fate. In fact, a recent study by Wilcox-Archuleta (Reference Wilcox-Archuleta2018) connects the concept of ethnic salience, defined at one point in his study as the geographic concentration of ethnic-owned businesses, to a sense of greater in-group identity.
Building off Wilcox-Archuleta's (Reference Wilcox-Archuleta2018) link between ethnic saliency and identity, we argue that, when immigration enforcement is intense, and the presence of immigrants within a community is highlighted, context may lead to closer ethnic ties. This is because negative policies such as immigration policy have the “unintended consequences of accentuating group differences, heightening group consciousness of those differences, [and] hardening ethnic identity boundaries between ‘us’ and ‘them’” (Rumbaut Reference Rumbaut2008, 110). High levels of immigration enforcement distinguish Latinos from other Americans by signaling that all Latinos, not simply those born outside the United States, have low status. Intense immigration enforcement may make native-born Latinos more sensitive to the effects of living in areas with a large immigrant population.
Additionally, by increasing the salience of the immigrant population, immigration enforcement may lead native-born Latinos to be more positive about their shared ethnic ties. When immigration enforcement is low, native-born Latinos may focus on what distinguishes immigrants and themselves, such as differences in language, income, or education, making it unlikely that a large or growing foreign-born population will positively affect feelings about their ethnic identity. However, by signaling that society views Latinos as a unified group, high levels of immigration enforcement may cause native-born Latinos to focus on what unites them with immigrants—ethnic-based discrimination. As a past study finds, when highly acculturated Latinos perceive group-based discrimination, they are more likely to hold pro-immigrant attitudes (Pedraza Reference Pedraza2014). We suspect that when immigration enforcement is important for determining the role immigrant presence plays in native-born Latinos' attitudes. High levels of immigration enforcement make the immigrant population more noticeable, leading not only to greater beliefs that native-born Latinos' fates are tied to coethnics but also triggering more positive affect toward the group as a whole.
However, for foreign-born Latinos, immigration enforcement is less likely to determine when or how demographic context shapes feelings of linked fate. High levels of immigration enforcement make the immigrant population in one's area of residence more salient for native-born Latinos. Nevertheless, the presence of immigrants is already known by foreign-born Latinos, given that they are more likely to interact with other immigrants. In other words, the size of the immigrant population likely shapes foreign-born Latinos' sense of linked fate, regardless of the level of ICE activity.
To be clear, we are not arguing that immigration enforcement and demographic context have no effect on foreign-born Latinos' identities. Instead, we suggest that, if policy and demographic context affect linked fate for this group, the effects are likely direct. Both factors could be consistently striking for foreign-born Latinos, who are likely more sensitive to immigration policy and demographic context than their native-born counterparts. Indeed, Vargas, Sanchez, and Valdez (Reference Vargas, Sanchez and Valdez2017) find that foreign-born Latinos living in states that pass restrictionist policies report high levels of linked fate. Because of this, we consider it unlikely that immigration enforcement changes the way foreign-born Latinos relate to their demographic context. This may explain why Pedraza (Reference Pedraza2014) finds no link between perceptions of ethnic discrimination and other attitudes among the least-acculturated Latinos. The lives of foreign-born Latinos may be affected by group discrimination, but it does not structure their attitudes. Our (much more modest) assertion is that foreign-born Latinos may be affected by immigration enforcement, but it does not moderate the effect of demographic context. This moderating effect is one that has not been tested by Vargas, Sanchez, and Valdez (Reference Vargas, Sanchez and Valdez2017) or others.
In sum, current literature leads us to develop the following arguments:For native-born Latinos:
• We hypothesize that the direct relationship between immigration enforcement and linked fate will be negative.
• We are agnostic about the direct relationship between immigrant population size and linked fate.
• We hypothesize that when immigration enforcement is low, immigrant presence will have a negative relationship with linked fate. When immigration enforcement is high, we hypothesize that immigrant presence will be positively related to linked fate.
For foreign-born Latinos:
• We hypothesize that the direct relationship between immigration enforcement and linked fate will be positive or they will be unrelated.
• We are agnostic about the direct relationship between immigrant population size and linked fate.
• We hypothesize the level of immigration enforcement will not affect the relationship between immigrant population size and linked fate.
Modeling the Interaction of Context and Policy
We tested our hypotheses using data from Latino Decisions' 2016 Collaborative Multiracial Post-Election Survey (CMPS) (Barreto et al. Reference Barreto, Frasure-Yokley, Vargas and Wong2016). The survey was conducted online between December 3, 2016 and February 15, 2017. Of the roughly 18,000 individuals eligible to take the survey, 10,145 adults completed it, leading to a 57.6% cooperation rate. The CMPS was conducted in five languages, including Spanish. As such, it had a large Latino subsample, including Latinos born outside the United States and noncitizens. Respondents came from 1,146 different U.S. counties. The number of respondents in a county ranged from 1 to 594, with an average of nine respondents per county. After excluding missing cases, the sample included 2,739 Latino respondents.
Our analysis requires a sample large enough such that it is appropriate to make within-group comparisons. Unlike many national surveys with small or unrepresentative nonwhite samples, Barreto et al. (Reference Barreto, Frasure-Yokley, Vargas and Wong2018) note that “the goal of the 2016 CMPS was to include large and generalizable samples of blacks, Latinos, and Asian Americans to allow for within-group comparison and analysis of an individual racial group or comparative analysis across groups.” Although they begin by identifying respondents from a list of registered voters, CMPS's investigators also worked with several sample vendors who specialized in reaching minority populations. Barreto et al. (Reference Barreto, Frasure-Yokley, Vargas and Wong2018) note that the CMPS's sampling methods “yielded a fairly representative sample geographically, decreasing the need for costly oversamples, allowing researchers to analyze a large national multiracial sample of both registered and non-registered voters.”
We supplemented the survey data with information on local immigration enforcement and demographic context. Immigration-enforcement data came from US ICE (2015), which released county-level data on the enforcement of Secure Communities in 2015.Footnote 1 These data contain information on the number of individuals arrested and deported in a county through Secure Communities, as well as their criminal statuses. From this, we used information on the number of individuals removed by ICE who had low-level and noncriminal offenses, such as overstaying visas. We focused on these removals because the effect of immigration enforcement on Latino linked fate likely depends on who is deported. In theory, immigration policy is primarily aimed at dangerous criminals; in practice, many of those deported have committed only minor offenses or have no criminal records. Removals of individuals with minor or no criminal backgrounds should have a greater effect on Latino linked fate. Although the removal of felons is likely to be viewed as legitimate, the removal of low-level offenders and noncriminals is seen as unjustified. The removal of noncriminals also sends a stronger signal that the broader target of immigration policy includes all Latinos—even those without criminal histories—rather than immigrants who break the law. Because criminals and noncriminals have different social networks (Carrington Reference Carrington, Scott and Carrington2011), information about noncriminal deportations also is more likely to reach other noncriminal immigrants than news about criminal deportations. Some suggest that focusing on low-level or noncriminal removals would better capture immigration authorities' discretion in deportations (Cruz Nichols, LeBrón, and Pedraza Reference Cruz Nichols, LeBrón and Pedraza2018). Low-level and noncriminal removals may thus be better measures of where immigration officials are purposefully intensifying enforcement and sending stronger signals about Latinos' status, compared to all removals or only criminal removals. We measured immigration enforcement by taking the number of low-level and noncriminal immigrants per 1,000 foreign-born residents in a county.Footnote 2, Footnote 3
The level of immigration enforcement varies widely across the country. In counties with Latino respondents, the removal rate ranged from zero (in counties with no deportations) to 364, with a mean of 4. Only one respondent lived in a county with a removal rate greater than 50. To ensure our results were not driven by this extreme outlier, we limited the sample to counties with removal rates less than 50. Models including this outlier or using the natural log of the removal rate produced largely similar results.Footnote 4 We measured demographic context using the proportion of the county that is foreign-born (United States Census Bureau 2015). Counties ranged from zero to .52 proportion foreign-born residents. On average, Latino respondents lived in counties that were .21 proportion foreign born.
A possible concern may be that the deportation rate may increase with the foreign-born population size. Previous researchers have offered mixed perspectives on this issue. Filindra (Reference Filindra2019) finds that, at the state level, large immigrant populations are associated with more hostile immigration policy. However, Pedroza (Reference Pedroza2018) shows that that the size of the overall Latino population is associated with county jail administrators complying less often with ICE officials, until the Latino population reaches 40%, at which point the trend reverses. Cox and Miles (Reference Cox and Miles2013, see p. 121) note the noncitizen population size does not predict when counties entered the Secure Communities program activation, although the size of the overall Latino population does. In line with the conclusion of Cox and Miles (Reference Cox and Miles2013), the level of immigration enforcement and percentage of the county that was foreign born were correlated at a relatively low −.05 in our data, indicating the level of immigration enforcement in a county is not dependent on its foreign-born population size.
We argue that policy affects Latinos' perceptions of ethnic linked fate both directly and indirectly by conditioning the effect of the immigrant population size on linked fate. To test this, we interacted the county's removal rate with its foreign-born population size. Because we expected that this process works differently for those directly and indirectly targeted by policy, we followed Vargas, Sanchez, and Valdez (Reference Vargas, Sanchez and Valdez2017) by estimating separate analyses for native- and foreign-born Latinos.Footnote 5 In the sample, 26% of the respondents were foreign-born.
We used two dependent variables to measure linked fate within the Latino community. Although both focus on how Latinos feel about their connection with fellow coethnics, these variables capture different aspects of this relationship. First, we used a measure that asks respondents whether they feel a sense of linked fate and, if so, how strong this link is. To do this we combined the following two questions:
“Do you think what happens generally to Hispanic or Latino people in this country will have something to do with what happens in your life? Yes; No”
“Will it affect you: A lot; Some; Not very much?”
We used this to create an ordinal measure, ranging from 0 (respondents do not agree that their lives are affected by what happens to Latinos in general) to 3 (a lot). Roughly 42% of Latinos reported feeling no sense of linked fate. Native-born Latinos were somewhat less likely than foreign-born ones to respond that they felt no linked fate (41 and 45%, respectively). However, a difference of means test shows native- and foreign-born Latinos were similarly likely to report that this link affected them a lot (17 and 19%, respectively).
Our second dependent variable measured whether respondents felt positively about their ethnic group connections. The standard linked fate measure is unable to speak to how respondents feel about this shared fate. Although it is generally assumed that individuals feel positively about this connection, this is unlikely to be true in all cases. For instance, individuals may recognize their lives are tied to their ethnic group but feel negatively about this connection if the larger group is persecuted. Thus, to capture how positively individuals feel about their group connections, we needed to use a different though related concept which we label “positive linked fate.” We also feel it important to distinguish between traditional and positive linked fate because Latinos who feel positively about shared ethnic fate may be more inclined to participate in pro-immigrant ways compared to those who feel negatively about this connection. Our second measure expands on how respondents feel about their ethnic ties. The question read as follows:
“Some people feel positively about the link they have with their racial or ethnic group members, while others feel negatively about the idea that their lives may be influenced by how well the larger group is doing. Which comes closer to your feelings? I feel positively about this link with my racial or ethnic group; I feel negatively about this link with my racial or ethnic group; neither positive or negative.”
We used this to create a three-category ordinal variable, where higher values indicated more positive feelings. While this question asks about feel about one's ethnic linked fate, our analysis suggests these are, in fact, somewhat different concepts. For instance, while both questions ask about one's ethnic group connections, these variables are correlated at a relatively low .23. About half of the respondents reported feeling positively about ties with others in their ethnic group. A difference of means test indicates that native- and foreign-born Latinos were equally likely to say the link is positive, at 49 and 50%, respectively. We also replicated our positive linked fate models for only those who reported feeling a sense of linked fate. The results (Table A7 in the Supplementary appendix) are largely unchanged.
We controlled for the individual-level factors known to affect linked fate, including age, gender, and partisan affiliation. We measured socioeconomic status, which has been positively tied to linked fate (Sanchez and Masuoka Reference Sanchez and Masuoka2010), via education level, an ordinal variable ranging from 1 (grades 1–8) to 6 (postgraduate education). We included a measure for skin tone with a question that asked respondents, “As you know, people display a wide variety of physical characteristics. One of these is skin color. Displayed below is a skin color scale that ranges from 1 to 10. The 10 shades of skin color are represented by a hand of identical form but differing in color. Which hand shown below comes closest to your skin color?” We also controlled for several characteristics specific to Latinos, including national origin and Spanish language use.Footnote 6 Latinos who speak Spanish more regularly have been found to maintain a strong sense of linked fate (Sanchez and Masuoka Reference Sanchez and Masuoka2010). To control for Spanish-language use, we included whether the respondents answered the survey in Spanish or not. For foreign-born Latinos, we also included citizenship status and the number of years they have been in the United States (Masuoka Reference Masuoka2008).Footnote 7
Our models also controlled for several contextual factors that may shape feelings of linked fate. Immigration is more salient in some parts of the country than others, possibly priming Latinos to think about coethnic connections. To control for this, we included a respondent's region and whether a respondent lives in a county bordering Mexico.Footnote 8 Last, we measured whether a respondent resides in a county that has decided not to cooperate with ICE detainers, which we label sanctuary counties (Griffith and Vaughan Reference Griffith and Vaughan2019). Although our theory is about the role of punitive policies on identity, pro-immigrant policy decisions such as limiting ICE cooperation, may limit the effect that negative policy enforcement has on linked fate. Descriptive statistics of these variables can be found in our online appendix (Table A1).
Analysis
Before testing whether immigration enforcement and immigrant presence jointly shape feelings of linked fate, we checked to determine whether policy and demographic context, here understood as immigrant presence within a county, directly affect Latinos' attitudes (results for these models can be found in the online appendix Table A2). Neither policy nor immigrant presence affect native-born Latinos' sense of how much linked fate affects them, if at all. Immigration enforcement also has no effect on foreign-born Latinos' attitudes, but immigrant presence is positive and statistically significant at the .05 level for foreign-born Latinos' sense of positive linked fate. It is unsurprising that the size of the foreign-born population has a stronger direct effect on foreign-born Latinos than on their native-born counterparts because they are more likely to be aware of the immigrant population in their areas.
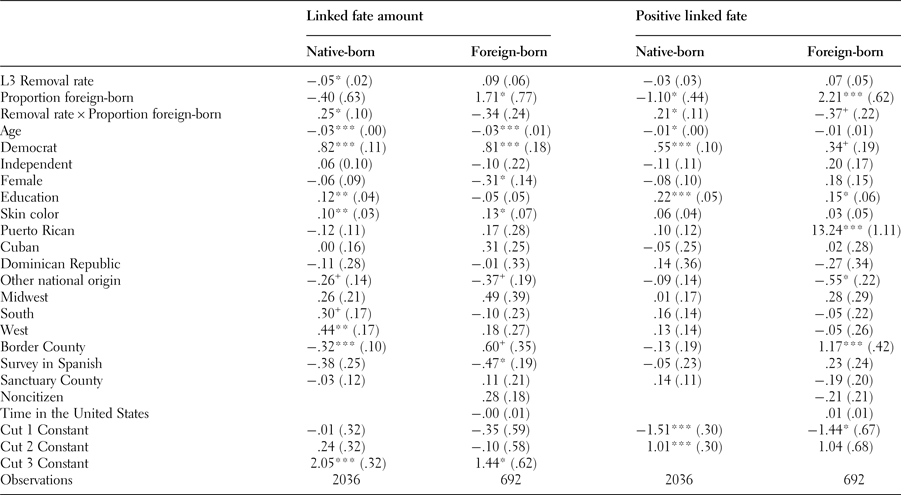
However, although policy and context in isolation do not demonstrably affect native-born Latinos' feelings of linked fate, it is possible that immigration enforcement may indirectly affect their attitudes by determining when immigrant presence will be significant. We next tested whether immigration enforcement and the size of the foreign-born population jointly shape feelings of linked fate for those directly and indirectly affected by policy. Because our measures of linked fate attitudes are ordinal, we used ordinal logistic regression with standard errors clustered by county.Footnote 9 First, we examine the results for models examining the amount of linked fate respondents feel (models 1 and 2 in Table 1) before turning our attention to the positive linked fate models (models 3 and 4 in Table 1). As the first model in Table 1 shows, once interacted with immigrant presence, policy does have a direct, negative effect on the amount of linked fate native-born Latinos feel. This indicates that increased immigration enforcement may cause native-born Latinos to feel less connected to others of their ethnicity in counties where there are no immigrants. The second model in Table 1 shows that policy does not directly affect feelings of linked fate for foreign-born Latinos. Immigrant presence does not directly affect linked fate for native-born Latinos. The size of the foreign-born population has a positive effect on foreign-born Latinos' feelings of linked fate, but this reaches statistical significance at only the .10 level. While the direct effect of immigrant presence is minimal, the size of the immigrant population may still shape feelings of linked fate if, as our third hypothesis predicts, the relationship between immigrant presence and linked fate is moderated by policy context.
Immigration enforcement, immigrant presence, and Latino linked fate

Note. Models estimated using ordered logit. Standard errors are clustered by county. ***p < .001; **p < .01; *p < .05; +p < .10.
Does policy indirectly affect linked fate by conditioning the role of immigrant presence on Latinos' attitudes? Yes, but only for native-born Latinos. The interaction of a county's noncriminal removal rate and the proportion of the county that is foreign-born is negative and statistically significant for Latinos born in the United States. This interaction is not significant for foreign-born Latinos, likely because this group is always aware of their ethnic identity, regardless of ICE activity.Footnote 10
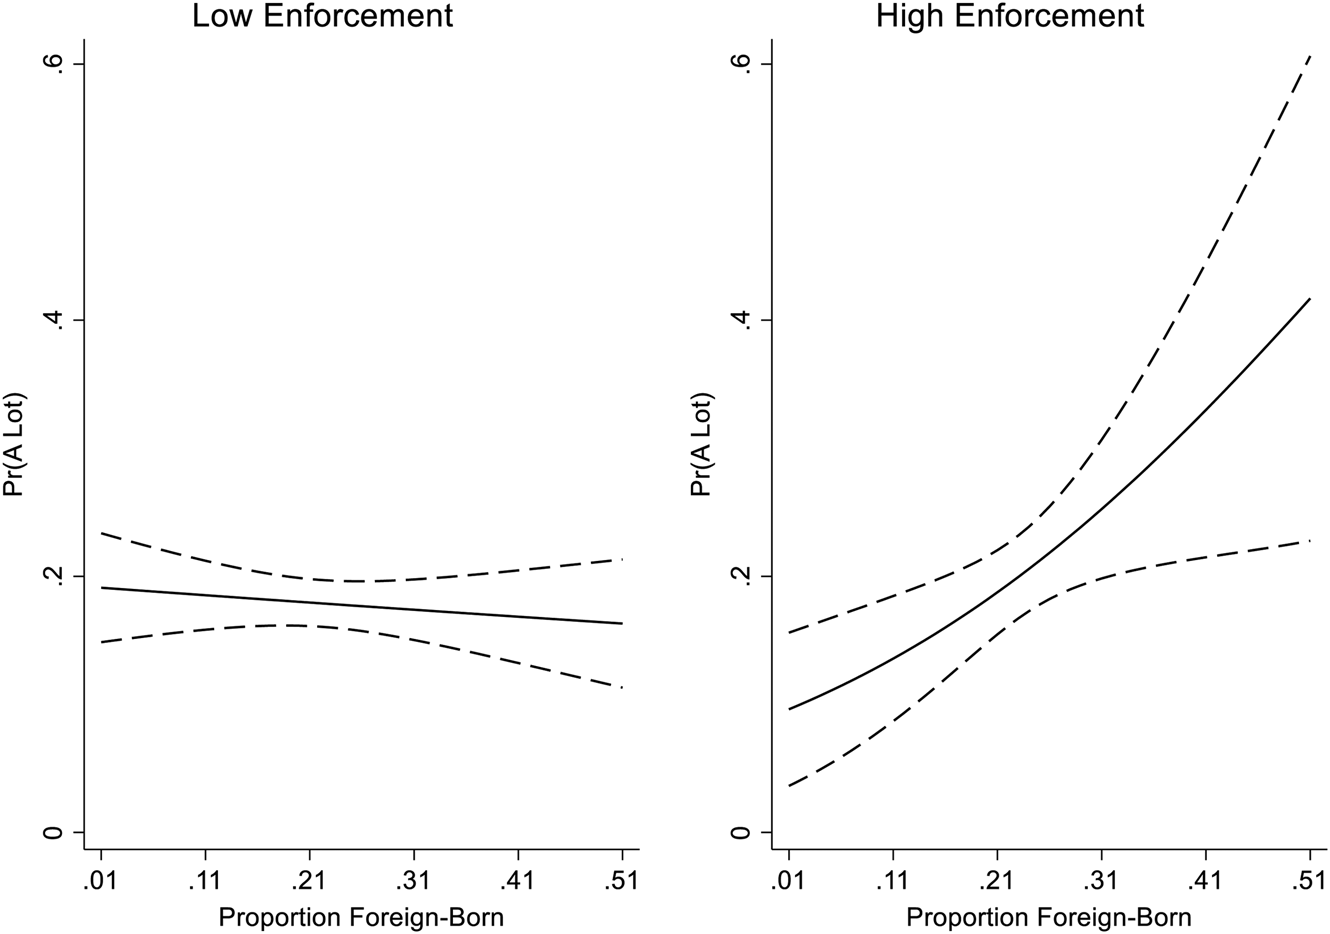
To facilitate the interpretation of the coefficient estimates for the first model, in Figure 1, we plot the predicted probability that native-born Latinos report that their fate is affected a lot by their connection to other Latinos across a range of demographic contexts. According to our argument, part of the way immigration enforcement shapes feelings of linked fate is indirect. Immigration enforcement determines when and how immigrant presence affects these feelings for native-born Latinos which helps us understand why the results for demographic context on attitudes are so mixed. When immigration enforcement is low, the explicit connection between the day-to-day experiences of native-born Latinos to at-risk immigrants is less salient. As such, they are unlikely to respond to the size of the foreign-born population when asked to think about shared fate. However, high levels of immigration enforcement convey the message to native-born Latinos that society views them as connected to immigrants, making the size of the immigrant population in a county more prominent and likely to affect native-born Latinos' sense of linked fate. Figure 1 shows support for these arguments.Footnote 11
Predicted probability of feeling a lot of linked fate for native-born Latinos. Note. The figure shows the predicted probability of responding “A lot” to the ordinal linked fate amount scale, indicating that the respondent thinks that what happens generally to Hispanic or Latino people in this country will have a lot to do with what happens in their life, for native-born Latino respondents across a range of proportions of the county that are foreign-born. For the low enforcement probabilities, the L3 removal rate is set at 0 (the minimum value observed in the data). For the high enforcement probabilities, the L3 removal rate is set at 18, a value at which 99% of all cases are at or below. This was selected to adjust for a few outlying observations. Dashed lines represent 95% confidence intervals.

In high-enforcement contexts, native-born Latinos have only a .10 probability of reporting that they feel a lot of linked fate with other coethnics when they live in a county with a small foreign-born population (proportion foreign-born = .01). In counties with similar levels of immigration enforcement but larger foreign-born populations (proportion foreign-born = .51), native-born Latinos are much more likely to report feeling a connection to fellow coethnics, with a .42 probability of responding “a lot.” This suggests that immigration enforcement structures how immigrant presence shapes feelings of linked fate for those indirectly targeted by policy. When enforcement is low, the size of the foreign-born population does not change how native-born Latinos think about their ethnic identities and coethnic connections. However, in more intense enforcement contexts, the size of the foreign-born population not only becomes salient to native-born Latinos but also positively affects native-born Latinos' ethnic ties.Footnote 12 In the absence of a large foreign-born population, high levels of immigration enforcement may lead native-born Latinos to distance themselves from those directly targeted by policy. At a minimum, native-born Latinos in high-enforcement but small immigrant-population environments do not appear to see how their lives are tied to those of coethnics. Nevertheless, the presence of a large foreign-born population can help native-born Latinos feel more connected to immigrants, possibly making it easier to overcome the stigma promoted by immigration policy.
A similar pattern emerged when we considered whether Latinos feel positively about their fate being linked to coethnics. Columns 3 and 4 in Table 1 show the results of models examining how policy and immigrant presence affect whether respondents say that their ethnic linked fate is positive for native- and foreign-born Latinos. The results suggest that policy does not directly shape how positively respondents feel about their ethnic ties for either group. However, the demographic context affects how both groups think about their identities. The size of the foreign-born population has a significant, negative relationship with native-born Latinos' positive feelings about their ethnic group ties in counties with no low-level or noncriminal removals. Without policy enforcement to trigger feelings of linked fate, native-born Latinos are less likely to see themselves as connected to their ethnic group or feel that their connections to other Latinos are beneficial when the foreign-born population is large. The opposite is true for foreign-born Latinos. The size of the foreign-born population positively affects foreign-born Latinos' feelings about their ethnic-group connections, at least when immigration enforcement is low (removal rate = 0). The results also show that immigration enforcement conditions the effect of the foreign-born population size on attitudes, but the interaction term reaches statistical significance at the .05 level only for native-born Latinos. As with the previous models, the interaction of the removal rate with the immigrant population size is positive and statistically significant for native-born Latinos. When immigration enforcement is high, a larger foreign-born population leads to more positive feelings about ethnic linked fate for native-born Latinos.Footnote 13 For foreign-born Latinos, the interaction is negative, suggesting that, if anything, the positive effects of immigrant population size on foreign-born Latinos' feelings of linked fate are strongest when immigration enforcement is low; however, this positive effect is muted or reversed in areas with more removals. Although unexpected, this provides further evidence that immigration enforcement affects the identities of native- and foreign-born Latinos differently. Nevertheless, we hesitate to make too much of this finding, given that the interaction reaches statistical significance at only the .10 level, and predicted probabilities suggest that these effects matter only in areas where a large proportion of the county is foreign born (.45 proportion or higher).
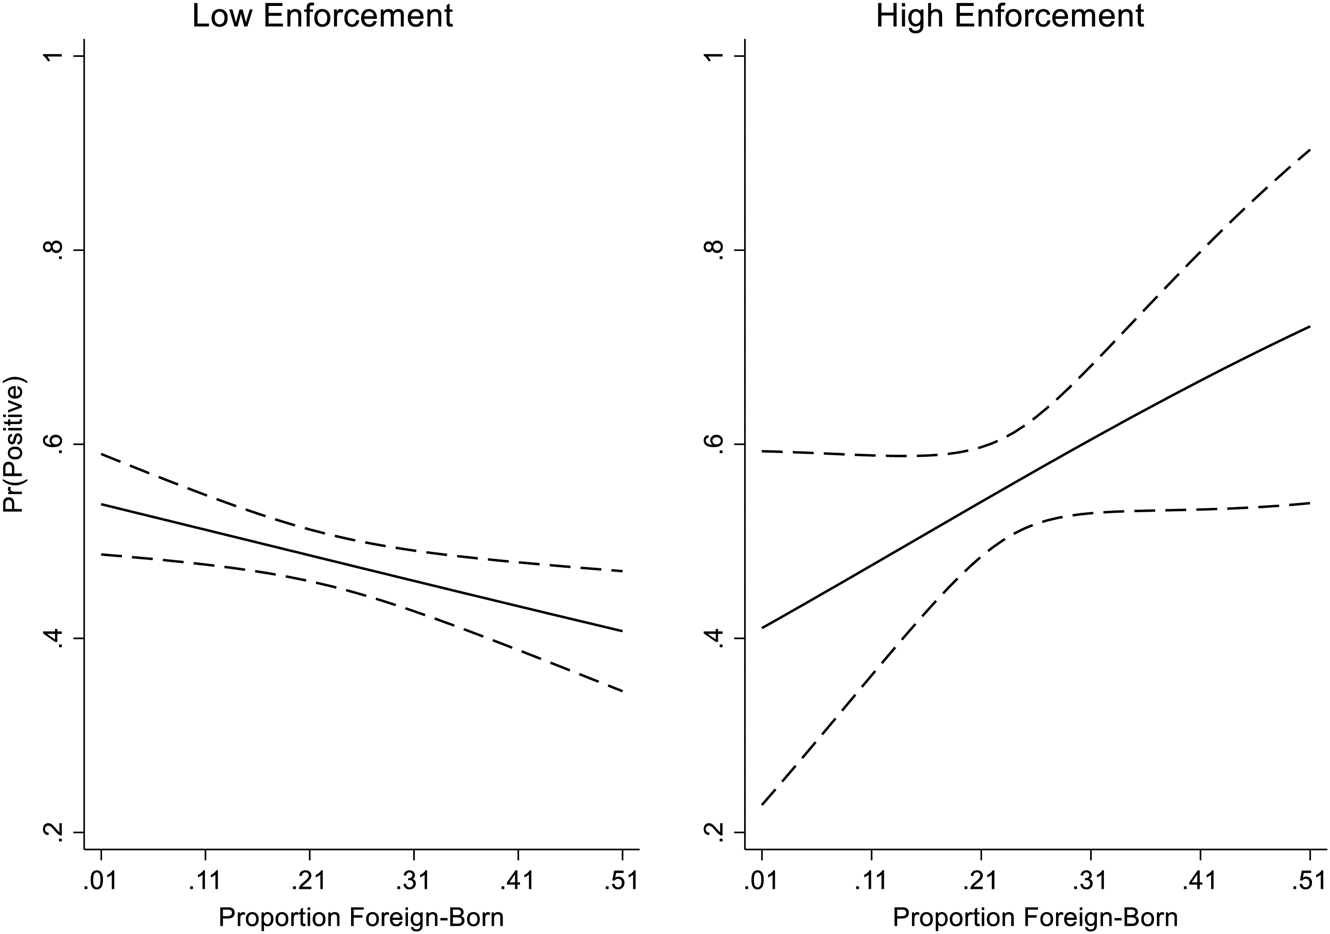
Figure 2 shows the estimated probability that native-born Latinos report feeling positively about their link to other Latinos across a range of demographic contexts. When policy enforcement is low (removal rate = 0), native-born Latinos are somewhat less likely to feel positively about their ethnic-group ties as the foreign-born population increases. In counties with few foreign-born residents (proportion foreign-born = .01), native-born Latinos have a .54 probability of saying that their linked fate is positive, but this drops to a .41 probability in counties with large foreign-born populations (proportion foreign-born = .51). This trend is reversed in counties with high levels of immigration enforcement. When immigration enforcement is high (removal rate = 18), native-born Latinos are more likely to say that their ethnic ties are positive as the foreign-born population grows. In these policy environments, native-born Latinos have a .41 probability of feeling positively about their coethnic ties when there are few foreign-born residents in their counties (proportion foreign-born = .01). This increases to a roughly .72 probability in counties with large foreign-born populations (proportion foreign-born = .51).
Predicted probability of responding linked fate is positive for native-born Latinos. Note. The figure shows the predicted probability of responding “I feel positively about this link with my racial or ethnic group” to the question “Some people feel positively about the link they have with their racial or ethnic group members, while others feel negatively about the idea that their lives may be influenced by how well the larger group is doing. Which comes closer to your feelings?” for native-born Latino respondents across a range of proportions of the county that are foreign-born. For the low enforcement probabilities, the L3 removal rate is set at 0 (the minimum value observed in the data). For the high enforcement probabilities, the L3 removal rate is set at 18, a value at which 99% of all cases are at or below. This was selected to adjust for a few outlying observations. Dashed lines represent 95% confidence intervals.

Several other factors also affect Latinos' linked fate. Latinos who are younger, who identify as Democrats, or who have darker skin tones are more likely to feel a sense of linked fate. This may be due to experiences with discrimination, which has been shown to be correlated with skin color (Espino and Franz Reference Espino and Franz2002). If so, this provides further evidence that discrimination is an important factor shaping ethnic identity. Highly educated native-born Latinos are more likely to feel a sense of linked fate; however, education level is unrelated to foreign-born Latinos' linked fate. Unsurprisingly, native-born Latinos residing in western states, where immigration has traditionally been more prominent, are more likely to feel a sense of linked fate. Living in the South positively affects native-born Latinos' linked fate, but this reaches statistical significance only at the .10 level. Interestingly, native-born Latinos who live in counties bordering Mexico are less likely to feel their fate is tied to other Latinos. For foreign-born Latinos, women and those who took the survey in Spanish are less likely to feel a sense of linked fate.
A few factors affect whether individuals believe their linked fate is positive. Democrats and the highly educated are more likely to feel positively about their ethnic ties. Native-born Latinos are less likely to feel positively about linked fate as they age. Foreign-born Latinos living in border counties feel more positively about their ethnic shared fate. National origin does not affect feelings of linked fate for Latinos born in the United States, but we found that national origin affects foreign-born Latinos' attitudes. Foreign-born Latinos from Puerto Rico are more likely to feel positively about their linked fate compared to those from Mexico, whereas individuals from other countries are less likely to feel the same, compared to those from Mexico.
Discussion
Does immigration policy enforcement shape Latinos' sense of linked fate? The short answer is yes, but not directly. Immigration enforcement affects the linked fate of individuals who are only indirectly targeted by policy—native-born Latinos—by determining how immigrant presence matters.
Theories of demographic context argue that the size of a racial/ethnic minority group affects a variety of attitudes, including identity (Welch et al. Reference Welch, Sigelman, Bledsoe and Combs2001). However, researchers examining the effect of demographic context on Latinos' attitudes have produced mixed results. We argue this is because scholars have ignored the way that politics determines how social factors affect attitudes. Our point, put simply, is that in localities, politics matter.
High levels of immigration enforcement make immigrant presence more noticeable, but primarily for those indirectly targeted by policy. Native-born Latinos who are able to ignore their ethnic surroundings when immigration enforcement is low are reminded that their lives are connected to those of Latinos born outside the United States when immigration enforcement is intense. Upon receiving negative signals about their ethnic group from policy, native-born Latinos are more likely to react by reaffirming their ethnic ties, at least when surrounded by large foreign-born populations. We found support for these arguments. Although both immigration enforcement and the size of the foreign-born populations were weakly and negatively related to native-born Latinos' feelings of linked fate, the interaction of policy and immigrant presence positively affected their ethnic ties. In areas with intense enforcement, the size of the foreign-born population positively affects native-born Latinos' feelings that their lives are connected to those of their coethnics and that this connection is beneficial.
Thus, immigrant presence is likely to help build strong racial/ethnic ties only under certain conditions—such as when enforcement policy explicitly connects native-born Latinos to the negative consequences enforcement has for the immigrant population. Additionally, these findings provide evidence that demographic context may help individuals overcome the negative stereotypes promoted by policy. When immigration enforcement is high, native-born Latinos may be more likely to turn to their communities to maintain high levels of self-esteem in the face of negative policy outcomes.
However, the positive effects of policy and demographic context are limited. Foreign-born Latinos are largely unresponsive to policy environment, and policy does not directly affect how this group reacts to immigrant presence. It may come as a surprise that ICE activity does not directly affect foreign-born Latinos, who are more affected by immigration policy. Nevertheless, it is possible that, because immigration enforcement is always very visible for this group, foreign-born Latinos will be unresponsive to broad policy enforcement. Instead, we note that foreign-born Latinos are more likely to feel a sense of linked fate with other coethnics and feel more positively about their ethnic-group ties when residing in counties with large concentrations of immigrants. We do find some evidence that the combination of intense levels of enforcement and a large immigrant presence affects foreign-born Latinos' sense of whether their ethnic linked fate is positive. Our results suggest that the beneficial effects of a large immigrant presence are most likely in areas where immigration enforcement is low, but the positive impact of a large foreign-born population on linked fate attitudes is reduced in areas with intense ICE activity. This is concerning because the presence of a large immigrant population has been thought to provide economic and sociological resources that benefit foreign-born Latinos. However, more research is needed to determine whether and how the combined effects of policy and demographic context shape foreign-born Latinos' attitudes.
These findings also have broader implications. Linked fate is associated with increased participation and more immigrant-friendly policy preferences (Shaw, Foster, and Combs Reference Shaw, Foster and Combs2019). By affecting native-born Latinos' sense of shared fate with their coethnics, the combination of severe immigration enforcement and a large foreign-born population may also change native-born Latinos' levels of political involvement—or other attitudes. This may explain why some scholars find that immigrant presence positively affects native-born Latinos' immigration-policy stances (Rocha et al. Reference Rocha, Longoria, Wrinkle, Knoll, Polinard and Wenzel2011). However, the effects of harsh immigration enforcement are limited. When immigration enforcement is low, immigrant presence has, at best, no impact or, at worst, a negative effect on native-born Latinos' feelings of linked fate. If policy does not promote feelings of linked fate, it is unclear whether native-born Latinos will become involved in politics in ways that benefit immigrants.
Understanding the full effects of policy and demographic context on Latinos' attitudes will become increasingly important over the next several years. President Donald Trump, who ran on an anti-immigrant platform, has already implemented harsher enforcement practices. As his former press secretary explained, Trump wants the “shackles off” ICE agents, freeing them to deport anyone in the country without authorization, regardless of criminal background (Spicer Reference Spicer2017). In the first 3 months of Trump's presidency, the number of noncriminals deported was higher than under Obama's presidency, whereas the number of criminals removed has fallen (Sacchetti Reference Sacchetti2017). The focus on low-level and noncriminal removals will only reinforce the negative stereotypes that immigration policy promulgates about Latinos. The results here suggest that this may cause Latinos—at least those born in the United States—to reaffirm their ties to immigrant populations.
SUPPLEMENTARY MATERIAL
The supplementary material for this article can be found at https://doi.org/10.1017/rep.2020.24