Implications
This study has detected several regions of the bovine genome associated with processes of differentiation among seven autochthonous Spanish beef cattle breeds using the BovineHD 777 K BeadChip (Illumina Inc., San Diego, CA, USA). Knowledge on these genomic regions allows to identify potential targets of recent selection that shaped the genetic configuration of those populations. Moreover, it also helps to define a number of potential candidate genes associated with traits of interest, such as coat color, muscle development, fertility, growth, carcass and immunological response.
Introduction
The processes of selection, adaptation to local environments and differentiation that started as taurine cattle (Bos taurus) was first domesticated, have shaped a wide range of breeds. Among them, the autochthonous Spanish cattle breeds are considered an important reservoir of genetic variability and a cultural asset in Spain. From an historical perspective, all these populations have probably a common origin followed by a process of differentiation that started when groups of individuals were confined to specific environments and became reproductively isolated from each other. Later on, not beyond the 18th century, subsequent processes of artificial selection defined the standards that characterize these breeds currently (Beja-Pereira et al., Reference Beja-Pereira, Alexandrino, Bessa, Carretero, Dunner, Ferrand, Jordana, Laloe, Moazami-Goudarzi, Sánchez and Cañon2003). Initially, the autochthonous Spanish cattle breeds were devoted to triple aptitude (milk, beef and work), but nowadays they are fully oriented to beef production. In this respect, several studies have described a remarkable variability among these breeds for carcass (Piedrafita et al., Reference Piedrafita, Quintanilla, Sañudo, Olleta, Campo, Panea, Renand, Turin, Jabet, Osoro, Olivan, Noval, García, García, Oliver, Gispert, Serra, Espejo, García, López and Izquierdo2003) and meat quality traits (Serra et al., Reference Serra, Guerrero, Guàrdia, Gil, Sañudo, Panea, Campo, Olleta, García-Cachan, Piedrafita and Oliver2008). This particular historical evolution has almost certainly left detectable signatures in the genome.
There are several approaches for searching signatures of selection in the literature (Qanbari and Simianer, Reference Qanbari and Simianer2014). An important group of procedures is based on the information available from multiple populations. Among them, the fixation index – F ST – (Wright, Reference Wright1951) has been widely used in human, animal and plant populations. More recently, Vitalis et al. (Reference Vitalis, Gautier, Dawson and Beaumont2014) proposed a new Bayesian method, referred to as SelEstim, which allows distinguishing between selected and nearly neutral polymorphisms under a genetic model that assumes a population subdivided into several demes that may exchange migrants. An interesting feature of this latter procedure is that it does not only allow identifying loci targeted by selection, but it also estimates the strength and direction of selection within each subgroup. Moreover, it relaxes some of the assumptions of the Wright’s F ST approach, such that all subgroups are genetically isolated and have the same effective size.
The objective of this study was to apply both the F ST and the SelEstim approaches to locate genomic regions in the bovine autosomes associated with divergence and positive selection among seven Spanish autochthonous beef cattle breeds (Asturiana de los Valles (AV), Avileña-Negra Ibérica (ANI), Bruna dels Pirineus (BP), Morucha (Mo), Pirenaica (Pi) and Retinta (Re), Rubia Gallega (RG)). The ultimate goal was to identify genes potentially involved in these processes.
Material and methods
Breeds and individuals sampled
A total of 342 individuals were collected from seven Spanish beef cattle populations (AV, n=50; ANI, n=48; BP, n=50; Mo, n=50; Pi, n=48; Re, n=48; RG, n=48) with the cooperation of Breeders Associations. They were chosen by minimizing the genealogical coancestry among them with the aim of capturing the existing variability within the populations.
Single nucleotide polymorphism: genotyping
Genomic DNA was extracted by standard protocols. Individuals were genotyped using the BovineHD 777 K BeadChip, designed to genotype 777 962 Single nucleotide polymorphisms (SNP), according to the protocol of the manufacturer at a commercial laboratory (Xenética Fontao, Lugo, Spain). The SNPs used in this study belonged to the autosomal chromosomes and those found in repeated positions were excluded. Additional requirements were Mendelian error rates below 0.05 and call rates over 95% for both, individuals and SNPs. The quality control was performed using the PLINK 1.0.7 software (Purcell et al., Reference Purcell, Neale, Todd-Brown, Thomas, Ferreira, Bender, Maller, Sklar, de Bakker, Daly and Scham2007) and missing genotypes were imputed using the software BEAGLE (Browning and Browning, Reference Browning and Browning2007). After pruning, 703 707 SNPs were finally retained, covering 2 510 350 kb with an average density of one marker every 3.57 kb.
Fixation index
The F ST statistic was calculated for the i th SNP marker (F STi ) as
 $$F_{{STi}} \,{\equals}\,{{\left( {H_{{Ti}} {\minus}H_{{Si}} } \right)} \over {H_{{Ti}} }}$$
where H Ti is the expected heterozygosity for the i th SNP marker in a random mating total population and was computed as
 $$H_{{Ti}} \,{\equals}\,2p_{i} q_{i} $$
with p i and q i being the average allelic frequencies across subpopulations for the i th marker. In turn, H Si is the mean expected heterozygosity within random mating subpopulations and it is calculated as
 $$H_{{Si}} \,{\equals}\,{\rm 1 \over {N_{p} }}\mathop{\sum}\limits_{j\,{\equals}\,1}^{N_{p} } {2p_{{ij}} q_{{ij}} } $$
where N p is the number of populations, and p ij and q ij are the allelic frequencies of the i th SNP marker in the j th population.
Bayesian analysis
We implemented a Bayesian Analysis named SelEstim introduced by Vitalis et al. (Reference Vitalis, Gautier, Dawson and Beaumont2014). This procedure employs a hierarchical Bayesian model to identify polymorphisms under selection from the background of neutral (or almost neutral) variation, and it estimates the intensity of such selection. The sampling distribution of the allele count at each locus with states A and a within each deme or subpopulation (‘breed’, in our implementation) is modeled by a binomial process:
 $$L\left( {\left. {p_{{ij}} } \right|n_{{ij}} } \right)\,{\equals}\,\left( {\matrix{ {n_{{ij}} } \cr {x_{{ij}} } \cr } } \right)p_{{ij}}^{{x_{{ij}} }} (1{\minus}p_{{ij}} )^{{n_{{ij}} {\minus}x_{{ij}} }} ,$$
where, p ij is the allelic frequency of the state A, x ij the corresponding number of observed alleles and n ij is the total number of alleles at the i th locus within the j th subpopulation. In the first level of the hierarchy, the distribution of p ij is derived after the assumption of a stationary density of a diffusion process (Vitalis et al., Reference Vitalis, Gautier, Dawson and Beaumont2014):
 $$\eqalign { & \varphi \left( {\left. {p_{{ij}} } \right|M_{j} ,\sigma _{{ij}} ,\kappa _{{ij}} ,\pi _{i} } \right) \cr& \,{\equals}\, C^{{{\minus}1}} \,{\rm exp}\left( {\sigma _{{ij}} \tilde{p}_{{ij}} } \right)p_{{ij}}^{{M_{j} \pi _{i} {\minus}1}} (1{\minus}p_{{ij}} )^{{M_{j} (1{\minus}\pi _{i} ){\minus}1}} $$
where C is a constant that ensures that the distribution integrates to 1 (Vitalis et al., Reference Vitalis, Gautier, Dawson and Beaumont2014),
 $\tilde{p}_{{ij}} \,\equiv\,\kappa _{{ij}} \left( {1{\minus}p_{{ij}} } \right){\plus}(1{\minus}\kappa _{{ij}} )p_{{ij}} $
is the frequency of the selected allele for the i
th locus and the j
th population, M
j
=4N
j
m
j
and σ
ij
=2N
j
s
ij
are the scaled migration parameter (m
j
) for the j
th population and coefficient of selection (s
ij
) for the j
th population and the i
th locus, N
j
is the effective population size of the j
th population, κ
ij
is an indicator variable which takes either the value 0 if allele A is selected or 1 if allele a is selected, and π
i
is the frequency of the allele A in the pool of migrants for the i
th locus. In the second level of the hierarchy, κ
ij
is assumed to follow a Bernoulli (0.5) distribution, π
i
a β(1,1) distribution, and M
j
a Log-uniform distribution bounded to the interval (0.001; 10 000). In the third level, the scaled coefficient of selection follows an exponential distribution:
 $\left. {\sigma _{{ij}} } \right|\delta _{i} \sim \exp \left( {\delta _{i}^{{{\minus}1}} } \right)$
, with δ
i
being an hyper-parameter that represents the average effect of selection at the i
th locus over all subpopulations. Finally, this latter parameter is modeled through an exponential distribution:
 $\left. {\delta _{i} } \right|\lambda \sim \exp \left( {\lambda ^{{{\minus}1}} } \right)$
, where, in turn,
 $$\left. \lambda \right|\Lambda \sim \exp \left( {\Lambda ^{{{\minus}1}} } \right)$$
, with Λ=1. The procedure provides two measures of differentiation between populations, the above-mentioned average effect of selection (δ) and the Kullback–Leiber divergence (KLD). The first parameter (δ) corresponds to an hyper-parameter than summarized the strength of the dispersion between populations at each specific locus, whereas the second (KLD) measures the distance of the posterior distribution of δ from a centering distribution that represents the neutral demographic history of the populations. Further, the method also provided the coefficient of selection (σ
ij
) for each locus within each breed, the allele selected (κ
ij
) in each breed and locus, and the migration parameter (M
j
for each breed). The procedure was implemented by means of Markov Chain Monte Carlo method through the software SelEstim, available at http://www1.montpellier.inra.fr/CBGP/software/selestim/.
Identification of genome regions
In order to locate genomic regions associated with the differentiation between the Spanish breeds studied, we used the calibration option provided by the SelEstim software that compute a set of thresholds defined by the percentiles of the KLD distribution calculated in a pseudo observed data set generated from the estimated posterior distribution. The 50%, 90%, 95%, 98%, 99%, 99.5%, 99.9%, 99.95% and 99.99% percentiles were considered. In first place, we identified the SNPs with KLD over the threshold and, after that, they were grouped into the same region if the distance between them was <1 Mb. The genomic regions that showed at least one SNP over the 99.99% percentile were subsequently cross-referenced with the ENSEMBL database (Flicek et al., Reference Flicek, Amode, Barrell, Beal, Billis, Brent, Carvalho-Silva, Clapham, Coates, Fitzgerald, Gil, García-Girón, Gordon, Hourlier, Hunt, Johnson, Juettemann, Kähäri, Keenan, Kulesha, Martin, Maurel, McLaren, Murphy, Nag, Overduin, Pignatelli, Pritchard, Pritchard, Riat, Ruffier, Sheppard, Taylor, Thormann, Trevanion, Vullo, Wilder, Wilson, Zadissa, Aken, Birney, Cunningham, Harrow, Herrero, Hubbard, Kinsella, Muffato, Parker, Spudich, Yates, Zerbino and Searle2014) by means of the Biomart tools (http://www.biomart.org/index.html) to identify potential genes involved in the process (Kasprzyk., Reference Kasprzyk2011).
Results
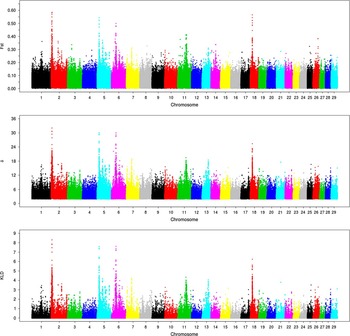
The average F ST value along the 703 707 analyzed SNP was 0.050, with a SD of 0.033. However, the F ST estimates varied enormously across genomic regions, and some of them showed remarkable differences with respect to the average value. The specific SNP F ST estimates were very similar to the selection indicators provided by the SelEstim Bayesian analysis (KLD and δ) as is shown in Figure 1. Given the similarity of the results and the availability of significance thresholds, the interpretation of the results was focused on the results of the KLD estimates provided by SelEstim.
Results of the F ST , average effect of selection (δ) and Kullback–Leiber divergence (KLD) between seven Spanish autochthonous beef cattle populations along the bovine autosome using the BovineHD Beadchip.

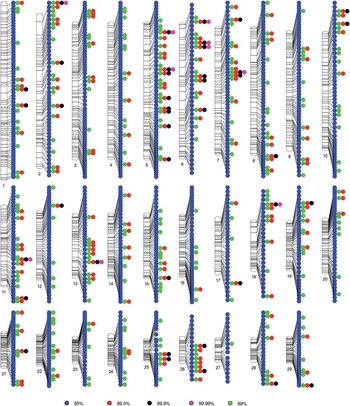
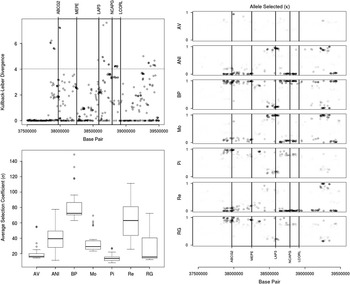
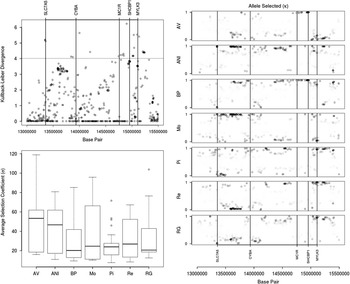
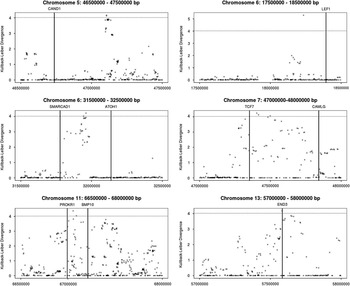
The significance thresholds were calculated by using the calibration option of the SelEstim software that provided the following values for the relevant quantiles of the KLD: 0.0204 (50%), 0.0850 (90%), 0.2465 (95%), 0.7753 (98%), 1.3613 (99%), 1.8954 (99.50%), 2.8659 (99.90%), 3.2122 (99.95%) and 4.0253 (99.99%). A total of 29 737 SNPs had KLD estimates over the 95% quantile, and 9331, 3972, 2098, 870, 605 and 231 SNPs over the 98%, 99%, 99.50%, 99.9%, 99.95% and 99.99% percentiles, respectively. Further, we identified the genomic regions that contained at least three SNPs (within 1 Mb) over the 95% quantile, and we detected up to 1178 genomic regions covering the whole autosomal genome (see Figure 2). In the same figure, the genomic regions with a maximum KLD higher than the 99%, 99.5%, 99.9% and 99.99% quantiles were also highlighted. In fact, when the significance threshold was set to an extremely restrictive 99.99% quantile, only 10 genomic regions were identified (see Table 1). Four of them were associated to a large number of significant SNPs (27 to 123) and higher values of KLD (>6.0), whereas another six were identified with a scarce number of SNP (1 to 3). The first four corresponded to BTA 2 (5 575 950to 10 152 228 base pairs (bp)), BTA 5 (17 596 734 to 18 850 702 bp), BTA 6 (37 853 912 to 39 441 548 bp) and BTA 18 (13 345 515 to 15 243 838 bp), and their results are presented in depth in Figures 3 to 6, where detailed plots of the KLD estimates, the average population-specific coefficient of selection (σ ij ) and the allele selected estimates (κ ij ) for each population are presented. A deeper look into these regions is deferred to the discussion. The results of the remaining six genomic regions are presented in Figure 7 and also briefly discussed in the next section.
Genomic regions with Kullback–Leiber Divergence (KLD) estimates over the 95%, 99%, 99.5%, 99.9% and 99.99% quantile of the KLD distribution in the pseudo-observed data set.

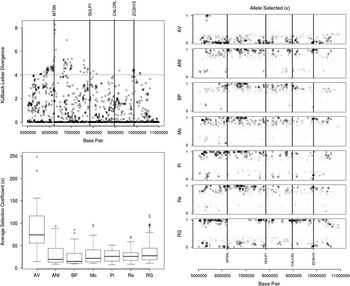
Plot of the Kullback–Leiber Divergence (KLD), boxplot of population-specific selection coefficient (σ ij ) and plot of the allele selected (κ ij ) within a genomic region of the chromosome 2 between 5,000,000 and 11,000,000 base pairs. RG=Rubia Gallega; Re=Retinta; Pi=Pirenaica; MO=Morucha; BP=Bruna dels Pirineus; ANI=Avileña-Negra Ibérica; AV=Asturiana de los Valles; MSTN=Myostatin, GULP1=GULP, engulfment adaptor PTB domain containing 1; CALCRL=Calcitonin receptor-like; ZC3H15=zinc finger CCCH-type containing 15.

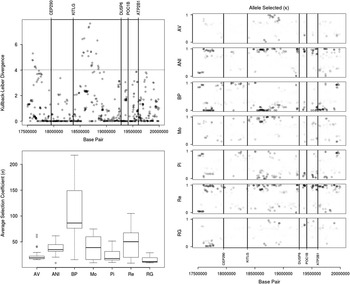
Plot of the Kullback–Leiber divergence, boxplot of population-specific selection coefficient (σ ij ) and plot of the allele selected (κ ij ) within a genomic region of chromosome 5 between 17 500 000 and 20 000 000 base pairs. RG=Rubia Gallega; Re=Retinta; Pi=Pirenaica; MO=Morucha; BP=Bruna dels Pirineus; ANI=Avileña-Negra Ibérica; AV=Asturiana de los Valles; CEP290=Centrosomal Protein, 290-KD; KIT-LG=KIT Ligand; DUSP6=Dual Specificity Phosphatase 6; POC1B=POC1 centriolar protein B; ATP2B1=ATPase, Ca++ transporting, plasma membrane 1.

Plot of the Kullback–Leiber divergence, boxplot of population-specific selection coefficient (σ ij ) and plot of the allele selected (κ ij ) within a genomic region of the chromosome 6 between 37 500 000 and 39 500 000 base pairs. RG=Rubia Gallega; Re=Retinta; Pi=Pirenaica; MO=Morucha; BP=Bruna dels Pirineus; ANI=Avileña-Negra Ibérica; AV=Asturiana de los Valles; ABCG2=ATP-binding cassette sub-family G member 2; MEPE=Matrix Extracellular Phosphoglycoprotein; LAP3=leucine aminopeptidase 3; NCAPG=non-SMC condensing I complex, subunit G); LCORL=ligand dependent nuclear receptor corepressor-like.

Plot of the Kullback–Leiber divergence, boxplot of population-specific selection coefficient (σ ij ) and plot of the allele selected (κ ij ) within a genomic region of the chromosome 18 between 13 000 000 and 15 500 000 base pairs. RG=Rubia Gallega; Re=Retinta; Pi=Pirenaica; MO=Morucha; BP=Bruna dels Pirineus; ANI=Avileña-Negra Ibérica; AV=Asturiana de los Valles; SLC7A5=Solute carrier family 7 member 5; CYBA=Cytochrome B-245 Alpha Chain; MC1R=Melanocortin 1 receptor; SHCBP1=SHC binding and spindle associated 1; MYLK3=Myosin light chain kinase 3.

Plot of the Kullback–Leiber divergence in six genomic regions in chromosomes 5, 6, 7, 11 and 13. CAND1=cullin associated and neddylation dissociated 1; LEF1=lymphoid enhancer binding factor 1; SMARCAD1=SWI/SNF-related matrix-associated actin-dependent regulator of chromatin subfamily A containing DEAD/H box 1; ATOH1=Atonal BHLH Transcription Factor 1; TCF7=Transcription Factor 7; CAMLG=Calcium Modulating Ligand; PROKR1=Prokineticin receptor 1; BMP10=Bone Morphogenetic Protein 10; END3=Endothelin 3.

Genomic regions with highest signals of differentiation (Kullback–Leiber divergence (KLD) >4.02) between seven Spanish autochthonous beef cattle populations and using the BovineHD 777 K BeadChip

BTA=Bos taurus chromosome; SNP=single nucleotide polymorphism.
In addition, the output of the Bayesian Analysis procedure provided estimates of the migration parameters (M j ), which measure the relative admixture of each breed with respect to a joint pool of all of them. This parameter is scaled by the effective size (i.e. M j =4N j m j ). However, several studies had shown that there are not large differences in effective size for the breeds (Cañas-Álvarez et al. Reference Cañas-Álvarez, Gónzalez-Rodríguez, Martín-Collado, Avilés, Altarriba, Baro, De la Fuente, Diaz, Molina, Varona and Piedrafita2014 and Reference Cañas-Álvarez, Mouresan, Varona, Díaz, Molina, Baro, Altarriba, Carabaño, Casellas and Piedrafita2016), and thus the estimates are comparable among breeds. The AV breed showed the largest scaled migration rate, with an estimate of 61.42±0.21, as compared with the rest of the populations whose values ranged between 16.46 for the Pi breed to 28.17 for the Mo breed. This indicates that the AV population has exchanged immigrants with a higher rate than the other breeds.
Discussion
In this study, we applied two genome-wide selection signature tests on SNP genotype data collected from seven autochthonous Spanish beef cattle breeds: the F ST statistic, and the SelEstim procedure. The results of both procedures were very similar as illustrated in Figure 1. These results verified the robustness of the classical F ST methodology against slight departures from its assumptions. Nevertheless, the SelEstim procedure offered a wider and richer spectrum of inference, as it provided not only an estimate of the average effect of selection for each locus, but also indicated the direction and intensity of selection within each of the subpopulations. In fact, the SelEstim procedure takes into account the whole process of differentiation between populations trough the prior distribution, whereas the F ST analyzes each SNP isolated from the rest of the genome. In fact, the KLD estimate compares the distribution of δ with a reference centering distribution that considers the process of neutral demographic history of the populations and identify the SNP whose differentiation exceed from the expected given the information provided for all SNP markers. In addition, it provided an estimate of the migration rate among the breeds. In this respect, the value of the migration parameter (M j ) was close between all populations (16.46 to 28.17) with the only exception of the AV breed (61.42). Our results indicate that the AV breed has exchanged immigrants with a higher rate than the other breeds. This result is coherent with the cluster analysis by Cañas-Álvarez et al. (Reference Cañas-Álvarez, Gónzalez-Rodríguez, Munilla, Varona, Díaz, Baro, Altarriba, Molina and Piedrafita2015), who highlighted the central placement of the AV breed within the Spanish populations. The AV breed has been broadly used as a terminal sire line all over Spain, and this may explain the results obtained as some crossbred individuals could be incorporated into the receptor populations.
The identification of genomic regions associated with the differentiation of the populations was presented in Figure 2. When the significance threshold was set to the 95% percentile of the calibration study, the number of genome regions associated with processes of differentiation between populations was huge and covered practically all the autosomal genome. This large amount of genomic regions may indicate that the processes of selection or adaptation associated with the breed formation have involved a very large number of genes or genetic polymorphism with minor effects. However, as the significance threshold become more restrictive, the number of genomic regions diminished to only 10 genomic regions if the 99.99% percentile was applied. Nevertheless, this significance threshold involves the presence of a false positive every 10 000 neutral loci, approximately. Given that 703 707 SNP were analyzed, close to 70 false positive SNP were expected. Thus, if we consider each SNP independently, the expected proportion of false positives is around 0.3 (70 out of 231 significant SNP). Nonetheless, some genomic regions (Table 1) must be highlighted given that they comprised a larger number of significant SNP within a narrow genome region.
The first one was located in BTA 2, and it contains a wide genomic area of >5 Mb of the chromosome. The detailed results of the KLD, the average population-specific coefficient of selection (σ ij ) and the allele selected (κ ij ) estimates are presented in Figure 3. The largest KLD estimate was located very close to the MSTN (Myostatin) gene, and corresponds to the SNP positioned at 6 265 652 bp. The MSTN gene is associated with the double-muscle phenotype (Grobet et al., Reference Grobet, Martin, Poncelet, Pirottin, Brouwers, Riquet, Schoeberlein, Dunner, Ménissier, Massabanda, Fries and Hanset1997), and it has already been associated with signatures of selection (Gutiérrez-Gil et al., Reference Gutiérrez-Gil, Arranz and Wiener2015) and with important reductions in the level of heterozygosity in double-muscled populations (Wiener and Gutierrez-Gil, Reference Wiener and Gutiérrez-Gil2009). It is known that the AV population has been selected to increase the frequency of alleles associated with this trait, whereas in the rest of the breeds, with the only exception of RG, the policy was to avoid the presence of double-muscle individuals because of its association with calving difficulty (Bellinge et al., Reference Bellinge, Liberles, Iaschi, O’Brien and Tay2005) and the difficulty to deal with that under the extensive management conditions. The evidences in favor of the MSTN gene as the main candidate gene were strong because of (1) the confirmation of the presence of recent selection in the AV population by the average effect of selection, where it yielded the highest average value (σ ij =84.29); and (2) the results of the allele selected estimates (κ ij ) where the pattern of the AV population was clearly different of the remaining populations in a large genomic region (between 5 000 000 and 7 000 000). However, this pattern differed at both sides of the genome surrounding the MSTN gene. In the genomic region located before it (5 000 000 to 6 000 000 bp) there were strong differences between the AV and the Pi and RG populations, whereas between the base pairs 6 500 000 and 7 000 000 the dissimilarities between RG and AV population were clearly diminished, while there was a very clear discrepancy between AV and rest of the breeds. These results can be attributed to the well-known haplotype diversity of the MSTN gene (Dunner et al., Reference Dunner, Miranda, Amigues, Cañon, Georges, Hanset, Williams and Ménissier2003) that could imply that each population had a different pattern of linkage disequilibrium with the adjacent genome region.
Nevertheless, this genomic region is extremely large, and it is plausible that some other genes were also involved in the process of breed differentiation. Among them, three genes must be highlighted, as they are located close to local maximums of the KLD. The first one is the GULP1 (GULP, engulfment adaptor PTB domain containing 1), the second in the CALCRL (Calcitonin receptor-like), that were also suggested by Zhao et al. (Reference Zhao, McParland, Kearney, Du and Berry2015) as candidate for selection in the Limousin population, and the third is the ZC3H15 (zinc finger CCCH-type containing 15). A more detailed look of the allele-selected plot indicates that in the genomic region surrounding the first two genes there was a stronger selection signal associated with the RG population, whereas in the third gene the AV and RG populations were selected in one direction and ANI, Mo and Re in the opposite sense.
The second region detected is located in BTA 5, with the largest signal at 18 667 664 bp. The detailed results are presented in Figure 4. The most relevant candidate gene within this region was the KIT-LG (KIT Ligand), which encodes a protein that binds to the tyrosine–kinase receptor. It has been associated with the roan pigmentation (Seitz et al., Reference Seitz, Schmutz, Thue and Buchanan1999) and is also involved in the signaling pathway mediating the regulation of oocytes growth and follicular development (Panwar et al., Reference Panwar, Rawal, Sehgal and Ali2015). However, the maximum KLD was located in an empty region found between KIT-LG and DUSP6 (Dual Specificity Phosphatase 6) that is involved in regulation of MAPK activity that coordinately regulate cell proliferation, differentiation, motility and survival (Cargnello and Roux, Reference Cargnello and Roux2012). In addition, there was a regional maximum located around 17.6 Mb, whose closer gene is the CEP290 (Centrosomal Protein, 290-KD) that plays a role in the centrosome and cilia development and has been associated with several pathologies (Coppieters et al., Reference Coppieters, Lefever, Leroy and De Baere2010). The results of the population-specific selection coefficient indicated the largest evidence of selection is in the BP population, with an average σ ij of 107.67. Moreover, the results of the allele selected (κ ij ) identified opposite selection processes for BP and Pi in one direction, and for ANI, Mo and Re for another, and suggested also relevant signals of selection surrounding the POC1B (POC1 centriolar protein B) and ATP2B1 (ATPase, Ca++ transporting, plasma membrane 1) genes. Given the available information, it is not clear what is the gene or polymorphism affected by the processes of selection or adaptation. Although none of the populations present roan pigmentation, an alternative polymorphism in the KIT-LG seems to be a good candidate, as the genetic pathways of skin pigmentation are not fully described and they involve a very complex network (Picardo and Cardinali, Reference Picardo and Cardinali2011). In fact, Pauchs et al. (Reference Pauchs, Wang, Jung, Krogmeier, Edel, Emmerling, Götz and Fries2012) identified a QTL in this region for pigmentation surrounding the eyes of Fleckvieh cattle, suggesting that the polymorphism in the KIT-LG can be involved in additional coat color phenotypes.
The third relevant genomic region was identified in BTA 6, with the largest signal at 38 704 872 bp (Figure 5). This genomic region in BTA 6 has been detected in several genome-wide association studies in cattle. Among them, Saatchi et al. (Reference Saatchi, Schnabel, Taylor and Garrick2014) linked the region with a great number of traits, including birth weight, calving ease, carcass weight, marbling, mature weight, ribeye muscle area, weaning weight, yield grade and yearling weight. Their study confirmed results previously reported for BW, growth and carcass traits (Snelling et al., Reference Snelling, Allan, Keele, Kuehn, McDaneld, Smith, Sonstegard, Thallman and Bennett2010), calving ease (Bongiorni et al., Reference Bongiorni, Mancini, Chillemi, Pariset and Valentini2012), reproductive traits (Maltecca et al., Reference Maltecca, Weigel, Khatib, Cowan and Bagnato2009) and feed efficiency (Snelling et al., Reference Snelling, Allan, Keele, Kuehn, McDaneld, Smith, Sonstegard, Thallman and Bennett2010). Among the genes located closely to the largest signal, Bongiorni et al. (Reference Bongiorni, Mancini, Chillemi, Pariset and Valentini2012) and Saatchi et al. (Reference Saatchi, Schnabel, Taylor and Garrick2014) highlighted the LAP3 (leucine aminopeptidase 3), NCAPG (non-SMC condensing I complex, subunit G) and LOCRL (ligand dependent nuclear receptor corepressor-like). Moreover, Kemper et al. (Reference Kemper, Saxton, Bolormaa, Hayes and Goddard2014) reported a strong signal surrounding the ABCG2 (ATP-binding cassette sub-family G member 2) gene, located in the proximity of the region and associated with milk yield and composition (Cohen-Zinder et al., Reference Cohen-Zinder, Seroussi, Larkin, Loor, Everts-van der Mind, Lee, Drackley, Band, Hernández, Shani, Lewin, Weller and Ron2005), and the MEPE (Matrix Extracellular Phosphoglycoprotein) gene was also suggested as candidate for protein and fat percentage (Ron et al., Reference Ron, Kliger, Feldmesser, Seroussi, Ezra and Weller2001). From an alternative point of view, this genomic region has also been associated with signatures of selection in numerous studies (Gutiérrez-Gil et al., Reference Gutiérrez-Gil, Arranz and Wiener2015). In addition, the results of the population-specific selection coefficient indicate a relevant presence of selection in BP and Re populations. Moreover, the results of the allele selected (κ ij ) identified the most relevant signals surrounding the above-mentioned genes and an empty region between 39 000 000 and 39 500 000 bp. In addition, two groups of populations that suffer opposite selection processes can be recognized. On one hand, the ANI, Mo and Re breeds, and, on the other, the BP, Pi and RG breeds, whereas the AV population occupied an intermediate position. These two clusters are known to be geographically separated: where BP, Pi and RG individuals are reared in Northern Spain, and ANI, Mo and Re breeds are typically reared in wooded rangelands of Central and Southern Spain. Moreover, these last three breeds are traditionally classified as maternal breeds in commercial crossbreeding, whereas the first ones are commonly used as paternal breeds. Finally, the grouping is also consistent with the classical morphological classification into Red Convex (BP, Pi and RG), Black Orthoid (Re, Mo and ANI) and Brown Concave (AV) trunks (Cañas-Álvarez et al., Reference Cañas-Álvarez, Gónzalez-Rodríguez, Munilla, Varona, Díaz, Baro, Altarriba, Molina and Piedrafita2015).
Finally, the last major genomic region identified is located on chromosome 18 (13.3 to 16.4 Mb). The maximum signal was located at 14 898 873 bp, close to the SHCBP1 (SHC binding and spindle associated 1) gene whose function is related to the fibroblast growth factor receptor signaling in neural progenitor cells (Chen et al., Reference Chen, Lai and Niswander2012) and in the neighborhood of the MC1R (Melanocortin 1 receptor) and the MYLK3 (Myosin light chain kinase 3) genes. The MC1R gene influences the production of eumelanin and pheomelanin pigments (Werth et al., Reference Werth, Hawkins, Eggen, Petit, Elduque, Kreigesmann and Bishop1996), and it has already been reported as subjected to strong selection in domestic cattle (Gutiérrez-Gil et al., Reference Gutiérrez-Gil, Arranz and Wiener2015) and the MYLK3 gene codified a specific myosin light chain kinase (Seguchi et al., Reference Seguchi, Takashima, Yamazaki, Asakura, Asano, Shintani, Wakeno, Minamino, Kondo, Furukawa, Nakamuru, Naito, Takahashi, Ohtsuka, Kawakami, Isomura, Kitamura, Tomoike, Mochizuki and Kitakaze2007). Among them, the MC1R appears as the most plausible candidate to be associated with the processes of differentiation and selection in other cattle populations (Gutiérrez-Gil et al., Reference Gutiérrez-Gil, Arranz and Wiener2015). However, the genomic region is very wide and two local maximum must be also pointed out. The first one is located at 13 347 873 bp and includes the SLC7A5 (Solute carrier family 7 member 5) gene that is involved in the transportation of larger amino acids (Mastroberardino et al., Reference Mastroberardino, Spindler, Pfeiffer, Skelly, Loffing, Shoemaker and Verrey2008) and thyroid hormones across the placenta (Ritchie and Taylor, Reference Ritchie and Taylor2001) and plays a role in neuronal cell proliferation in brain (Verrey, Reference Verrey2003) and the second comprised of the region between 13 841 371 and 14 203 334 bp and includes the CYBA (Cytochrome B-245 Alpha Chain) gene that encodes the α-subunit of cytochrome b-245 (De Boer et al., Reference De Boer, de Klein, Hossle, Seger, Corbeel, Weening and Roos1992), that forms part of the NADPH oxidase complex and is related with the immune and inflammatory response (Sumimoto, Reference Sumimoto2008). The results of the average selection coefficient (σ ij ) and the allele selected (κ ij ) were very variable within breed. The region between 13 400 000 and 13 700 000 bp presents a clear divergence between ANI and Mo with the Re population, the region surrounding the MC1R and SHCBP1 is associated with a signal of selection in the AV and BP populations, whereas in the vicinity of the MYLK3 gene, the Mo and AV seem to diverge from the remaining populations.
In addition to the four regions just described, six additional genomic regions were associated with at least one SNP with a KLD estimate over the 99.9% threshold. The first one is located in chromosome 5 and had a maximum at the 47 106 208 bp. The closest gene is the CAND1 (cullin associated and neddylation dissociated 1) gene, but, in the vicinity is located the HMGA2 (High-mobility group AT-hook) gene, previously associated with stature (Pryce et al., Reference Pryce, Hayes, Bolormaa and Goddard2011). Moreover, the chromosome 6 included two additional genomic regions. The first one had a maximum at 18 234 064 bp and the most plausible candidate gene in the surrounding region is the LEF1 (lymphoid enhancer binding factor 1), that encodes a transcription factor regulating the promoter of the MITF (Microphthalmia-associated transcription factor) gene (Lin and Fisher, Reference Lin and Fisher2007), involved in melanocyte development (Levy and Fisher, Reference Levy and Fisher2011). Further, the second one had a maximum at the 31 960 756 bp, between the SMARCAD1 (SWI/SNF-related matrix-associated actin-dependent regulator of chromatin subfamily A containing DEAD/H box 1) and the ATOH1 (Atonal BHLH Transcription Factor 1) genes.
The genomic region of the BTA 7 with maximum at 47 403 824 bp included as potential candidate genes the TCF7 (Transcription Factor 7) and CAMLG (Calcium Modulating Ligand) genes that are associated with the processes of differentiation (Van de Wetering et al., Reference Van de Wetering, Oostewegel, Dooijes and Clevers1991) and activation of lymphocyte T (Bram et al., Reference Bram, Valentine, Shaphiro, Jenkins, Gilbert and Copeland1996). Regarding the genomic region on BTA 11, the maximum KLD was located at 67 055 100 bp which is located between the BMP10 (Bone Morphogenetic Protein 10) gene, associated with cardiac growth (Chen et al., Reference Chen, Shi, Acosta, Li, Lu, Bao, Chen, Yang, Schneider, Chien, Conway, Yoder, Haneline, Franco and Shou2004), and the PROKR1 (Prokineticin receptor 1) gene that has been associated with fertility (Stella et al. Reference Stella, Ajmone-Marsan, Lazzari and Boettcher2010; Rothammer et al., Reference Rothammer, Seichter, Förster and Medugorac2013). Finally, the last region is located at BTA 13 (57 582 480 bp) and surrounds the END3 (Endothelin 3) gene that plays a role in the migration and survival of melanocytes (Bennet and Lamoreux, Reference Bennet and Lamoreux2003) and it has been associated with red color (Dorshorst et al., Reference Dorshorst, Henegar, Liao, Sällman-Almén, Rubin, Ito, Wakamatsu, Stothard, Van Doormaal, Plastow, Barsh and Andersson2015).
In contrast, some of the regions of the genome that have been broadly described as associated with signatures of selection (Gutiérrez-Gil et al., Reference Gutiérrez-Gil, Arranz and Wiener2015) did not arise as significant in our study. Among them, we should highlight the DGAT1 (Diacylglycerol O-Acyltransferase Homolog 1) and the POLL (polymerase (DNA directed), lambda) genes, in BTA 14 and BTA 26, respectively. The DGAT1 has been associated with different fat content and fat composition in milk production, whereas the POLL regulates the presence of horns. The absence of signatures of selection for these loci may be related to the fact that none of the breeds studied is nowadays oriented to milk production, neither do they show the poll phenotype.
Summarizing, both the F ST and the SelEstim methods identified a very large number of genomic regions with a degree of differentiation larger than expected. However, when very restrictive significance threshold were applied, the number of genomic regions was reduced to 10. Among them, four regions were associated with larger signals and number of significant SNP. Apparently, they harbor very clear candidate genes, such as the MSTN (BTA 2), the KIT-LG (BTA 5), and the MC1R (BTA 18) genes. However, when they are analyzed in depth a more complex pattern of differentiation can be observed, probably caused by the presence of more than one gene associated with selection or adaptation within those regions or by a complex haplotype structure of those genes that can be linked to range of selection intensities.
With respect to the performance of the procedures, both methods provide similar results, although the Bayesian procedure (SelEstim) uses the information provided by all SNP markers to determine a neutral evolutionary pattern that it is summarized on the hyper-parameters of the prior distributions and allow to identify departures from a null hypothesis of neutral evolution. Thus, it provides a richer inference and a definition of significance thresholds that made it a good option to analyze allelic frequency data from populations of common genetic origin.
Acknowledgments
The research leading to these results has received funding from Ministerio de Ciencia e Innovación AGL 2010-15,903 grant from the Spanish government, and from the European Union’s Seventh Framework Programme for research, technological development and demonstration under grant agreement no. 289,592 – Gene2Farm. The collaboration of Breed societies in collecting samples and the support of FEAGAS is also acknowledged. J.J.C.-Á. acknowledges the financial support given by COLCIENCIAS through the Francisco José de Caldas fellowship 497/2009 and A.G.-R. acknowledges the financial support given by the Spanish government BES-2011-045,434 fellowship.