




%20--%3e%3c!DOCTYPE%20svg%20PUBLIC%20'-//W3C//DTD%20SVG%201.0//EN'%20'http://www.w3.org/TR/2001/REC-SVG-20010904/DTD/svg10.dtd'%3e%3csvg%20version='1.0'%20id='Layer_1'%20xmlns='http://www.w3.org/2000/svg'%20xmlns:xlink='http://www.w3.org/1999/xlink'%20x='0px'%20y='0px'%20width='64px'%20height='64px'%20viewBox='5.5%20-3.5%2064%2064'%20enable-background='new%205.5%20-3.5%2064%2064'%20xml:space='preserve'%3e%3cg%3e%3ccircle%20fill='%23FFFFFF'%20fill-opacity='0'%20cx='37.785'%20cy='28.501'%20r='28.836'/%3e%3cpath%20fill='%23595959'%20d='M37.441-3.5c8.951,0,16.572,3.125,22.857,9.372c3.008,3.009,5.295,6.448,6.857,10.314%20c1.561,3.867,2.344,7.971,2.344,12.314c0,4.381-0.773,8.486-2.314,12.313c-1.543,3.828-3.82,7.21-6.828,10.143%20c-3.123,3.085-6.666,5.448-10.629,7.086c-3.961,1.638-8.057,2.457-12.285,2.457s-8.276-0.808-12.143-2.429%20c-3.866-1.618-7.333-3.961-10.4-7.027c-3.067-3.066-5.4-6.524-7-10.372S5.5,32.767,5.5,28.5c0-4.229,0.809-8.295,2.428-12.2%20c1.619-3.905,3.972-7.4,7.057-10.486C21.08-0.394,28.565-3.5,37.441-3.5z%20M37.557,2.272c-7.314,0-13.467,2.553-18.458,7.657%20c-2.515,2.553-4.448,5.419-5.8,8.6c-1.354,3.181-2.029,6.505-2.029,9.972c0,3.429,0.675,6.734,2.029,9.913%20c1.353,3.183,3.285,6.021,5.8,8.516c2.514,2.496,5.351,4.399,8.515,5.715c3.161,1.314,6.476,1.971,9.943,1.971%20c3.428,0,6.75-0.665,9.973-1.999c3.219-1.335,6.121-3.257,8.713-5.771c4.99-4.876,7.484-10.99,7.484-18.344%20c0-3.543-0.648-6.895-1.943-10.057c-1.293-3.162-3.18-5.98-5.654-8.458C50.984,4.844,44.795,2.272,37.557,2.272z%20M37.156,23.187%20l-4.287,2.229c-0.458-0.951-1.019-1.619-1.685-2c-0.667-0.38-1.286-0.571-1.858-0.571c-2.856,0-4.286,1.885-4.286,5.657%20c0,1.714,0.362,3.084,1.085,4.113c0.724,1.029,1.791,1.544,3.201,1.544c1.867,0,3.181-0.915,3.944-2.743l3.942,2%20c-0.838,1.563-2,2.791-3.486,3.686c-1.484,0.896-3.123,1.343-4.914,1.343c-2.857,0-5.163-0.875-6.915-2.629%20c-1.752-1.752-2.628-4.19-2.628-7.313c0-3.048,0.886-5.466,2.657-7.257c1.771-1.79,4.009-2.686,6.715-2.686%20C32.604,18.558,35.441,20.101,37.156,23.187z%20M55.613,23.187l-4.229,2.229c-0.457-0.951-1.02-1.619-1.686-2%20c-0.668-0.38-1.307-0.571-1.914-0.571c-2.857,0-4.287,1.885-4.287,5.657c0,1.714,0.363,3.084,1.086,4.113%20c0.723,1.029,1.789,1.544,3.201,1.544c1.865,0,3.18-0.915,3.941-2.743l4,2c-0.875,1.563-2.057,2.791-3.541,3.686%20c-1.486,0.896-3.105,1.343-4.857,1.343c-2.896,0-5.209-0.875-6.941-2.629c-1.736-1.752-2.602-4.19-2.602-7.313%20c0-3.048,0.885-5.466,2.658-7.257c1.77-1.79,4.008-2.686,6.713-2.686C51.117,18.558,53.938,20.101,55.613,23.187z'/%3e%3c/g%3e%3c/svg%3e)
%20--%3e%3c!DOCTYPE%20svg%20PUBLIC%20'-//W3C//DTD%20SVG%201.0//EN'%20'http://www.w3.org/TR/2001/REC-SVG-20010904/DTD/svg10.dtd'%3e%3csvg%20version='1.0'%20id='Layer_1'%20xmlns='http://www.w3.org/2000/svg'%20xmlns:xlink='http://www.w3.org/1999/xlink'%20x='0px'%20y='0px'%20width='64px'%20height='64px'%20viewBox='5.5%20-3.5%2064%2064'%20enable-background='new%205.5%20-3.5%2064%2064'%20xml:space='preserve'%3e%3cg%3e%3ccircle%20fill='%23FFFFFF'%20fill-opacity='0'%20cx='37.637'%20cy='28.806'%20r='28.276'/%3e%3cg%3e%3cpath%20fill='%23595959'%20d='M37.443-3.5c8.988,0,16.57,3.085,22.742,9.257C66.393,11.967,69.5,19.548,69.5,28.5c0,8.991-3.049,16.476-9.145,22.456%20C53.879,57.319,46.242,60.5,37.443,60.5c-8.649,0-16.153-3.144-22.514-9.43C8.644,44.784,5.5,37.262,5.5,28.5%20c0-8.761,3.144-16.342,9.429-22.742C21.101-0.415,28.604-3.5,37.443-3.5z%20M37.557,2.272c-7.276,0-13.428,2.553-18.457,7.657%20c-5.22,5.334-7.829,11.525-7.829,18.572c0,7.086,2.59,13.22,7.77,18.398c5.181,5.182,11.352,7.771,18.514,7.771%20c7.123,0,13.334-2.607,18.629-7.828c5.029-4.838,7.543-10.952,7.543-18.343c0-7.276-2.553-13.465-7.656-18.571%20C50.967,4.824,44.795,2.272,37.557,2.272z%20M46.129,20.557v13.085h-3.656v15.542h-9.944V33.643h-3.656V20.557%20c0-0.572,0.2-1.057,0.599-1.457c0.401-0.399,0.887-0.6,1.457-0.6h13.144c0.533,0,1.01,0.2,1.428,0.6%20C45.918,19.5,46.129,19.986,46.129,20.557z%20M33.042,12.329c0-3.008,1.485-4.514,4.458-4.514s4.457,1.504,4.457,4.514%20c0,2.971-1.486,4.457-4.457,4.457S33.042,15.3,33.042,12.329z'/%3e%3c/g%3e%3c/g%3e%3c/svg%3e)
1. Introduction
The dynamics of a flame in a turbulent pre-mixture of fuel and oxidant is of central importance to combustion processes and plays a key role in present-day power generation and propulsion engines. The fluctuating motion of the flame surface, which separates burned from unburned gases, is the result of a complex interplay between the propagation speed or burning velocity of the flame (which is determined by its inner chemical structure) and the multi-scale turbulent velocity field of the carrier flow (Peters Reference Peters2000; Driscoll Reference Driscoll2008; Lipatnikov & Chomiak Reference Lipatnikov and Chomiak2010; Steinberg, Hamlington & Zhao Reference Steinberg, Hamlington and Zhao2021). The outcome is a fractal flame surface with spatial fluctuations spanning a wide range of length scales, from the size of the system down to the scale of dissipative processes (Gouldin Reference Gouldin1987; Peters Reference Peters1988; Gülder et al. Reference Gülder, Smallwood, Wong, Snelling, Smith, Deschamps and Sautet2000; Chatakonda et al. Reference Chatakonda, Hawkes, Aspden, Kerstein, Kolla and Chen2013; Thiesset et al. Reference Thiesset, Maurice, Halter, Mazellier, Chauveau and Gökalp2016). In between lies an apparently self-similar range wherein the flame fluctuations have a Fourier spectrum that varies as a power law, which in turn follows from the inertial-range scaling of the underlying turbulent flow (Peters Reference Peters1992; Peters, Wenzel & Williams Reference Peters, Wenzel and Williams2000; Chaudhuri, Akkerman & Law Reference Chaudhuri, Akkerman and Law2011; Chaudhuri et al. Reference Chaudhuri, Wu, Zhu and Law2012). The statistical properties of the flame surface are widely recognized to determine crucial quantities such as the turbulent flame speed, as well as the rates of reaction and volumetric heat generation (Kerstein, Ashurst & Williams Reference Kerstein, Ashurst and Williams1988; Lipatnikov & Chomiak Reference Lipatnikov and Chomiak2002; Chaudhuri et al. Reference Chaudhuri, Wu, Zhu and Law2012). Despite this, previous studies have almost entirely overlooked an essential property of the power-law subrange of fluctuations, namely its intermittency.
This small-scale, inner intermittency is fundamentally different from the well-studied outer intermittency of the large-scale flame motion, which is characterized by on–off flapping (Bray, Libby & Moss Reference Bray, Libby and Moss1985; Cheng & Shepherd Reference Cheng and Shepherd1987; Poinsot & Veynante Reference Poinsot and Veynante2005; Robin, Mura & Champion Reference Robin, Mura and Champion2011). Although the need to recognize and study inner intermittency was emphasized by Sreenivasan (Reference Sreenivasan2004), the literature remains sparse (Kerstein Reference Kerstein1991; Gülder Reference Gülder2007; Roy & Sujith Reference Roy and Sujith2021) with no experimental work, leaving a fundamental gap in our understanding of turbulent flame dynamics.
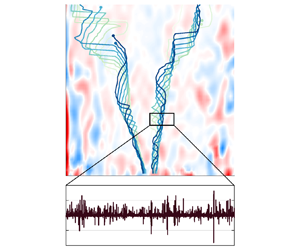
In this paper, we experimentally uncover the inner intermittency of a turbulent,  $\text {CH}_4$-air V-flame, using high-frequency temporal measurements of the flame surface. We first clearly distinguish outer intermittency, which is apparent from the probability distribution function (p.d.f.) of flame fluctuations
 $\xi ^\prime$, from inner intermittency, which is only revealed after a scale-by-scale analysis using temporal increments of the flame position
 $\delta \xi ^\prime (\tau )$. As the time interval
 $\tau$ decreases, the p.d.f.s of
 $\delta \xi ^\prime$ exhibit increasingly non-Gaussian, flared tails indicative of abrupt spatio-temporal variations of the flame edge.
Next, we show how the apparently self-similar range, hitherto studied primarily in spatial wavenumber space, manifests in the temporal frequency domain: the spectrum of ( $\xi ^\prime$) has a power-law subrange, with an exponent that is shown to agree with Kolmogorov phenomenology. However, when we analyse the structure functions (moments of
 $\delta \xi ^\prime$) we find that they scale anomalously, with exponents that saturate at high orders. Thus, we show that the small-scale flame fluctuations violate perfect self-similarity and are, in fact, strongly intermittent. Moreover, the extreme values of
 $\delta \xi ^\prime$ are found to originate from the advection of high-curvature, cusp-like structures along the flame surface. These findings have important implications for the modelling of premixed turbulent flames and suggest new directions for future work, as discussed in the concluding section of this paper.
Intermittency in non-reacting turbulent flows has been well studied, with comparable attention paid to both varieties. Outer intermittency is encountered in the large scales of non-homogeneous or transitional flows (Kovasznay, Kibens & Blackwelder Reference Kovasznay, Kibens and Blackwelder1970; Avila et al. Reference Avila, Moxey, de Lozar, Avila, Barkley and Hof2011; Barkley et al. Reference Barkley, Song, Mukund, Lemoult, Avila and Hof2015), while inner intermittency is a characteristic feature of the inertial range of fully developed, homogeneous, isotropic turbulence (Frisch Reference Frisch1995; Sreenivasan & Antonia Reference Sreenivasan and Antonia1997; Arnéodo et al. Reference Arnéodo2008). The intermittency of a passive and conserved scalar field, stirred by a turbulent flow, has also been studied in detail (Holzer & Siggia Reference Holzer and Siggia1994; Tong & Warhaft Reference Tong and Warhaft1994; Warhaft Reference Warhaft2000), in part as a first step towards understanding the intermittency of turbulence (Shraiman & Siggia Reference Shraiman and Siggia2000; Falkovich, Gawȩdzki & Vergassola Reference Falkovich, Gawȩdzki and Vergassola2001; Falkovich & Sreenivasan Reference Falkovich and Sreenivasan2006): the concentration fluctuations remain intermittent even when the turbulent flow is replaced by a simpler, non-intermittent, Gaussian flow (Shraiman & Siggia Reference Shraiman and Siggia2000; Tsinober Reference Tsinober2009). Intermittent scalar fields are characterized by sharp internal fronts or ramp-cliff structures, across which the scalar experiences the largest possible fluctuation over the smallest (diffusive) spatial scale (Celani et al. Reference Celani, Lanotte, Mazzino and Vergassola2000; Watanabe & Gotoh Reference Watanabe and Gotoh2006).
In contrast, in the combustion literature, inner intermittency of scalar fields – which are neither passive nor conserved – has remained largely neglected, save for a few studies. Importantly, ramp-cliff structures have been experimentally observed in the scalar fields underlying partially premixed turbulent flames (Wang et al. Reference Wang, Tong, Barlow and Karpetis2007; Cai et al. Reference Cai, Wang, Tong, Barlow and Karpetis2009). Also, the extreme-value statistics of the dissipation range have been characterized, for example, through log-normal distributions of scalar dissipation, in reacting flow experiments (Karpetis & Barlow Reference Karpetis and Barlow2002; Saha, Chaudhuri & Law Reference Saha, Chaudhuri and Law2014) and simulations (Hamlington, Poludnenko & Oran Reference Hamlington, Poludnenko and Oran2012; Chaudhuri et al. Reference Chaudhuri, Kolla, Dave, Hawkes, Chen and Law2017). However, a clear characterization of inertial-range inner intermittency in the dynamics of the flame surface is missing, and this is the focus of our work.
2. Experimental set-up
2.1. Facility
Our experimental facility (figure 1a) consists of a premixed  $\text {CH}_4-$air V-flame stabilized on an oscillating flame holder, a typical configuration for the study of premixed flames (Petersen & Emmons Reference Petersen and Emmons1961). The flame holder, which is an electrically heated nichrome wire, is vibrated at a frequency of
 $f_f=1250$ Hz. The flow of
 $\text {CH}_4$ and air ensues out of a circular nozzle 10 mm below the flame holder, and turbulence is generated using a series of stator-rotor plates. The three-dimensional (3-D) flame surface, thus obtained, is shaped like a wedge (figure 1b). We measure the fluctuations of the flame edge and the underlying velocity field within a 2-D plane located at the mid-section of the wedge-shaped flame surface, using
 $\textrm {TiO}_2$ Mie scattering and high-speed particle image velocimetry (PIV). This experimental set-up has been employed previously for studying the effects of harmonic forcing and turbulence on premixed flames (Humphrey, Emerson & Lieuwen Reference Humphrey, Emerson and Lieuwen2018; Roy & Sujith Reference Roy and Sujith2019).
Turbulent V-flame facility. (a) Schematic of the combustor set-up. (b) Illustrative photograph of the V-flame. (c) Representative cropped and processed Mie-scattering snapshot depicting the flame surface. (d) Examples of the extracted instantaneous leading flame edge  $\xi (y,t)$, along with the coordinate system. The dashed line represents the mean flame edge
 $\langle \xi (y)\rangle$ with respect to which the fluctuations
 $\xi ^\prime (y,t)$ are defined. The region highlighted by the box is used for determining the flow properties. Panels (a–c) adapted from Humphrey et al. (Reference Humphrey, Emerson and Lieuwen2018) with permission from Cambridge University Press.

2.2. Flame and flow characteristics
We consider two experimental flame configurations, F1 and F2, whose properties are listed in table 1. For both flames, the turbulence intensity is  $u^\prime /\bar {u}_y \approx 0.1$, where
 $u^\prime$ is the root-mean-square (r.m.s.) of the velocity fluctuations and
 $\bar {u}_y$ is the mean longitudinal velocity. The Reynolds number
 $Re_\ell =\ell u^\prime /\nu$ of F1 is approximately 700 while that of F2 is nearly four times larger; the dissipative Kolmogorov length (
 $\eta$) and time (
 $\tau _\eta )$ scales are similar though for both flames (cf. table 1). Here,
 $\nu$ indicates the kinematic viscosity of the binary fuel-air mixture.
Relevant physical properties of the two turbulent premixed flame configurations considered in this study. The laminar flame speed  $s_L$ for the two cases was obtained using Chemkin Premix calculations (Humphrey Reference Humphrey2017), while the value of
 $Sc$ for methane–air premixed flames was obtained from Tamadonfar & Gülder (Reference Tamadonfar and Gülder2014). See the supplementary material for further details.

The flame speed  $s_L$ is calculated using Chemkin Premix (Kee et al. Reference Kee2011) with detailed chemistry simulated through the GRIMech 3.0 mechanism (Smith et al. Reference Smith1999) at 300 K and 1 bar. The associated Karlovitz number
 $Ka =(\nu /Sc\, s_L)^2 \eta ^{-2} \sim 0.1$, for both configurations, which implies that the flames lie within the corrugated flamelet regime, close to the boundary with the thin reaction zone regime (Peters Reference Peters2000). Here, Sc indicates the Schmidt number. Thus, the flame front is continuous, enabling a well-defined description of the flame edge.
Turbulent eddies can distort the flame edge and produce wrinkles or corrugations, but on scales of the order of the Gibson scale  $\ell _g = (s_L/u^\prime )^3\ell \approx 0.3$ mm or greater. This is because smaller eddies have velocities less than the laminar flame speed
 $s_L$ and so cannot distort the flame edge (Peters Reference Peters2000). Further information on the properties of the flame and the flow, as well as on how these are calculated, is provided in the supplementary material available at https://doi.org/10.1017/jfm.2023.63.
2.3. Window of interrogation
Our analysis of small-scale flame dynamics is based on measurements in a 2-D plane, within a sub-region of the entire domain (outlined by the grey rectangle in figure 1d). The extent of the sub-region in the longitudinal  $y$-direction is chosen such that the flame fluctuations are not dominated by effects of flame anchoring and the oscillation of the flame holder, which is ensured for
 $y>\lambda _c$, where
 $\lambda _c=\bar {u}_y/f_f$ (notice the disappearance of the narrow-band peak from the power spectra in figure 3). Further, we disregard fluctuations at large downstream distances (
 $y>4\lambda _c$) where effects of large-scale flapping become significant (discussed further below in connection with figure 2a,b). The width of the sub-region in the transverse
 $x$-direction is restricted by the requirement that the measured velocity fluctuations exhibit nearly isotropic statistics. This is verified by ensuring that the cross-correlation
 $\langle u_x^\prime u_y^\prime \rangle$ remains small (see § 3 in the supplementary material).
Distinction between outer and inner intermittency. (a) Time series of the flame fluctuations  $\xi ^\prime$ normalized by the standard deviation measured at
 $y=5\lambda _c$ (top panels) and
 $y=2\lambda _c$ (bottom panels). (b) The p.d.f.s of
 $\xi ^\prime$ at various longitudinal locations. (c) Time series of increments
 $\delta \xi ^\prime$, normalized by the standard deviation, for
 $\tau =0.03 \tau _\ell$ (top panels) and
 $\tau =6.67\tau _\ell$ (bottom panels), measured at
 $y=2\lambda _c$. (d) The p.d.f.s of the increment
 $\delta \xi ^\prime$ measured at
 $y=2\lambda _c$ for various values of the time lag. The data set in all panels corresponds to flame F1. As explained in the text, comparing panels (b,d) helps to clearly distinguish large-scale outer intermittency from small-scale inner intermittency. Here, the p.d.f.s have been shifted for clarity and the dashed lines represent
 $\mathcal {N}(0,1)$ Gaussian fits.

Our measurements in the  $x$–
 $y$ plane give us access to the fluctuations of the flame edge in the direction normal to the mean flame edge (dashed line in figure 1d), as well as in the flow-aligned tangential direction. However, we do not have access to the fluctuations in the out-of-plane tangential direction (
 $z$-direction). We do not expect this omission to affect out key results, however, because within the sub-region of interest where the flow is approximately isotropic the only difference between these two tangential directions is the advection by the mean flow in the flow-aligned direction. We can account for this advection using Taylor's hypothesis (
 $u^\prime /\bar {u}_y \sim 0.1$) and thereby approximate the
 $z$-direction fluctuation statistics from data of the flow-aligned tangential fluctuations (Shin & Lieuwen Reference Shin and Lieuwen2013). This procedure is facilitated by the local homogeneity in the
 $z$-direction near the mid-section of the wedge-shaped flame surface where the measurement plane is located. In fact, many studies have carried out similar 2-D measurements for estimating important flame properties such as the fractal dimension of the flame surface (North & Santavicca Reference North and Santavicca1990; Smallwood et al. Reference Smallwood, Gülder, Snelling, Deschamps and Gökalp1995; Gülder et al. Reference Gülder, Smallwood, Wong, Snelling, Smith, Deschamps and Sautet2000).
2.4. Spatial and temporal resolution
A laser sheet of thickness  $1$ mm is used for Mie scattering and PIV. The resulting images capture a region spanning
 $50\times 60\ {\rm mm}^2$, and the size of a pixel is
 $\Delta x=0.078$ mm. At this resolution the flame edge appears as a distinct boundary in the processed Mie-scattering images (figure 1c). The temporal frequency at which the images are obtained is
 $f_s=1.25{\times} 10^4$ Hz, which based on the Nyquist theorem allows us to capture fluctuations of the interface with a maximum frequency of
 $f_{{max}}=f_s/2 = 6.25\times 10^3$ Hz, corresponding to a time interval of
 $1/f_{{max}}=1.6\times 10^{-4}$ s.
This spatio-temporal resolution is just sufficient to resolve the fluctuations of the flame edge. The thickness of the laser sheet is of the same order as the Gibson scale  $\ell _g$ (§ 2.2), which is an estimate of the scale of the smallest turbulence-induced wrinkles on the flame edge (Peters Reference Peters2000). The pixel width
 $\Delta x$ is an order smaller than
 $\ell _g$, and so we are able to capture the spatial undulations of the flame edge. At the Gibson scale, the inertial-range turbulent eddies have a time scale of
 $\ell _g/(u^\prime (\ell _g/\ell )^{1/3})\approx 10^{-3}$ s (following Kolmogorov phenomenology). An even smaller convective time scale is obtained by considering the advection of small spatial undulations along the flame surface past a fixed measurement location; using the mean longitudinal velocity as an upper estimate for the speed of convection, we obtain a time scale of
 $\ell _g/\bar {u}_y \approx 10^{-4} \mathrm {s}$, which is approximately the same as the smallest resolved time scale
 $1/f_{{max}}$. The ability of our measurements to capture such events will turn out to be especially important for detecting the inner intermittency of the flame dynamics (cf. § 6).
While we can analyse the flame fluctuations in detail, our resolution is insufficient to capture the dynamics of the underlying turbulent flow field. Indeed, while the pixel dimension is of the order of the Kolmogorov length ( $\Delta x \approx 4 \eta$), the thickness of the laser sheet is an order of magnitude larger (
 ${\approx }50 \eta$). Thus, the velocity field data obtained from our PIV images are rather coarse, and are only used to determine the r.m.s. velocity fluctuation
 $u^\prime$ and the window of interrogation (cf. § 2.3) wherein the turbulence is approximately homogeneous and isotropic.
2.5. Measurement of the flame edge and its fluctuations
The instantaneous flame edge determined from  $\text {TiO}_2$ Mie scattering (cf. figure 1c), is described by a curve in parametric form,
 $(x(s,t),y(s,t))$ where
 $s$ is the arc length. (Distinct curves are obtained for the left and right flame edges.) An approximate representation that is more convenient for analysis is given by the explicit curve
 $x=\xi (y,t)$. These two representations are equivalent except for points where wrinkling causes the flame edge to become a locally multi-valued function of
 $y$. At such instances, we obtain a single-valued function
 $\xi$ by considering the leading points of the flame edge, i.e. choosing the point with the smallest value of
 $x$ for every
 $y$. This treatment is akin to viewing the flame from the side of the burnt products and making single-point measurements of its surface as it advects past various downstream stations. The curve
 $x=\xi (y,t)$ thus obtained is termed the leading flame edge (figure 1d). Such an approach is routinely used in studies of wrinkled flame surfaces (Zeldovich et al. Reference Zeldovich, Barenblatt, Librovich and Makhviladze1985; Karpov, Lipatnikov & Zimont Reference Karpov, Lipatnikov and Zimont1996; Chterev, Emerson & Lieuwen Reference Chterev, Emerson and Lieuwen2018) and simplifies subsequent analysis without altering our key conclusions, as discussed further in § 6 and the Appendix.
To analyse the fluctuation of the flame, which is the primary focus of this work, we first time average to obtain the V-shaped mean flame edge  $\langle \xi (y)\rangle$ (dashed line in figure 1d). The fluctuations are then defined as
 $\xi ^\prime (y,t) = \xi - \langle \xi \rangle$. Harnessing the transverse (
 $x$-direction) symmetry of the experimental set-up, we combine the measurements of fluctuations obtained from the left and right flame edges to obtain better statistics.
Detailed information on the experimental facility, measurements and flame edge detection is provided in the supplementary material.
3. Outer and inner intermittency: two distinct forms of extreme fluctuations
Let us begin by considering the fluctuations of the flame at various distances from the flame holder. At relatively large distances,  $y/\lambda _c=5$ (where
 $\lambda _c=\bar {u}_y/f_f$), the flame propagation is erratic and the time series of
 $\xi ^\prime$ (top panel, figure 2a) exhibits an intermittent behaviour. Due to large-scale flapping, the flame undergoes abrupt excursions from the mean (bursts) at some time instances, while failing to propagate to the measurement location at other time instances (off events). The off events are marked by setting
 $\xi ^\prime = 0$, and so the corresponding normalized p.d.f. of
 $\xi ^\prime$ has a sharp peak at
 $\xi ^\prime = 0$ (figure 2b). Such a p.d.f. has a high kurtosis or flatness factor,
 $K= \langle {\xi ^\prime }^4 \rangle /\langle {\xi ^\prime }^2 \rangle ^2 =13.51$, and is typical of large-scale outer intermittency. Now, as we move closer to the flame holder, the flame becomes well maintained and outer intermittency is lost. Indeed, the p.d.f. of
 $\xi ^\prime$ for
 $y/\lambda _c=2$ (figure 2b, see also the bottom panel of figure 2a) has a kurtosis (
 $K = 3.47$) that is close to the Gaussian value of 3.
This near-Gaussian p.d.f. of  $\xi ^\prime$, however, veils an intermittency of a different nature, which is revealed by examining the temporal increments of the flame position
 $\delta \xi ^\prime (\tau )=\xi ^\prime (t+\tau )-\xi ^\prime (t)$. The normalized p.d.f.s of this temporal structure factor, measured at
 $y/\lambda _c=2$, are presented in figure 2(d) for various values of
 $\tau /\tau _\ell$ (
 $\tau _\ell = \ell /u^\prime$ is the integral time scale). While the p.d.f. is near Gaussian for large
 $\tau$, it develops strongly flared tails for small
 $\tau$. The kurtosis for
 $\tau /\tau _\ell = 0.03$ is
 $K=55.13$, while for
 $\tau /\tau _\ell = 6.67$, it is
 $K=3.23$. Comparing the corresponding time series, shown in the bottom and top panels of figure 2(c) respectively, we see that
 $\delta \xi ^\prime (0.03\tau _\ell )$ intermittently undergoes large excursions – tens of times larger than the standard deviation – which are absent in the case of
 $\delta \xi ^\prime (6.67\tau _\ell )$. So, while the large-scale fluctuations at
 $y/\lambda _c=2$ are non-intermittent, the small-scale fluctuations exhibit extreme-value increments – a clear sign of inner intermittency.
4. Power-law scaling of the frequency spectrum
Before characterizing this intermittency further, it is instructive to examine the power spectrum of  $\xi ^\prime$ in frequency space, which is closely related to the variation of the second moment of
 $\delta \xi ^\prime$ with
 $\tau$. The frequency spectrum is presented in figure 3 for three longitudinal locations. At
 $y/\lambda _c=1$, we see a minor imprint of the external vibration of the flame holder, in the form of a small peak at the forcing frequency
 $\omega _f/\omega _{\ell } = 5.79$, where
 $\omega _{\ell }=2 {\rm \pi}/\tau _{\ell }$. For
 $y/\lambda _c=1.5$ and 2, there is no trace of the external forcing, and the flame's fluctuations are dominated by its response to the turbulent flow. Interestingly, for frequencies beyond
 $\omega _{\ell }$, a self-similar power law is seen to emerge.
Temporal power spectral density  $E(\tilde {\omega })$ measured at various longitudinal locations
 $y/\lambda _c$, for flame F1. The power spectrum varies as
 $E(\tilde {\omega })\sim \tilde {\omega }^{-\alpha }$ over an intermediate range of frequencies. The estimated values of the exponent
 $-\alpha$ at various
 $y/\lambda _c$ are shown in the inset for both flames F1 and F2. In both cases, the exponent is close to
 $-2$; the corresponding scaling behaviour is depicted by the solid line in the main panel. Estimates of the frequency corresponding to Gibson (
 $\tilde {\omega }_g$), Corrsin (
 $\tilde {\omega }_c$) and Kolmogorov (
 $\tilde {\omega }_\eta$) scales have been indicated by dashed lines.

To understand the origin of this power law, let us begin with the flame fluctuation spectrum in spatial wavenumber ( $k$) space, which has been well studied. For a flame of finite thickness susceptible to diffusive effects (
 $Ka \sim {O}(1)$), in an isotropic and homogeneous turbulent flow, Kolmogorov's phenomenology (Peters Reference Peters1992; Chaudhuri et al. Reference Chaudhuri, Akkerman and Law2011) leads to a spectrum with a power-law behaviour,
 \begin{equation} \varGamma(k) \sim k^{{-}5/3}, \end{equation}
in the subrange  $k_{\ell }< k< k_{c}$. Here
 $k_{\ell } = 2 {\rm \pi}/\ell$ corresponds to the large integral scale while
 $k_{c}=2 {\rm \pi}/\eta _c$ is the wavenumber of the Corrsin length scale
 $\eta _c=Sc^{-3/4}\eta$ (
 $Sc=\nu /\mathcal {D}_M$, where
 $\mathcal {D}_M$ is the Markstein diffusivity) after which diffusive effects within the flame become dominant. (The role of kinematic restoration is discussed below.) This subrange lies within the inertial range of the turbulent flow,
 $k_{\ell }< k< k_{\eta }$, where
 $k_{\eta }=2 {\rm \pi}/\eta$ corresponds to the viscous Kolmogorov length
 $\eta$ (
 $k_{\eta } > k_c$ as
 $Sc < 1$ for our flame). Notably, the scaling in (4.1) is the same as that for a passive scalar in the inertial–convective range (Oboukhov Reference Oboukhov1949; Corrsin Reference Corrsin1951; Davidson Reference Davidson2015), which is consistent with the fact that effects due to the flame's propagation do not play a role over this range of scales. In summary, the inertial-range velocity fluctuations educe an apparently self-similar response from the flame surface, which, however, is cut off by large-scale effects for
 $k < k_{\ell }$ and by diffusion within the flame for
 $k > k_c$.
Now, in order to translate this picture to the frequency domain, we assume that flame fluctuations with wavenumber  $k$ are most strongly influenced by a turbulent eddy of size
 $2 {\rm \pi}/k$, whose typical velocity according to inertial-range scaling is
 $u^\prime \sim k^{-1/3}$. We can then relate the wavenumber of flame fluctuations to the frequency as
 $\omega \sim ku^\prime \sim k^{2/3}$. Then, using (4.1) and the fact that the frequency spectrum
 $E(\omega )$ must satisfy
 $\int E({\omega })\,{\rm d}{\omega }=\int \varGamma ({k})\,{\rm d}{k}$, we obtain
 \begin{equation} E(\omega) \sim {\omega}^{{-}2}. \end{equation}
The exponent of the power-law subrange of the frequency spectrum is presented in the inset of figure 3, and is seen to be close to this prediction of  $-2$ for a range of longitudinal locations,
 $\lambda _c< y<3\lambda _c$. This figure also shows the frequencies
 $\omega _{\ell }$,
 $\omega _{c}$ and
 $\omega _{\eta }$ corresponding to the length scales
 $\ell$,
 ${\eta }_c$ and
 $\eta$, respectively. The power law is seen to commence after
 $\omega _{\ell }$, as expected, and then carry on for approximately a decade. However, near
 $\omega _c$, the spectrum displays a spurious flattening due to the limited temporal resolution of our measurements, which is insufficient to resolve the diffusive cutoff and subsequent stretched–exponential decay of the spectrum beyond
 $\omega _c$ (Peters Reference Peters1992; Chaudhuri et al. Reference Chaudhuri, Akkerman and Law2011).
Figure 3 also shows the frequency  $\omega _g$, which corresponds to the Gibson length
 $\ell _g=(s_L/u^\prime )^3\ell$, at which the flame propagation speed becomes comparable to the turbulent velocity fluctuations. This scale could potentially cut off the power-law scaling due to kinematic restoration effects that act to smooth out turbulence-induced flame fluctuations (Lieuwen Reference Lieuwen2021). However, previous work indicates that, for flames of finite thickness, the effect of kinematic restoration on the spectra can be counter-acted by thermal expansion effects, so that the power-law behaviour persists until the Corrsin scale (
 $\omega _c$), after which it is terminated by diffusive effects within the flame (Gülder et al. Reference Gülder, Smallwood, Wong, Snelling, Smith, Deschamps and Sautet2000; Peters et al. Reference Peters, Wenzel and Williams2000; Shim et al. Reference Shim, Tanaka, Tanahashi and Miyauchi2011; Chatakonda et al. Reference Chatakonda, Hawkes, Aspden, Kerstein, Kolla and Chen2013).
5. Anomalous scaling of temporal increments
Let us now return to the issue of inner intermittency and its characterization. This is best done by examining the scaling of the structure functions  $S_p(\tau )$, defined as the
 $p{\rm th}$ moment of the increment
 $\delta \xi ^\prime (\tau )$ (Frisch Reference Frisch1995; Falcon, Fauve & Laroche Reference Falcon, Fauve and Laroche2007)
 \begin{equation} S_p(\tau;y) \equiv \langle[\delta\xi^\prime(\tau;y)]^p\rangle=\langle[\xi^\prime(t+\tau;y)-\xi^\prime(t;y)]^p\rangle. \end{equation}
For the second-order structure function, which can be determined entirely from the power spectrum (Davidson Reference Davidson2015), we have  $S_2 \sim (2{\rm \pi} /\tau ) E(2{\rm \pi} /\tau ) \sim \tau$. For the
 $p{\rm th}$ moment then, a naive expectation would be
 $S_p = \langle {[\delta \xi ^\prime ]}^p\rangle \sim \tau ^{p/2}$; this would be true if the flame fluctuations were non-intermittent and perfectly self-similar. However, the presence of extreme-value increments, evident in the flared-tail p.d.f.s of figure 2(d), causes the higher-order moments to have increasingly large values as
 $\tau$ decreases. So, for intermittent fluctuations, we expect
 $S_p \sim \tau ^{\zeta _p}$ with
 $\zeta _p$ becoming increasingly smaller than
 $p/2$ as
 $p$ increases.
This is exactly what we observe in figure 4(a), which presents the values of  $\zeta _p$ as a function of
 $p$, up to the sixth order, for both flame configurations, at
 $y = 2\lambda _c$. Figure 4(b) illustrates the corresponding power-law scaling of
 $S_p$ for
 $\tau < \tau _{\ell }$. Equivalent results are obtained at other longitudinal locations in the interval
 $\lambda _c< y<3\lambda _c$, wherein the spectrum exhibited a power-law exponent close to
 $-2$ (figure 3). We also estimated
 $\zeta _p$ using the procedure of extended self-similarity (Benzi et al. Reference Benzi, Ciliberto, Tripiccione, Baudet, Massaioli and Succi1993), which takes advantage of the fact that
 $S_p/S_2$ scales as
 $\tau ^{\zeta _p/1}$ over an extended range of
 $\tau$, and obtained values nearly identical to those shown in figure 4(a). The dramatic departure of
 $\zeta _p$ from
 $p/2$, for
 $p$ beyond second order, makes evident the intensely intermittent nature of the small-scale fluctuations of the flame.
(a) The variation of the scaling exponents  $\zeta _p$ with the order
 $p$ of the structure function, for both flames at
 $y/\lambda _c=2$. The dashed line indicates the non-intermittent limit of
 $\zeta _p=p/2$. The strong deviation of
 $\zeta _p$ from this limit for
 $p>2$, implies that the exponents scale anomalously and that the flame fluctuations are strongly intermittent. The error bars represent the standard deviation of the measured values obtained from different time series (see § S6 in the supplementary material). (b) Plots of the structure functions up to order
 $p=6$, compensated by the estimated scaling
 $\tau ^{-\zeta _p}$, which illustrates their scaling behaviour (for flame F1 measured at
 $y=2\lambda _c$). (c) The p.d.f.s of
 $\delta {\xi ^\prime }(\tau )$, for various values of
 $\tau$, multiplied with
 $\xi ^\prime _{rms}(\tau /\tau _{\ell })^{-\zeta _{\infty }}$, where
 $\zeta _{\infty }$ is the saturated value of
 $\zeta _{p}$ estimated from panel (a). The dashed lines are Gaussian fits for
 $\tau /\tau _\ell =0.03$ and
 $2.60$. The collapse of the tails of the p.d.f.s is striking, especially when compared with the behaviour of the Gaussian fits.

The saturation of the  $\zeta _p$ exponents with increasing
 $p$, seen in figure 4(a), is reminiscent of the anomalous scaling behaviour of passive scalar turbulence (Celani et al. Reference Celani, Lanotte, Mazzino and Vergassola2000, Reference Celani, Lanotte, Mazzino and Vergassola2001; Watanabe & Gotoh Reference Watanabe and Gotoh2006), wherein the saturation arises due to steep ramp-cliff structures in the concentration field. The width of these structures decreases as the diffusivity is reduced, yet the amplitude of the concentration jump remains near the r.m.s. value of concentration fluctuations (Celani et al. Reference Celani, Lanotte, Mazzino and Vergassola2001).
In our case, figure 4(a) implies that, as the diffusive Corrsin scale is reduced (keeping  $Ka$ and
 $Sc$ constant), the extreme-valued flame fluctuations, measured at a fixed
 $y$ position, would undergo a displacement of the order of the r.m.s. value,
 $\xi ^\prime _{rms}=\langle {\xi ^\prime }^2\rangle ^{1/2}$, in an ever-shortening time. To see this, note that, in the limit of large
 $p$,
 $S_p^{1/p} \sim \langle \delta {\xi ^\prime (\tau _{\ell })}^p\rangle ^{1/p} (\tau /\tau _{\ell })^{(\zeta _p/p)}$ is an estimate of the magnitude of extreme increments. So, given that
 $\zeta _p$ saturates as
 $p$ increases, we see that the magnitude of extreme increments does not decrease with
 $\tau$, but rather remains comparable to
 $\langle \delta {\xi ^\prime (\tau _{\ell })}^p\rangle ^{1/p} \sim \langle {\xi ^\prime }^p\rangle ^{1/p} \sim \xi ^\prime _{rms}$ (
 $\xi ^\prime$ has an approximately Gaussian distribution as seen in figure 2b). This behaviour is illustrated in figure 4(c), wherein the tails of the p.d.f.s of
 $\delta {\xi ^\prime }$, for various values of
 $\tau$, are seen to have the same width, and in fact collapse when the p.d.f.s are multiplied with
 $\xi ^\prime _{rms}(\tau /\tau _{\ell })^{-\zeta _{\infty }}$ (
 $\zeta _{\infty }$ is the saturated value estimated from figure 4a).
6. Origin of extreme-valued temporal increments
The extreme temporal increments implied by the saturating exponents in figure 4(a) have two possible causes: (i) rapid fluctuation events in which the flame advances and retreats very quickly, or (ii) advection of coherent spatial structures on the flame surface, such as cusps, past a fixed measurement location. The second scenario has been proposed as the cause of intermittency in temporal fluctuations of a free surface exhibiting gravity–capillary wave turbulence (Falcon et al. Reference Falcon, Fauve and Laroche2007). For flames, and propagating surfaces in general, cusp-like features are typical (Law & Sung Reference Law and Sung2000; Zheng, You & Yang Reference Zheng, You and Yang2017) and indeed appear quite frequently on the flame edge in our study (see figure 1c). Near such points, the flame edge typically traces out a large excursion in the transverse  $x$ direction over a short distance in the longitudinal
 $y$ direction. So, when such a cusp-like structure is advected past the measurement location (
 $y=2\lambda _c$ in figure 4) by the mean flow, it will register as an extreme-valued increment of the flame position. The time scale of such events is estimated in § 2.4 to be approximately
 $10^{-4}$ s, which is strikingly similar to the time scale of the interval
 $\tau$ at which the p.d.f. of
 $\delta \xi ^\prime (\tau )$ begins to develop strongly flared tails (see figure 2(d) wherein
 $\tau = 0.03 \,\tau _\ell \approx 10^{-4}$ s). Indeed, an examination of the temporal evolution of the flame surface in tandem with the time trace of the temporal increment (presented in supplementary movie 1) strongly suggests that this scenario predominates and that the anomalous scaling of figure 4(a) is due to the advection of cusp-like structures along the flame edge.
As a quantitative check, we now calculate the curvature of the flame edge and examine whether extreme values of the temporal increment  $\delta {\xi ^\prime }$ occur simultaneously with extreme values of curvature, which would correspond to cusps. Using the parametric representation of the flame edge
 $(x(s,t),y(s,t))$, where
 $s$ is the arc length, the curvature
 $\kappa$ is calculated as follows (Aris Reference Aris1990):
 \begin{equation} {\kappa}(s,t) = ({(\partial_{ss}x)^2+(\partial_{ss}y)^2})^{1/2}. \end{equation}
We construct the curve  $(x(s,t),y(s,t))$ using fourth-order spline interpolation based on points spaced equally along the flame edge, such that the inter-point distance (
 ${\rm d}s=\sqrt {{{\rm d} x}^2+{{\rm d} y}^2}=0.1$ mm) is greater than the pixel size
 $\Delta x$. This allows us to evaluate the derivatives in (6.1) and obtain the curvature as a function of the arc length
 $s$ (see Bentkamp et al. (Reference Bentkamp, Drivas, Lalescu and Wilczek2022), for a similar calculation for material loops in turbulence). Figure 5(a) illustrates the typical variation of the curvature along the flame edge when it has a cusp-like feature: we see that the cusp corresponds to a spike in the curvature profile. Figure 5(b) presents the stationary p.d.f. of curvature values sampled by the flame edge, within the interrogation window (box in figure 1d) and over time. The heavy tail of the distribution is a consequence of the extreme curvature values associated with cusp-like features of the flame surface.
(a) Illustration of the variation of the curvature  $\kappa$ along the flame surface in the presence of a cusp-like structure. The curvature attains a large value at the cusp (right panel) and thus appears as a prominent spike in the plot of
 $\kappa$ as a function of the arc length
 $s$ (left panel). Note that the curvature has been non-dimensionalized using the flame thickness
 $\delta _F$. (b) Stationary p.d.f. of the curvature
 $\kappa$, shown for flames F1 and F2, exhibiting a flared tail which reflects the presence of cusp-like structures on the flame surface. The p.d.f.s are constructed by calculating the curvature along the flame edge contained within the window of interrogation (§ 2.3) and over time.

Having calculated the flame curvature, we next examine its correlation with the temporal increment of the flame fluctuations. Each measurement of the increment  $\delta \xi ^\prime (\tau ;y^*)$ is associated with curvature values at two time instances,
 $\kappa (t;s_1)$ and
 $\kappa (t+\tau ;s_2)$, where the values of
 $s_1$ and
 $s_2$ are such that
 $y(s_1)=y(s_2)=y^*$ corresponds to the measurement location. Note that there will be more than one value of
 $s_1$, or
 $s_2$, when the flame edge becomes locally multi-valued. We consider the maximum of these curvature values
 $\max \{{\kappa }(t),{\kappa }(t+\tau )\}$ and depict its joint p.d.f. with the magnitude of the associated increment of the flame position
 $|\delta \xi ^\prime (\tau )|$ in figure 6, for various time intervals
 $\tau$. Clearly, the extreme values of the temporal increment which arise as
 $\tau$ decreases are strongly correlated with extreme values of the flame curvature. This is entirely consistent with our observation that large and rapid temporal fluctuations of the flame position are registered when cusp-like structures are advected past the measurement location.
Pseudo-colour plot of the joint p.d.f. of the increment  $\delta \xi ^\prime (\tau ;y)$ and the maximum of the flame curvature values at times instances
 $t$ and
 $t+\tau$, as measured at
 $y = 2 \lambda _c$. The three panels correspond to different values of the time increment
 $\tau /\tau _\ell$: (a) 2.67, (b) 0.10 and (c) 0.03. The extreme-valued increments which appear as
 $\tau$ decreases show a clear correlation with extreme values of the curvature. These results correspond to flame F1 and are measured at
 $y=2\lambda _c$; similar results are obtained for flame F2 and for other measurement locations within
 $1< y/\lambda _c<3$. The coloured contours correspond to the logarithm of the joint p.d.f.

Cusp-like features and wrinkling in general can cause the flame edge to become a locally multi-valued function of  $y$. This fact is accounted for in the calculation of curvature
 $\kappa (s,t)$ which is based on the arc-length parameterization, but not in the measurement of increments
 $\delta \xi ^\prime$ which is based on the single-valued leading edge
 $\xi (y,t)$. This raises the concern that multi-valued regions of the flame edge may appear as artificially abrupt variations in
 $\xi (y,t)$ which would in turn produce spurious large values of the increment. In the Appendix, we carry out two checks which show that our detection of inner intermittency is not an artefact of the treatment of the flame edge. First, we modify how we obtain the single-valued function
 $\xi (y,t)$: instead of taking the points closest to the
 $y$ axis, we now locally average the flame edge in regions where it is multi-valued. This procedure would smooth out artificially abrupt variations in
 $\xi (y,t)$. Second, we retain the leading edge profile, but eliminate all data points where the flame edge is multi-valued, i.e. we only calculate increments when
 $\xi (y)$ is single valued at both times,
 $t$ and
 $t+\tau$. For both cases, we find that anomalous scaling persists, which shows that the inner intermittency detected in this study is a genuine feature of the flame dynamics.
7. Concluding remarks
To summarize, we have seen that a well-maintained flame surface, devoid of large-scale bursts associated with outer intermittency, contains a subrange of scales wherein the flame surface merely responds to the fluctuations of the incident turbulent flow and exhibits power-law scaling that is entirely determined by the inertial-range scaling of the flow. However, this apparent simplicity comes with a caveat, which is the key result of our work: the flame fluctuations are intensely intermittent with structure functions that exhibit strongly anomalous scaling. The associated extreme events, which originate from cusp-like structures that are advected along the flame edge, have important implications for the modelling of turbulent premixed flames. For example, cusps with their extremely large values of flame curvature will affect the mean turbulent flame speed (Law Reference Law2010; Humphrey et al. Reference Humphrey, Emerson and Lieuwen2018; Dave & Chaudhuri Reference Dave and Chaudhuri2020). Furthermore, closure models of turbulent flame speeds and volumetric heat release rates, which depend on the fractal dimension of the flame surface, assume perfect self-similarity and so may be improved by accounting for inner intermittency (Charlette, Meneveau & Veynante Reference Charlette, Meneveau and Veynante2002; Gülder Reference Gülder2007; Roy & Sujith Reference Roy and Sujith2021).
It is intriguing to consider how the cusp-like features on the flame surface are related to the small-scale structures, such as ramp cliffs, of the underlying scalar fields. While ramp-cliff structures have been observed in direct numerical simulations of premixed combustion (Wang et al. Reference Wang, Tong, Barlow and Karpetis2007; Cai et al. Reference Cai, Wang, Tong, Barlow and Karpetis2009), their connection to intermittent fluctuations of the flame surface is unknown. More generally, the question of how the statistics of the flame surface are connected to those of the reacting scalar fields of combustion, possibly via a flame indicator function (Thiesset et al. Reference Thiesset, Maurice, Halter, Mazellier, Chauveau and Gökalp2016), deserves further study, especially in light of the extensive literature on the turbulent transport of conserved scalars (Warhaft Reference Warhaft2000; Falkovich & Sreenivasan Reference Falkovich and Sreenivasan2006); one would require simultaneous high-resolution measurements of the flame surface and the scalar fields, which, while beyond our current scope, is an important task for future work.
It is also interesting to note that the equation for the propagation of a thin premixed flame resembles the Kardar–Parisi–Zhang (KPZ) equation (Kerstein et al. Reference Kerstein, Ashurst and Williams1988; Kardar, Parisi & Zhang Reference Kardar, Parisi and Zhang1986) (in turn closely related to the Burgers equation (Bec & Khanin Reference Bec and Khanin2007)), whose dynamics in the presence of additive noise is well studied (Verma Reference Verma2000). However, a crucial difference arises due to the advection of the flame by the turbulent flow, which, if modelled as a random flow, appears as multiplicative noise. This results in a fundamentally distinct dynamics (Kerstein et al. Reference Kerstein, Ashurst and Williams1988; Yakhot Reference Yakhot1988), for example, the propagating flame attains a statistically stationary mean speed in contrast to the power-law growth predicted by the KPZ equation with additive noise. Thus, in light of the present results, it would be interesting to explore the intermittent properties of the KPZ equation with multiplicative and spatio-temporally correlated noise.
Finally, while we have focused on temporal measurements, the cusp-like structures of the flame surface will certainly give rise to inner intermittency in space, so that spatial structure functions obtained from a flame edge profile at a single snapshot in time should scale anomalously. Establishing this experimentally would require a very large flame in order to capture the required range of spatial scales, a challenge that will hopefully be taken up in the future. Other important questions raised by our work include how the inner intermittency of the self-similar range relates to the extreme-value statistics of the sub-diffusive dissipative scales (Hamlington et al. Reference Hamlington, Poludnenko and Oran2012; Chaudhuri et al. Reference Chaudhuri, Kolla, Dave, Hawkes, Chen and Law2017), and whether the scaling exponents for a premixed flame are universal, as they seem to be for a passive scalar (Watanabe & Gotoh Reference Watanabe and Gotoh2006).
Supplementary material and movie
Supplementary material and movie are available at https://doi.org/10.1017/jfm.2023.63.
Acknowledgements
This research was conceptualized following a visit to the International Centre for Theoretical Sciences (ICTS), India for participating in the program, Turbulence: From Angstroms to light years (Code: ICTS/Prog-taly2018/01). The authors thank L. Humphrey (Georgia Tech) for sharing his experimental data. The authors benefited from discussions at the Inter Group Meetings held at IIT Madras, ICTS Bangalore and IIT Bombay. A.R. and J.R.P. also thank S.S. Ray (ICTS) and J. Bec (MINES ParisTech) for insightful discussions and comments.
Funding
A.R. is grateful for the HTRA Ph.D. fellowship from MHRD, India. J.R.P. is thankful for financial support from the IIT Bombay IRCC Seed Grant and from the DST-SERB grant (SRG/2021/001185). T.C.L. gratefully acknowledges the support received from the Air Force Office of Scientific Research (Contract no. FA 9550-20-1-0215), contract monitor Dr C. Li. R.I.S. gratefully acknowledges funding from the Institute of Excellence Grant (SB/2021/0845/AE/MHRD/002696) and the J. C. Bose Fellowship (No. JCB/2018/000034/SSC).
Declaration of interests
The authors report no conflict of interest.
Data availability statement
The data that support the findings of this study are available upon reasonable request from the corresponding authors.
Appendix. Anomalous scaling persists after smoothing or eliminating multi-valued flame wrinkles
Wrinkling of the flame in turbulence causes the flame edge  $(x(s),y(s))$ to become locally multi-valued, so that there will be multiple values of
 $x(s)$ for each
 $y(s)$. In the main text, such multi-valued regions of the flame edge are converted to a single-valued function of
 $y$ – the leading flame edge – by choosing the value of
 $x$ with the smallest magnitude. While this treatment allows for a straightforward definition of the flame fluctuation and its temporal increment, it does introduce the possibility of multi-valued folds in the flame edge
 $(x(s),y(s))$ being registered as artificially abrupt variations in the leading flame edge
 $\xi (y)$. This could in turn produce artificial large increments when these folds are advected past a fixed longitudinal measurement location. Here, we carry out two checks which are designed to reduce or eliminate the effect of such multi-valued folds on the statistics of the flame increment; if the anomalous scaling behaviour persists then we can be confident that it is a genuine feature of the flame dynamics.
First, rather than using the leading flame edge, we construct a locally averaged flame edge  $\tilde {\xi }(y,t)$, where for each value of
 $y$ we set
 $\tilde {\xi }$ to be equal to the average of all the corresponding values of
 $x$ (mathematical definitions for both flame edges are given in the supplementary material). Any multi-valued folds which appear as abrupt variations in
 $\xi (y,t)$ will be significantly smoothed out in
 $\tilde {\xi }(y,t)$. Of course, where the flame is single valued,
 ${\xi }$ and
 $\tilde {\xi }$ will be identical. We then define the fluctuations and the increment as
 $\tilde {\xi }^\prime (y,t) = \tilde {\xi } - \langle \tilde {\xi } \rangle$ and
 $\delta \tilde {\xi }^\prime (\tau )=\tilde {\xi }^\prime (t+\tau )-\tilde {\xi }^\prime (t)$, respectively, and determine the scaling exponents
 $\zeta _p$ just as we do in the main text. The results, presented in figure 7(a), show strongly intermittent behaviour similar to that seen in figure 4(a).
Anomalous scaling of the exponents of the structure function, calculated after implementing two procedures that are designed to reduce or eliminate any artificial large increments in the flame position that arise from multi-valued folds or wrinkles being described by the single-valued leading flame edge. First, for panel (a), we use the locally averaged flame edge profile, which averages over multi-valued regions of the flame thereby providing a much smoother representation of multi-valued folds when compared with the leading edge. Second, for panel (b), we use a filtered data set of increments of the leading edge, obtained by removing any increment value that is calculated using time instants when the flame is multi-valued. The filtered data set is therefore entirely free from the influence of multi-valued regions of the flame, and the exponents of the corresponding structure functions are compared with those of the full data set, for the case of flame F1. Clearly, the anomalous scaling behaviour persists for the locally averaged flame edge, as well as for the filtered data (which, however, have enlarged error bars due to a reduction of data points).

As a second check, we return to the leading flame edge, but now entirely eliminate any points where the flame edge is multi-valued from the calculation of the scaling exponents. For this, we first flag any time instant at which the flame edge  $(x(s),y(s))$ is multi-valued. Then, while calculating the increments
 $\delta {\xi }^\prime =\xi ^\prime (t+\tau )-\xi ^\prime (t)$, we check to see if either of the two data points are flagged (i.e. if the flame edge is multi-valued at either time instant), and if so we discard the corresponding increment value. The filtered set of data values thus obtained correspond to increments
 $\delta {\xi }^\prime (\tau )$ such that the flame edge is single valued at both
 $t$ and
 $t+\tau$. This procedure will entirely eliminate any large-valued increments due to folds in the flame edge being advected past the measurement location
 $y$. The scaling exponents obtained from this filtered data set are compared with those obtained from the unfiltered data in figure 7(b). We see that the strongly anomalous scaling behaviour persists, although the loss of data due to filtering enlarges the error bars especially for large values of the order
 $p$.
Taken together, these two checks demonstrate that the inner intermittency of the flame fluctuations detected in this work is not an artefact of representing the edge by a single-valued function. As shown in § 6, the extreme-valued increments arise from the advection of cusp-like structures past the measurement location. These cusp-like features correspond to genuine sharp variations of the flame edge, and so representing them by the single-valued leading edge does not introduce artificial abrupt variations even when the cusps are multi-valued. So, though the precise values of the flame fluctuation and its increment depend on the manner in which the flame edge is described, their statistical features including anomalous scaling are qualitatively unchanged.


 Open access

