


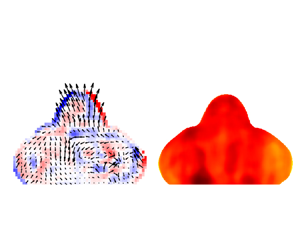

1. Introduction
Droplet impingement commonly exists in nature and industrial processes, including spray cooling, spray coating and inkjet printing (Xu, Wang & Jiang Reference Xu, Wang and Jiang2021; Lohse Reference Lohse2022). Droplet impingement on a heated substrate differs significantly from that on a solid surface at room temperature. The temperature difference between the solid surface and the liquid droplet not only elevates the fluid temperature, triggering more drastic phase changes (Benther et al. Reference Benther, Pelaez-Restrepo, Stanley and Rosengarten2021; Yu et al. Reference Yu, Zhang, Hu and Luo2021), but also induces fluctuations and non-uniformities in fluid viscosity, density and surface tension (Cazabat & Guena Reference Cazabat and Guena2010; Diddens, Li & Lohse Reference Diddens, Li and Lohse2021), resulting in more complex and diverse physical phenomena. Understanding of these phenomena is currently less comprehensive than that of droplet impingement on room-temperature substrates. Previous studies have investigated the effects of various factors such as fluid type, droplet diameter, impingement velocity and surface temperature on droplet impingement morphological characteristics (Wang, Lin & Cheng Reference Wang, Lin and Cheng2005; Tran et al. Reference Tran, Staat, Prosperetti, Sun and Lohse2012; Staat et al. Reference Staat, Tran, Geerdink, Riboux, Sun, Gordillo and Lohse2015; Chen et al. Reference Chen, Zhang, Xu, Ouyang and Jiang2016; Shirota et al. Reference Shirota, van Limbeek, Sun, Prosperetti and Lohse2016; Roisman, Breitenbach & Tropea Reference Roisman, Breitenbach and Tropea2018; Wang et al. Reference Wang, Orejon, Takata and Sefiane2022). The relative dominance between the heat transfer time scale and the flowing time scale varies with the impact parameters (Auliano et al. Reference Auliano, Auliano, Fernandino, Zhang and Dorao2018), leading to different phenomena, including stick, spread, rebound, break-up, splash, boiling and evaporation (Moreira, Moita & Panão Reference Moreira, Moita and Panão2010; Lyu et al. Reference Lyu, Mathai, Wang, Sobac, Colinet, Lohse and Sun2019). The alterations in droplet macroscopic morphologies merely reflect the ‘outcomes’ of droplet impingement, while the underlying ‘processes’ that impact these outcomes through external factors are still unclear. Consequently, further exploration is necessary to understand the ‘processes’ involved in microscopic flow and heat transfer patterns.
When a droplet impinges onto a heated substrate, heat is transferred from the bottom to the top of the droplet, inducing a temperature gradient and internal convection, including Marangoni and Rayleigh convection (Bouillant et al. Reference Bouillant, Mouterde, Bourrianne, Lagarde, Clanet and Quéré2018; Diddens et al. Reference Diddens, Li and Lohse2021). Moreover, as the wall temperature rises, the evaporation behaviours and impact dynamics can be categorized into four regimes: evaporation, nucleate boiling, transition boiling and film boiling (Liang & Mudawar Reference Liang and Mudawar2017). Within different boiling regimes, the processes of heat absorption and diffusion inside droplets vary, significantly affecting the cooling effect (Xu et al. Reference Xu, Wang and Jiang2021). It should be noted that the heat conduction and thermal convection patterns are influenced by both velocity and temperature fields. Therefore, further quantitative and simultaneous measurements on internal velocity and temperature distributions inside droplets are required to better understand the flow and heat transfer mechanisms.
As a well-developed method to study the internal flow inside droplets, micro-particle image velocimetry ( $\mathrm {\mu }$PIV) can provide a spatial resolution of a flow field down to several microns (Santiago et al. Reference Santiago, Wereley, Meinhart, Beebe and Adrian1998; Stone, Stroock & Ajdari Reference Stone, Stroock and Ajdari2004) and has been utilized under various conditions, including evaporating droplets with single (Hamamoto, Christy & Sefiane Reference Hamamoto, Christy and Sefiane2011; Dash et al. Reference Dash, Chandramohan, Weibel and Garimella2014; Yim, Bouillant & Gallaire Reference Yim, Bouillant and Gallaire2021) or multiple (Christy, Hamamoto & Sefiane Reference Christy, Hamamoto and Sefiane2011; Li et al. Reference Li, Diddens, Lv, Wijshoff, Versluis and Lohse2019; Efstratiou, Christy & Sefiane Reference Efstratiou, Christy and Sefiane2020; Diddens et al. Reference Diddens, Li and Lohse2021) components, Leidenfrost droplets with single (Bouillant et al. Reference Bouillant, Mouterde, Bourrianne, Lagarde, Clanet and Quéré2018; Yim et al. Reference Yim, Bouillant, Quéré and Gallaire2022; Yang et al. Reference Yang, Li, Wang, Fan, Ma, Yu, Guo, Chen, Wang and Deng2023) or multiple (Lyu et al. Reference Lyu, Tan, Wakata, Yang, Law, Lohse and Sun2021) components, and droplets impacting onto heated surfaces (Lastakowski et al. Reference Lastakowski, Boyer, Biance, Pirat and Ybert2014; Erkan Reference Erkan2019; Gultekin et al. Reference Gultekin, Erkan, Colak and Suzuki2020). Bouillant et al. (Reference Bouillant, Mouterde, Bourrianne, Lagarde, Clanet and Quéré2018) studied the velocity field within quasi-static Leidenfrost droplets using
 $\mathrm {\mu }$PIV. Their research revealed the self-rotation and self-propulsion phenomena of Leidenfrost droplets, which arise from an asymmetry in the vapour profile. Lyu et al. (Reference Lyu, Tan, Wakata, Yang, Law, Lohse and Sun2021) utilized
 $\mathrm {\mu }$ PIV to study the internal flow of Ouzo Leidenfrost droplets, and revealed that the internal flow during emulsification was a result of thermocapillary flow and shear flow. As for the process of droplets impacting on a heated surface, Lastakowski et al. (Reference Lastakowski, Boyer, Biance, Pirat and Ybert2014) focused on the flow close to the substrate with bottom view
 $\mathrm {\mu }$PIV. The radial velocity profile showed good agreement with inviscid convective flow theory (Roisman, Berberovı & Tropea Reference Roisman, Berberovı and Tropea2009; Eggers et al. Reference Eggers, Fontelos, Josserand and Zaleski2010). Gultekin et al. (Reference Gultekin, Erkan, Colak and Suzuki2020) further studied the velocity profiles within single droplets or droplet pairs impacting on a heated substrate, and found that the radial profile is nonlinear outside due to capillary and viscous effects.
In recent years, temperature field measurement technologies such as infrared (IR) imaging (Shiri & Bird Reference Shiri and Bird2017; Teodori et al. Reference Teodori, Pontes, Moita and Moreira2018; Liu et al. Reference Liu, Zhang, Cai and Tsai2022; Yim et al. Reference Yim, Bouillant, Quéré and Gallaire2022) and laser-induced fluorescence (LIF) thermometry (Chaze et al. Reference Chaze, Caballina, Castanet and Lemoine2017; Castanet et al. Reference Castanet, Chaze, Caballina, Collignon and Lemoine2018, Reference Castanet, Caballina, Chaze, Collignon and Lemoine2020) have been introduced to study the temperature distribution of droplets, providing new insights into micro-scale droplet heat transfer mechanisms. Chaze et al. (Reference Chaze, Caballina, Castanet and Lemoine2017) employed two-colour LIF (2c-LIF) to investigate the temperature field inside a deionized water droplet impinging onto a  $600\,^\circ$C smooth surface with sampling frequency 15 Hz. They increased the resulting frequency by combining repeated experiments. The results indicated that increasing the droplet Weber number from 10 to 140 led to an increase in the average temperature rise from
 $15\,^\circ$C to
 $40\,^\circ$C. However, the reflection and refraction at the droplet interface may cause non-uniformity of laser intensity and add extra interference to the measurement results. They suggested that the application of 2c-LIF can improve the signal quality using the ratiometric principle. Additionally, they highlighted that the main challenges of droplet internal temperature field measurement include spectrum overlap, fluorescence attenuation, fluorescence self-excitation and total internal reflection. Castanet et al. (Reference Castanet, Chaze, Caballina, Collignon and Lemoine2018, Reference Castanet, Caballina, Chaze, Collignon and Lemoine2020) examined water droplet impingement onto surfaces with temperatures ranging from 300
 $\,^\circ$C to 700
 $\,^\circ$C. Through theoretical and experimental studies, they demonstrated that the water temperature inside a Leidenfrost droplet can exceed the saturation temperature and reach the spinodal temperature, which is the highest temperature at which water can exist in a liquid state. For water at atmospheric pressure, the spinodal temperature is 320.25
 $\,^\circ$C.
Several previous researchers combined planar LIF (PLIF) with  $\mathrm {\mu }$PIV to realize the simultaneous measurement of velocity and temperature field (Misyura et al. Reference Misyura, Morozov, Volkov and Vysokomornaya2019; Volkov & Strizhak Reference Volkov and Strizhak2021; Voulgaropoulos et al. Reference Voulgaropoulos, Aguiar, Markides and Bucci2022). Voulgaropoulos et al. (Reference Voulgaropoulos, Aguiar, Markides and Bucci2022) combined 2c-PLIF,
 $\mathrm {\mu }$PIV and IR thermometry to study bubble dynamics and heat transfer in pool boiling. They achieved the simultaneous measurement of velocity and temperature fields near the bubble, as well as the temperature field of the substrate, providing detailed fluid flow and heat transfer information in bubble lifecycles. Their work demonstrated the feasibility of simultaneously acquiring velocity and temperature fields outside the phase interface (bubble), which could help to quantify the essential aspects of convection heat transfer during the pool boiling bubble growth and departure process. However, the simultaneous measurement of multiple physical fields within dynamic droplet interfaces remains a challenge to be addressed.
In this paper, we utilized 2c-PLIF and  $\mathrm {\mu }$PIV technologies to obtain quantitative velocity and temperature fields of the droplet impingement process with high temporal and spatial resolution. We introduced an image distortion correction method based on astigmatism theory that is applicable to objects with dynamic interfaces. Using this method, we studied water droplet impingement onto a heated wall with different temperatures. We discovered the hot spots at the solid–liquid interface for the first time. Furthermore, the internal flow and heat transfer mechanisms were discussed within different droplet boiling regimes.
2. Experimental methods
2.1. Experimental system
The experimental method was based on the simultaneous use of 2c-PLIF and  $\mathrm {\mu }$PIV principles. Schematics of the experimental system for both side view and bottom view imaging are shown in figures 1(a,b). To minimize the influence of environments on the droplet impingement process, experiments were conducted within a sealed aluminum alloy test chamber. The temperature, humidity and pressure of the surrounding environment were controlled. The chamber measured
 $30\ {\rm cm} \times 15\ {\rm cm} \times 15\ {\rm cm}$, and each side was opened with quartz observation windows to allow for high-speed (HS) camera recording and laser exposure. The chamber was equipped with a three-dimensional displacement platform, allowing for precise position adjustment. The heated surface comprised a polished silicon experimental substrate, a sapphire base (50 mm diameter, 5 mm thickness), an annular ceramic heating plate, and a heat insulation board. The ceramic heater was connected with an external direct current source. The temperature of the experimental substrate was measured with a T-type thermocouple. The sapphire base and the silicon substrate exhibited good heat conduction properties, and IR measurements (figure 19 in the Appendix) showed a temperature fluctuation less than 1
 $\,^\circ$C when the silicon substrate was heated up to 282
 $\,^\circ$C, indicating uniform heating across the entire surface from the sapphire base to the experimental substrate.
Schematic of the experimental system. (a) Side view imaging. (b) Bottom view imaging. (c) Timing of camera exposures and laser pulses in minimum period.

A two-pulse  $\mathrm {\mu }$PIV laser was used to generate a two-pulse laser of 527 nm with frequency 4 kHz for each laser pulse. The time interval between two laser pulses was
 $\Delta t=125\ \mathrm {\mu }$s. For side view imaging, the laser was then converted into a vertical laser sheet using a cylindrical concave lens (
 $\,f=-200$ mm) incident into the droplet through the droplet centre from the side direction. For bottom view imaging, the droplet was illuminated with a laser beam through the transparent quartz window. As calculated, the thickness of the laser sheet was less than 0.2 mm at its thinnest position. Fluorescence dyes within the droplet were excited by the 527 nm laser at the same time, and emitted fluorescence signals of different wavelengths. Three types of fluorescent dye were seeded into the fluid (which will be detailed in § 2.2), and the fluorescence signals were captured by an HS microscopic photography system including two HS cameras, a long-distance microscopic lens, a 570 nm dichroic mirror, a 540–560 nm band-pass filter and a 645 nm long-pass filter. For bottom view imaging, an additional 45
 $^\circ$ tilted 535 nm dichroic mirror was placed under the sapphire substrate and the quartz window. The illuminating light source of the 527 nm laser beam can be transmitted, and fluorescence signals with wavelength >540 nm are reflected to the two HS cameras. The clear aperture of the microscopic lens was 63 mm, with numerical aperture 0.08–0.14. The depth of field could be calculated with the Rayleigh criterion, resulting in less than 55
 $\mathrm {\mu }$m for fluorescence signals of wavelength <700 nm. The two cameras were spatially calibrated using a calibration plate to the same field of view region. The spatial resolution after calibration was 3.259
 $\mathrm {\mu }$m.
The laser and cameras were synchronized using a programmable timing unit. The laser pulse and camera exposure time in each minimum period were set as shown in figure 1(b). The HS camera 1 was exposed only in the second half to capture the fluorescence signal excited by laser pulse B, while HS camera 2 was exposed twice, with time interval 125  $\mathrm {\mu }$s. The three frames were named F0, F1 and F2 – F0 and F2 were used to calculate the temperature field, while F1 and F2 were used to calculate the velocity field.
2.2. Measurement principles
The velocity measurement was based on the  $\mathrm {\mu }$PIV method. The selection of
 $\mathrm {\mu }$PIV tracing particles needs to be considered from two perspectives. First, the particle diameter should strike a balance between being able to be photographed clearly and providing higher spatial resolution. The distribution of particles should not be too dense or too sparse. Second, the tracer particles must be able to accurately follow the flow field and avoid relative slippage as much as possible. In our experiments,
 $\mathrm {\mu }$PIV tracing fluorescence particles of 1 wt% were added into the fluid, with diameter
 $d_p = 2\ \mathrm {\mu }$m and density
 $\rho _p = 1.05\times 10^{3}~{\rm kg}~{\rm m}^{-3}$. The particle distribution was
 $\sim$70 particles in a
 $0.5\ {\rm mm} \times 0.5\ {\rm mm}$ window of images. The identities of particle and flow motion can be evaluated by the particle Stokes number
 $St_p=\tau _p/\tau _f$ (Raffel et al. Reference Raffel, Willert, Scarano, Kähler, Wereley and Kompenhans2018). Among them,
 $\tau _p=d_p^2 (\rho _p-\rho _l)/18\mu _l$ (where
 $\rho _l$ and
 $\mu _l$ are the density and dynamic viscosity of the fluid) represents the relaxation time scale of the particle, and
 $\tau _f = D_0/U_0$ (where
 $D_0$ is the initial diameter of the droplet, and
 $U_0$ is the impingement velocity). The physical properties of the fluid can be found in table 1. In our experiments,
 $St_p \sim 10^{-5} \ll 1$, indicating that the tracing particles were able to track the flow field accurately.
Physical properties of the fluid and parameters of the droplet.

Temperature measurement was based on the 2c-PLIF method, combined with  $\mathrm {\mu }$PIV to allow us to obtain simultaneous distribution of both velocity and temperature. The LIF technique is flow visualization based on the variation of excited fluorescence signal intensity with temperature, concentration and pH. In a micro-volume
 ${\rm d} V$, the signal intensity
 $F$ is (Chaze et al. Reference Chaze, Caballina, Castanet and Lemoine2016)
 \begin{equation} F = \chi\,\frac{\varOmega}{4{\rm \pi}}\,\varepsilon_0 \phi\,\frac{I_0}{1+I_0/I_{sat}}\,C \, {\rm d} V, \end{equation}
where  $\chi$ is the transmission efficiency of the signal to the camera,
 $\varOmega$ is the solid angle of the region,
 $C$ is the molar concentration of the fluorescent dye,
 $\phi$ is the fluorescence quantum yield,
 $I_0$ is the incidence laser intensity,
 $\varepsilon _0$ is the molar extinction coefficient, and
 $I_{sat}$ is the saturation intensity of the fluorescent dye. In this paper, we used a laser sheet to confine the observation region to the droplet symmetry plane, and used two LIF dyes to improve measurement accuracy, thus the method is called 2c-PLIF. The two types of fluorescent dyes, namely Fluorescein sodium (FL,
 $7\times 10^{-5}\ {\rm mol}\ {\rm l}^{-1}$) and Sulforhodamine 101 (SR,
 $1.4\times 10^{-6}\ {\rm mol}\ {\rm l}^{-1}$), were added into the fluid. With the dichroic mirror and filters, the FL signal was captured mainly by HS camera 1, and SR and
 $\mathrm {\mu }$PIV tracing signals were captured mainly by HS camera 2. The SR dye is temperature-insensitive, and the FL dye is temperature-sensitive; the ratio
 $R(T)$ of the two fluorescence intensities is
 \begin{equation} R(T) = \frac{F_{FL}(T)}{F_{SR}(T)} \propto \frac{\varepsilon_{0,FL}(T)}{\varepsilon_{0,SR}(T_0)} \, \frac{\phi_{FL}(T)}{\phi_{SR}(T_0)} \, \frac{C_{FL}}{C_{SR}} \, \frac{1+\dfrac{I_0}{I_{sat,SR}}}{1+\dfrac{I_0}{I_{sat,FL}}}. \end{equation}
Using the ratiometry method, the fluorescence signal change due to laser non-uniformity and concentration variation was corrected (Chaze et al. Reference Chaze, Caballina, Castanet and Lemoine2017; Castanet et al. Reference Castanet, Chaze, Caballina, Collignon and Lemoine2018, Reference Castanet, Caballina, Chaze, Collignon and Lemoine2020; Voulgaropoulos et al. Reference Voulgaropoulos, Aguiar, Markides and Bucci2022), and ratio  $R(T)$ is a function of
 $T$. This method is necessary, especially for droplet impingement measurement where dynamic interface and evaporation can lead to laser non-uniformity and concentration variation. With proper temperature calibration, the temperature field could be measured. Because SR signal intensity will decay at a temperature above 60
 $\,^\circ$C (Chaze et al. Reference Chaze, Caballina, Castanet and Lemoine2017), we used a flow through a 2 mm thick cuvette to calibrate the temperature in the range 15
 $\,^\circ$C–99
 $\,^\circ$C. As shown in figure 2, the calibration result was fitted to a linear fitting curve:
 \begin{equation} T = 55.53\,R(T) - 14.86 \ (^\circ{\rm C}), \end{equation}
where  $R(T)$ is the processed ratio between FL and SR signal intensities. The velocity field measurement was based on
 $\mathrm {\mu }$PIV using the acquired frames F1 and F2, which will be described in § 2.3.
Temperature calibration curve of temperature  $T$ as a function of fluorescence intensities ratio
 $R$.

2.3. Post-processing methods
The raw images recorded needed to be post-processed to acquire the final temperature and velocity field. The HS camera 2 contained both SR and  $\mathrm {\mu }$PIV tracing particle signals, which needed separation. The post-processing procedure is shown in figure 3. Figures 3(a–c) represent the raw frames F0–F2. The first step was to correct the fields of view of two cameras to the same region using a pre-acquired spatial calibration relationship. Figure 3(d) is the ratio
 $s$ of spatially corrected F0 and F2, in which the influence of
 $\mathrm {\mu }$PIV tracing particles on ratio
 $s$ is significant. The image then subtracted the sliding average of
 $15\times 15$ pixels to find the particles, as shown in figure 3(e). It was then processed with a dilation filter of
 $5\times 5$ pixels to enlarge the particle region, binarized, and multiplied by figure 3(d) to remove the particle regions, as shown in figures 3(f–h). The blank pixels were then linearly interpolated, as shown in figure 3(i). The influence of
 $\mathrm {\mu }$PIV tracing particles on temperature measurement is greatly reduced by the above steps. The image in figure 3(i) was then smoothed using a
 $43\times 43$ median filter, as shown in figure 3(j). As shown in figure 3(k), it was converted to a temperature field using the temperature calibration curve and initial droplet temperature
 \begin{equation} T = f \left( \frac{s}{s_0}\,f^{{-}1}(T_0) \right), \end{equation}
where  $T_0$ denotes the initial temperature, and
 $s_0$ denotes the average signal before the droplet contacts the substrate. As shown in figure 3(l), The velocity field was calculated using images F1 and F2. The initial search window was
 $256\times 256$ pixels with 50 % overlap, and the second search windows were four times
 $64\times 64$ pixels with 75 % overlap. The resolution of the velocity field was 52.14
 $\mathrm {\mu }$m.
Post-processing procedures: (a) raw fluorescence image F0; (b) raw fluorescence image F1; (c) raw fluorescence image F2; (d) F0/F2; (e) after subtracting sliding average; (f) after inverting and dilation filter; (g) after binarization; (h) after removing  $\mathrm {\mu }$PIV tracing particle regions; (i) after linear interpolation in MATLAB; (j) after median filter; (k) temperature field; (l) velocity field.

The ratiometric method can eliminate the effects of laser non-uniformity raised from the reflection and refraction of the laser sheet through the liquid–gas interface (Chaze et al. Reference Chaze, Caballina, Castanet and Lemoine2017; Castanet et al. Reference Castanet, Caballina, Chaze, Collignon and Lemoine2020). The uncertainty of the 2c-PLIF method  $\sigma _T$ consists mainly of the signal noise of HS cameras
 $\sigma _s$ and the calibration error
 $\sigma _c$. Chaze et al. (Reference Chaze, Caballina, Castanet and Lemoine2016) provided an approach to evaluate
 $\sigma _s = ({RMS}/R)/s$, where
 $RMS$ represents the root mean square of the fluorescence intensities ratio image
 $F_{FL}/F_{SR}$,
 $R$ represents the averaged fluorescence ratio from the image, and
 $s$ represents the sensitivity of the fluorescence ratio to temperature. The sensitivity
 $s$ is defined by Chaze et al. (Reference Chaze, Caballina, Castanet and Lemoine2016) as
 \begin{equation} s = \frac{\ln (R(T_1) / R(T_2))}{T_1 - T_2} \times 100\,\%, \end{equation}
where  $R(T_1)$ and
 $R(T_2)$ are the fluorescence ratios at the highest and lowest temperatures (
 $T_1$ and
 $T_2$, respectively) in the calibration curve. The sensitivity is calculated as 1.498 % per
 $^\circ$C. Also, the calibration error is defined as
 $\sigma _c=|T-T_c|$, where
 $T$ represents the temperature calculated with the calibration curve at the fluorescence ratio
 $R$, and
 $T_c$ represents the temperature measured during the calibrating process. As
 $\sigma _s$ originates from the random noise of HS cameras, the two sources of uncertainties can be regarded as mutually independent. The overall uncertainty can be calculated with the propagation law of error
 $\sigma _T=\sqrt {\sigma _s^2+\sigma _c^2}$. Figure 4(d) shows the overall uncertainty for each calibration point. Hence the uncertainty of temperature measurement is expected to be
 $\pm 1.7\,^\circ$C. The substrate temperature was measured using a K-type thermocouple with uncertainty
 $\pm 0.8\,^\circ$C.
Fluorescence ratio images of (a)  $T_c=44.0\,^\circ$C, (b)
 $T_c=78.6\,^\circ$C, (c)
 $T_c=99.0\,^\circ$C. The black bar represents a length scale of 0.5 mm. The colour bar shows the values of fluorescence intensities ratio
 $R$. (d) The signal noise
 $\sigma _s$, calibration error
 $\sigma _c$ and overall uncertainty
 $\sigma _T$ for each calibration temperature.

The uncertainties of  $\mathrm {\mu }$PIV measurements are quantified using the method of Sciacchitano et al. (Reference Sciacchitano, Neal, Smith, Warner, Vlachos, Wieneke and Scarano2015). The error distributions of the velocity magnitude, and velocity components in the
 $x$ and
 $y$ directions, are shown in figures 5(b–d). The relative velocity error
 $U_{err}/|U|$ and relative error of each velocity component can be calculated, with over 72 % of velocity vectors having relative uncertainty <10 %, and over 87 % of velocity vectors having relative uncertainty <20 %. The vectors having relative uncertainty greater than 20 % mainly have a small velocity magnitude, which makes
 $\mathrm {\mu }$PIV calculations harder and raises the uncertainty.
(a) Detailed velocity field and vorticity field for  $T_w=359\,^\circ$C,
 $t=6$ ms. (b–d) Uncertainty calculated with the method of Sciacchitano et al. (Reference Sciacchitano, Neal, Smith, Warner, Vlachos, Wieneke and Scarano2015): (b) velocity magnitude uncertainty
 $U_{err}$; (c) uncertainty of velocity in the
 $x$ direction,
 $u_{err}$; (d) uncertainty of velocity in the
 $y$ direction,
 $v_{err}$. The black bar represents a length scale of 1 mm, and the arrow represents velocity scale of 1 m s
 $^{-1}$. The colour bar in (a) shows the value of vorticity
 $\omega$. The colour bar in (b–d) shows the value of velocity magnitude uncertainty
 $U_{err}$.

Another error of droplet internal flow visualization arises from the image distortion due to refraction at the droplet dynamic interface (Kang et al. Reference Kang, Lee, Lee and Kang2004; Chaze et al. Reference Chaze, Caballina, Castanet and Lemoine2017; Bouillant et al. Reference Bouillant, Mouterde, Bourrianne, Lagarde, Clanet and Quéré2018). We introduced image distortion analysis by reconstructing the refraction light path across the droplet interface. We first recognize the droplet outline in each frame, rotate the outline by one complete revolution around the axis of symmetry (passing through the droplet centre of mass, along the height axis), and then obtain the reconstructed droplet three-dimensional interface. The images captured by cameras are regarded to be located on the central plane of the droplet; the actual luminous point will have a shift on the central plane after the refraction at the droplet interface. With our image distortion correction method, this shift could be calculated. A sample result is shown in figure 6, where figure 6(a) is a raw image, and figure 6(b) is the corresponding ‘real’ image after correction.
(a) Raw fluorescence image. (b) Image after image correction. The grey dashed line represents the original droplet boundary, and the grey vectors represent the position shift from the raw image to the corrected image.

2.4. Experimental cases
A droplet with diameter  $D_0$ was generated using a needle and a micro-syringe pump. As the highest temperature of the substrate was
 ${\sim }360\,^\circ$C during experiments, fluid in needle could be heated up. To eliminate this effect, the needle was cooled by water-cooled coils to control the droplet's initial temperature to
 $T_{d,0}$. Droplets fell onto a heated smooth silicon substrate with impingement velocity
 $U_0$. The silicon substrate's contact angle at room temperature was
 $60^\circ$. Parameters of impinging droplets are shown in table 1.
According to the droplet evaporation time curve (figure 7) and droplet morphologies (see figure 9 below), we can separate the boiling regimes into evaporation, nucleate boiling and contact boiling regimes (within the wall temperature range in our experiments). When the wall temperature  $T_w$ was increased from 22
 $\,^\circ$C to 100
 $\,^\circ$C, the droplet evaporation time decreased from 50 min to
 $\sim$10 s. At this point, the wall temperature did not reach the saturation temperature, and droplets experienced only evaporation after impingement. From 100
 $\,^\circ$C to 171
 $\,^\circ$C, the boiling regime changed to nucleate boiling, causing the fluid to contact the substrate and generate bubbles. When
 $T_w>171\,^\circ$C, the droplets entered the contact boiling regime. The droplets experienced contact boiling first, then formed a vapour film under a portion of the contact area between droplets and substrate, resulting in an increase in the evaporation time. Above 200
 $\,^\circ$C, the evaporation time slowly decreased. Droplets rebounded after the first impact, instead of being deposited on the substrate for
 $T_w$ less than 200
 $\,^\circ$C. Droplet rebounding morphologies can be categorized into partial rebound (
 $T_w<296\,^\circ$C) and complete rebound (
 $T_w>296\,^\circ$C), as shown in supplementary material figures S1 and S2 (available at https://doi.org/10.1017/jfm.2024.751). The transitions of droplet dynamics from deposition to partial or complete rebound are marked in figure 7. As shown in figure 7, we selected several wall temperatures (in
 $\,^\circ$C) to study the corresponding internal temperatures and velocity fields during droplet impingement in the 20 ms after impingement: 22, 68, 135, 171, 190, 200, 219, 255, 296, 359.
Droplet evaporation time at different wall temperatures, where typical morphological phenomena at different wall temperatures are shown. The red stars represent cases studied with the use of the experimental system mentioned before. The grey dashed lines mark the transition wall temperatures  $T_w=200\,^\circ$C and 296
 $\,^\circ$C of different droplet impingement outcomes: deposition, partial rebound and complete rebound.

3. Results and discussions
3.1. Droplet morphology
In the first 20 ms after impingement, all the studied droplets experienced the process of ‘spread–recoil’. The differences caused by different surface temperatures include mainly that the main phenomenon of the phase transition of the droplets is different, the dynamic spreading and retracting processes of the droplets are not synchronized, and whether the droplets finally detach from the surface. As shown in figures 8(a,b) and supplementary material figures S1 and S2, when  $T_w<100\,^\circ$C, no boiling behaviour or bubble formations were observed in the spreading stage or the recoiling stage. After the droplet stopped recoiling, the surface wave started to propagate, and the droplet turned into an oscillating stage. With higher wall temperature, the droplet could be heated to a higher temperature and thus a lower surface tension
 $\sigma$. Lamb (Reference Lamb1924) and Cummings & Blackburn (Reference Cummings and Blackburn1991) showed that the propagation speed of the surface wave was
 $\propto \sigma ^{1/2}$, and the oscillation period was
 $\propto \sigma ^{-1/2}$, which indicated that droplets impinging onto surfaces with higher
 $T_w$ have smaller surface wave propagation speed. Furthermore, when the impinging droplet reaches maximum spreading, a lower surface tension can lead to a larger spreading radius, as the interface energy transforming from kinetic energy is directly proportional to
 $\sigma$. This could result in a larger spreading radius, a longer recoiling time, and a longer oscillation period, which are shown in the time variations of spreading radius and centre height in figures 8(c,d).
Droplet impingement in the evaporation regime: (a) spreading stage,  $T_w=68\,^\circ$C,
 $t=4.5$ ms; (b) recoiling stage,
 $T_w=68\,^\circ$C,
 $t=7.75$ ms. The black bar represents a length scale of 1 mm. (c) Dimensionless droplet spreading diameter. (d) Dimensionless droplet centre height when
 $T_w<100\,^\circ$C. The error band represents the standard deviation of three repeated experiments.

When  $T_w$ was 135–190
 $\,^\circ$C, nucleate boiling was observed, and the droplets did not rebound during the first impingement. As shown in figures 9(a,b), many boiling bubbles were formed at the droplet–wall interface, but their growth was slow and did not merge or cause droplet splashing. When
 $T_w=171\,^\circ$C, the bubble formation and the liquid–gas surface oscillation were more violent. This temperature is close to the minimum evaporation time of droplets (168
 $\,^\circ$C). When
 $T_w=190\,^\circ$C, the contact boiling and the induced splashing could be observed (figure 9c).
Boiling phenomena at different  $T_w$: (a) bubble formation,
 $T_w=135\,^\circ$C,
 $t=3.25$ ms; (b) bubble formation,
 $T_w=171\,^\circ$C,
 $t=6$ ms; (c) contact boiling,
 $T_w=190\,^\circ$C,
 $t=10.5$ ms; (d) contact boiling and surface wave propagation,
 $T_w=215\,^\circ$C,
 $t=3.25$–3.75 ms. The black bar represents a length scale of 1 mm.

Figure 10 shows time evolution of dimensionless centre height  $h^*$ for droplets in evaporation and nucleate boiling regimes. In the very early stage of impact (the so-called kinetic phase), the reaction force from the substrate hardly affect the top of the droplet. The height of droplets declines with speed
 $U_0$, so in this stage, centre height can be represented as a simple expression
 $h^*=1-t^*$. The time of the kinetic phase was limited to
 $t^*<0.1$. After droplets start to spread out and reach the spreading phase, the wall effect has to be considered. Roisman et al. (Reference Roisman, Berberovı and Tropea2009) gave an expression
 $h^*=\eta (t^*+\tau )^{-2}$ based on the inviscid remote asymptotic solution (Yarin & Weiss Reference Yarin and Weiss1995). In our experiments of evaporating and boiling droplets, we also found a good fit with
 $h^*=0.23(t^*+0.1)^{-2}$ in the spreading stage of
 $t^*<0.6$. After turning into the recoiling regime, effects of boiling bubbles started to dominate. Frequent contact boiling provided pressure pointing to the inside of the droplet, produced frequent surface waves, and forced the droplet to recoil with a hydrophobic contact angle. As a result, the boiling droplets’ centre rose earlier, and the minimum centre height was larger than droplets in evaporation regimes.
Dimensionless droplet centre height when  $22\,^\circ {\rm C} \le T_w \le 190\,^\circ {\rm C}$; symbols of scatter plots represent droplets reaching minimum height. The black dashed line gives the dimensionless centre height model
 $h^*=\eta (t^*+\tau )^{-2}$ (Roisman et al. Reference Roisman, Berberovı and Tropea2009), with
 $\eta =0.23$,
 $\tau =0.1$. The white square represents a maximum spreading time of a droplet impacting on a room temperature surface from model
 $t_m^*=0.44\,We^{0.3}$ (Liang et al. Reference Liang, Chen, Chen and Shen2019).

When  $T_w$ was 200
 $\,^\circ$C–255
 $\,^\circ$C, boiling caused massive random oscillation at the droplet interface, and all the droplets rebounded after the first impingement. Compared with
 $T_w=190\,^\circ$C, when
 $T_w=215\,^\circ$C, as shown in figure 9(d), the contact boiling and the satellite droplets’ atomization was more violent. The generated surface wave propagated upwards, providing momentum for the droplet rebounding. As the wall temperature is increased further (
 $T_w=296\,^\circ$C–359
 $\,^\circ$C), the surface oscillation starts reducing due to the formation of a vapour layer. Beyond our studied wall temperature range, if the wall temperature is greater than the Leidenfrost temperature
 $T_L$, then the vapour layer beneath the droplet would be completely formed and the dynamic Leidenfrost effect could be observed (Tran et al. Reference Tran, Staat, Prosperetti, Sun and Lohse2012; Shirota et al. Reference Shirota, van Limbeek, Sun, Prosperetti and Lohse2016).
The above analysis on droplet morphology indicates that wall heating's influences on droplet morphology are increasing droplet spreading and oscillation for evaporating droplets, and inducing boiling that caused droplets to rebound for boiling droplets.
3.2. Influence of internal mixing of droplets on the contact time
The measurements of droplets’ internal velocity fields could help us to quantify the influence of wall temperature on droplets’ internal flow and mixing characteristics. The internal velocity and vorticity fields are shown in figure 11 and supplementary material figure S3. Vorticity is defined as  $\omega = \partial v / \partial x - \partial u / \partial y$. For
 $T_w$ above 100
 $\,^\circ$C, bubbles generated from violent nucleate boiling rapidly grow and rise up, inducing intensive mixing inside the droplet. The absolute value of velocity and non-uniformity greatly increased, especially for wall temperatures 190
 $\,^\circ$C–200
 $\,^\circ$C.
Internal velocity and vorticity fields at different wall temperatures in the 12 ms after impingement. The colour bar shows the value of vorticity  $\omega$; the vectors indicate the magnitude and direction of velocity field. A unit vector of 1 m s
 $^{-1}$ is given. The black bar represents a length scale of 1 mm. Measurement results of droplets with a compressed shape in the spreading stage are not used for analysis.

After reaching the contact boiling regime and increasing the wall temperature above 200 $\,^\circ$C, the violent contact boiling could generate a surface wave and facilitate the rebound of droplets (instead of sticking on the substrate). The velocity distribution shown in figure 11 indicates a massive mixing inside a contact boiling droplet. For dynamic Leidenfrost droplets, the internal flow is driven by the recoiling of the droplet surface with a small scale of mixing. Schematic diagrams for droplet morphological phenomena and internal flow patterns of contact boiling and dynamic Leidenfrost droplets are given in figures 12(a,b). It is well known that the vapour layer shown in figure 12(b) makes droplets highly mobile (Graeber et al. Reference Graeber, Regulagadda, Hodel, Küttel, Landolf, Schutzius and Poulikakos2021; Yang et al. Reference Yang, Li, Wang, Fan, Ma, Yu, Guo, Chen, Wang and Deng2023). In contrast, during the contact boiling regime, a partially covered vapour layer is formed (Shirota et al. Reference Shirota, van Limbeek, Sun, Prosperetti and Lohse2016; Castanet et al. Reference Castanet, Caballina, Chaze, Collignon and Lemoine2020), as illustrated in figure 12(a). The droplets maintain contact boiling with the heated substrate, introducing additional internal mixing and dissipation that hinder droplet recoil and rebound. The underlying competition relationship between the vapour layer and the contact boiling requires further quantified descriptions.
Schematic diagrams for (a) a contact boiling droplet and (b) a dynamic Leidenfrost droplet. (c) Relationship between droplet–wall contact time  $t_c$, spreading time
 $t_{max}$ and wall temperature. Red circles with dashed line represent the inertia–capillary limit
 $t_{\sigma }$. (d) Average absolute velocity in the
 $y$ direction,
 $|\bar {v}|$, calculated from velocity fields. The error is estimated with the method described in § 2.3.

Figure 12(c) indicates a uniform time scale  $t_{max}\approx 3.5$ ms for rebounding droplets to reach their maximum spreading; however, the time for droplets to recoil and bounce off the substrate shows a difference with different wall temperature. Typical Leidenfrost droplets’ contact time is dominated by inertia and capillarity, which can be expressed as the inertia–capillary limit (Richard, Clanet & Quéré Reference Richard, Clanet and Quéré2002; Huang, Lo & Lu Reference Huang, Lo and Lu2022)
 \begin{equation} t_{\sigma} = \frac{\rm \pi}{4} \sqrt{\frac{\rho D_0^3}{\sigma}}. \end{equation}
The density  $\rho$ and the dynamic viscosity
 $\mu$ are calculated as temperature-dependent physical properties at the average temperature within the time period from impact to rebound of the droplet. Increasing wall temperature led to a decrease in droplet–wall contact time
 $t_c$ to the theoretical inertia–capillary limit, which suggests that boiling bubbles and violent internal mixing can increase the internal dissipation, reduce the mean upward velocity, and result in a slower rebound, as illustrated in figure 12(d). Previous studies have already proved that viscous dissipation could have a significant influence on the droplet spreading and bouncing dynamics (Wildeman et al. Reference Wildeman, Visser, Sun and Lohse2016; Sanjay, Chantelot & Lohse Reference Sanjay, Chantelot and Lohse2023). To further verify our expectations, we can calculate the local viscous dissipation rate with the direct measurement of velocity distribution:
 \begin{equation} \phi = \mu \left[ 2\left( \frac{\partial u}{\partial x} \right)^2 + 2\left( \frac{\partial v}{\partial y} \right)^2 + \left( \frac{\partial u}{\partial y} + \frac{\partial v}{\partial x} \right)^2 \right]. \end{equation}
Integrating the viscous dissipation rate with element time and volume, we can calculate the overall energy dissipation:
 \begin{equation} E_{\mu} = \int_{0}^{t} \int_{V_d} \phi \,\mathrm{d}V \,\mathrm{d}\tau. \end{equation}
Figure 13(a) gives the dimensionless energy dissipation  $E_{\mu } / E_{k,0}$ in the recoiling stage as a function of dimensionless time
 $t^*$. Here,
 $E_{k,0} = ({{\rm \pi} }/{12}) \rho _l D_0^3 U_0^2$ represents the initial kinetic energy of a droplet. The dissipation rate increases slightly with time. Then we calculate the average dimensionless dissipation rate for each rebounding droplet with different wall temperatures:
 \begin{equation} \bar{\phi}^* = \frac{\phi}{\phi_0}, \quad \phi_0 = \mu \left( \frac{U_0}{D_0} \right)^2, \end{equation}
where  $\phi _0$ represents the characteristic scale of dissipation rate. Figure 13(b) shows the relationship between
 $\bar {\phi }^*$ and wall temperature
 $T_w$, which is consistent with the trend of the declining contact time. To demonstrate the additional effect of wall temperature and the internal mixing induced by boiling, we calculate the increments of contact time with the inertia–capillary limit as
 $\Delta t_c = t_c - t_{\sigma }$. As shown in figure 13(c), the dimensionless dissipation rate shows a good scaling correction
 $\bar {\phi }^* \propto {\Delta t_c^*}^{2/3}$, where
 ${\Delta t_c^*} = \Delta t_c / t_{\sigma }$ is the dimensionless contact time increment.
Analysis of the internal viscous dissipation. (a) Dimensionless overall energy dissipation  $E_{\mu }$ as a function of dimensionless time
 $t^*$. (b) Relationship between average dimensionless dissipation rate
 $\bar {\phi }^*$ and wall temperature
 $T_w$. (c) The correlation between
 $\bar {\phi }^*$ and dimensionless contact time increment
 $\Delta t_c^*$. The best fitting can be expressed as
 $\bar {\phi }^* = 325{\Delta t_c^*}^{2/3}$ (black dashed line).

3.3. Droplet heat transfer characteristics at different wall temperatures
Different wall temperatures will not only affect the droplets’ morphological changes and internal velocity distribution, but also have significant impact on the internal temperature distribution. As mentioned before, boiling phenomena induce the internal mixing, which could influence the heat transfer inside droplets. Direct measurements of internal temperature fields can help us to investigate the influence of wall temperature on microscopic heat transfer processes. The internal temperature fields are shown in figure 14 and supplementary material figure S4.
Internal temperature fields at different wall temperatures in the 12 ms after impingement. The colour bar represents the values of internal temperature  $T$. The hot spots at the liquid–solid interface are marked by red arrows. The black bar represents the length scale of 1 mm. Measurement results of droplets with a compressed shape in the spreading stage are not used for analysis.

With increasing wall temperature, the temperature rise was not monotonic, and different temperature rising modes were observed. When  $T_w=68\,^\circ$C, a high temperature layer region was formed near the wall at
 $t=2$ ms. Fluid with high temperature was carried to the top of the droplet and mixed together after the droplet recoiled. This internal mixing was the result of both wall heating and droplet oscillating motion. When
 $T_w=135\,^\circ$C, a similar internal temperature pattern was observed, but with higher temperature, and the boiling accelerated the internal mixing of fluid with temperature difference. However, when
 $T_w=171\,^\circ$C, which is close to the transition point from the nucleate boiling regime to the contact boiling regime (figure 7), the temperature rising was not as high as for a droplet with
 $T_w=135\,^\circ$C. This phenomenon indicated that the peak of the average evaporation rate occurs at a higher wall temperature than the peak of the droplet temperature rise. Boiling near the substrate increases the evaporation rate, creates lots of bubbles, and increases the thermal resistance. Another change in the heat transfer pattern is that the temperature was more uniform and there was no hot region at the droplet top. Figure 15 shows that the average downward velocity in the spreading stage was lower when
 $T_w=171\,^\circ$C. This suggested that the kinetic energy was consumed by more violent internal mixing induced by boiling. The droplet top had a lower downward speed and could not reach the high temperature region near the substrate.
Average absolute velocity in the  $y$ direction,
 $|\bar {v}|$, in the spreading and rebounding stages for
 $T_w=135\,^\circ$C and 171
 $\,^\circ$C.

When  $T_w=190\,^\circ$C, the hot region near the wall at 2 ms had a spot-like shape. It is worth mentioning that as shown in figure 14 and supplementary material figure S4, a spot-like region near the wall was observed for
 $T_w=190\,^\circ$C–359
 $\,^\circ$C, indicating that these phenomena existed for contact boiling droplets. Figures 16(a,b) show the side and bottom views of droplets impinging on a substrate with
 $T_w = 255\,^\circ$C. Figure 16(a) indicates that the hot spot was formed in the very beginning stage at
 $t = 1.5$ ms, then the high temperature region diffused in both horizontal and vertical directions. The temperature fields acquired from the bottom view in figure 16(b) also show that the hot spot starts from the centre of a droplet, then spreads in each direction of the horizontal plane. Temperature profiles in figures 16(c,d) suggest the spreading of hot spots in the horizontal direction again. The temperature difference between the hottest and coolest points could reach 30
 $\,^\circ$C, which indicates a great non-uniformity in the heat transfer process. After the droplet reached the contact boiling regime, a larger area of vapour film would appear and partially block the heat transfer between droplets and the heated substrate. Droplets preferentially absorbed heat from local areas with small thermal resistance. This non-uniform heat transfer is related to the flow patterns close to the substrate within droplets. After the impact of the cool droplet with the heated substrate, the flow direction changed from the vertical direction to the horizontal direction due to the obstacle effect from the surface, creating a stagnation flow region at the centre of the droplet. These flow patterns can be observed in our velocity measurement results (supplementary material figure S3) and also have been verified by both experimental and numerical results (Wildeman et al. Reference Wildeman, Visser, Sun and Lohse2016; Gultekin et al. Reference Gultekin, Erkan, Colak and Suzuki2020), which are also similar to the basic flow structure underlying the jet impingement cooling process (Martin Reference Martin1977; Chen, Xu & Jiang Reference Chen, Xu and Jiang2021). The stagnation flow region has the highest cooling efficiency on the entire surface, corresponding to the droplet absorbing more heat from the heated substrate at the centre.
(a) Side view and (b) bottom view of the internal temperature fields inside droplets impinging on a substrate with  $T_w = 255\,^\circ$C. The black bars represent a length scale of 1 mm. The colour bars show the value of internal temperature
 $T$. The spot-like region of high temperature is marked with a dashed circle, and the diffusion directions are indicated with arrows. Temperature profiles from (c) side view and (d) bottom view. The time order of the steps is shown by arrows. The original points of horizontal axis
 $x$ and radial axis
 $r$ are settled in the centre points of droplets.

Although the droplet rebounded at  $T_w=200\,^\circ$C but not 190
 $\,^\circ$C, the droplet temperature fields were very similar, indicating that the rebound mechanism was driven not by the temperature difference liquid, but the more violent contact boiling, as described in § 3.1. When
 $T_w=255\,^\circ$C, the droplet temperature rise increased again. As the wall temperature increased to 296
 $\,^\circ$C, the droplet surface vibration was not as violent, and the temperature rise of the droplet was decreased again.
3.4. The scaling law of a boiling droplet absorbing heat
With the usage of droplet internal temperature fields, we can calculate the average temperature of droplets  $\bar {T}_d$, and evaluate the time evolution of droplet temperature rise with different wall temperature. Furthermore, a scaling law is acquired from the heat transfer model and droplet contact diameter curve. The heat flux at the droplet bottom can be estimated using the one-dimensional heat conduction model (Breitenbach, Roisman & Tropea Reference Breitenbach, Roisman and Tropea2017; Castanet et al. Reference Castanet, Chaze, Caballina, Collignon and Lemoine2018)
 \begin{equation} q_l = \frac{\sqrt{5\rho_l C_{p,l} \lambda_l}\,(T_{lv}-T_{d,0})}{\sqrt{{\rm \pi} t}},\end{equation}
where  $T_{lv}$ is the temperature of the droplet bottom interface, which for boiling droplets (
 $T_w>100\,^\circ$C) is close to
 $T_{sat}$ (Liang & Mudawar Reference Liang and Mudawar2017). The corresponding droplet temperature rise could be calculated using the dynamic contact diameter:
 \begin{equation} \bar{T}_d - T_{d,0} = \frac{1}{m C_{p,l}} \int_0^t q_l(\tau)\,\frac{\rm \pi}{4}\,d_c(\tau)^2\, \mathrm{d}\tau ,\end{equation}
where  $m$ is the mass of the droplet. In the kinetic phase (
 $t^*<0.1$) of impacting droplets, the dimensionless contact diameter increased with
 ${t^*}^{0.5}$. However, after reaching the spreading phase, a lamella is ejected, and several parameters, including surface tension, viscosity, droplet diameter and impinging velocity, start to exert an influence (Rioboo, Marengo & Tropea Reference Rioboo, Marengo and Tropea2002; Castanet, Caballina & Lemoine Reference Castanet, Caballina and Lemoine2015). Moreover, boiling bubbles and a vapour film formed between the wall and droplets also have a non-negligible effect on the spreading process in boiling regimes. Here, we tracked the contact diameter of droplets with different wall temperatures from morphology photos. As shown in figure 17(a), dimensionless droplet contact diameter
 $d_c^*=d_c/D_0$ increased, with
 $d_c^* \propto {t^*}^{0.35}$. Then combining with the heat transfer model (3.5) and integral relation (3.6), we can acquire the scaling law of the dimensionless droplet temperature rise:
 \begin{equation} T^* = \frac{\bar{T}_d - T_{d,0}}{T_{sat} - T_{d,0}} = \sqrt{\frac{45}{4{\rm \pi}} \, \frac{\lambda_l}{\rho_l C_{p,l} D_0 U_0}} \int_0^{t^*} {\tau^*}^{{-}0.5}\,d_c^*(\tau^*)^2 \,\mathrm{d}\tau^* \propto {t^*}^{1.2}. \end{equation}
(a) Relationship between dimensionless droplet contact diameter  $d_c^*$ and
 $t^*$. The blue dashed line represents the scaling
 $d_c^* \propto {t^*}^{0.35}$ for boiling droplets. (b) Relationship between dimensionless droplet temperature rise
 $T^*$ and
 $t^*$. The blue dashed line represents the scaling law
 $T^* \propto {t^*}^{1.2}$.

Figure 17(b) shows good agreement of experimental measurements and scaling law  $T^* \propto {t^*}^{1.2}$ for droplets within the contact boiling regime (
 $T_w \ge 171\,^\circ$C). This scaling law was different in previous work by Liu et al. (Reference Liu, Zhang, Cai and Tsai2022), who provided a
 $T^* \propto {t^*}^{1.5}$ scaling law within the spreading stage. Both works applied the one-dimensional heat conduction model, and the difference was caused mainly by our employing different droplet spreading scaling relationships. We used different impact parameters and focused on different droplet boiling regimes (our work considered rebounding droplets within the contact boiling regime; Liu et al. (Reference Liu, Zhang, Cai and Tsai2022) considered sticking droplets, and droplets with splashing and atomization). Thus the different spreading dynamics could be explained.
The droplet impingement heat transfer rate, denoted as  $Q$ and defined in (3.8), is used to quantify the heat absorption during the initial impingement of the droplet on the heated substrate:
 \begin{equation} Q = \frac{mC_{p,l}(\bar{T}_d - T_{d,0})}{\Delta t},\end{equation}
where  $m = \rho _l \, ({{\rm \pi} }/{6})D_0^3$ represents the mass of a droplet, and
 $\Delta t$ represents the time interval. The temperature rise
 $\bar {T}_d - T_{d,0}$ is calculated within
 $\Delta t$. For deposition droplets,
 $\Delta t$ equals a fixed value 20 ms, and for rebounding droplets,
 $\Delta t$ equals
 $t_c$.
When a droplet reaches the contact boiling regime and deposits on the substrate ( $T_w=171\,^\circ$C–200
 $\,^\circ$C), a vapour layer begins to form, blocking the heat transfer from the substrate to the droplet, and leading to a reduction of
 $Q$. When
 $T_w>296\,^\circ$C, the vapour layer almost fully covers the interface between the droplet and the substrate, leaving only a few bubbles inside the droplet caused by contact boiling. The droplet becomes highly mobile and completely rebounds after impingement. The heat transfer rate slightly increases. In this region of wall temperature, the trend of the heat transfer rate curve first decreasing then increasing has already been well studied (Liang & Mudawar Reference Liang and Mudawar2017) and is consistent with the predicted curve in figure 18.
Droplet impingement heat transfer rate  $Q$ (black circles) at different wall temperatures. The black dashed line indicates the trend of heat transfer rate predicted from the droplet lifetime curve (figure 7). Boiling regimes can be separated into evaporation (
 $T_w<100\,^\circ$C), nucleate boiling (
 $T_w=100\,^\circ$C–171
 $\,^\circ$C) and contact boiling regimes (
 $T_w>171\,^\circ$C). The grey dashed lines mark the transition wall temperatures
 $T_w=200\,^\circ$C and 296
 $\,^\circ$C of different droplet impingement outcomes: deposition, partial rebound and complete rebound. The velocity and temperature fields of droplets with typical boiling phenomena are shown in the figure (corresponding to four large symbols in the heat transfer rate curve).

It is noteworthy that a significant increase in  $Q$ is observed for partially rebounding droplets impinging on the substrate with
 $T_w=200\,^\circ$C–296
 $\,^\circ$C, which deviates substantially from the predicted curve (figure 18, marked with a red ellipse). As the wall temperature increases, the expanded covered region of the vapour layer enhances the droplet's mobility. The remaining contact boiling region of the droplet exerts a downward force during the rebounding stage, causing the droplet pinch off and resulting in a partial rebound of the droplet. Contact boiling also increases the instability of the partially covered vapour layer, enhancing droplet interface oscillation, and leading to the penetration of the vapour layer. The frequent contacts between the droplet and the heated substrate bring additional heat absorption (figure 9(e), supplementary material figures S1 and S2). Our findings indicate that despite the vapour layer's obstruction to overall heat transfer capacity, partially rebounding droplets in the contact boiling regime could still exhibit a significantly increased heat transfer rate during the initial impingement process. This implies potential for enhanced heat transfer designs to increase the contact frequency between droplets and the heated substrate.
4. Conclusion
By combining the 2c-PLIF and  $\mathrm {\mu }$PIV technologies, we obtain the quantitative velocity and temperature distributions of the droplet impingement process with high temporal and spatial resolution. With insights into droplet velocity fields, we demonstrate quantitatively that the boiling phenomena could enhance the internal mixing and viscous dissipation, hinders droplet recoiling from maximum spreading, and leads to a slower rebound for droplets within the contact boiling regime. Moreover, the direct temperature field measurements reveal a hot region with a spot-like shape in the spreading stage of droplets. This observation suggests that the thermal resistance beneath the droplet is not uniform. We also discover that the frequent contacts between droplet and the heated substrate can significantly enhance the heat transfer rate during the impinging process, despite the thermal resistance from the vapour layer.
Finally, our experimental methods have the potential to uncover additional detailed flow and heat transfer phenomena, as well as essential mechanisms underlying dynamic Leidenfrost droplets or other fundamental processes in droplet-impacting-based technologies in future works. The availability of simultaneous and resolved velocity and temperature field data, especially for problems involving temperature-gradient-induced flow and non-axisymmetric flow structures (Chen et al. Reference Chen, Zhang, Xu, Ouyang and Jiang2016; Chakraborty, Chubynsky & Sprittles Reference Chakraborty, Chubynsky and Sprittles2022), could greatly benefit the development of advanced numerical simulation or machine learning methods.
Supplementary material
Supplementary material is available at https://doi.org/10.1017/jfm.2024.751.
Acknowledgements
We thank the discussion from National Key Laboratory of Ramjet.
Funding
This work was supported by the National Natural Science Foundation of China (no. U2141250, no. 52225603).
Declaration of interests
The authors report no conflict of interest.
Appendix. Temperature homogeneity of the heated substrate
The temperature homogeneity of the heated substrate was studied using IR imaging. The IR camera was placed above the heated substrate. The heating unit's configuration remained the same as in § 2.1. The silicon substrate was coated with an opaque and emissive black paint in the IR domain, making the emission from the substrate uniform, and reducing the reflection. In figure 19, we measure the temperature distribution of the heated silicon experimental substrate (area  $15 \times 15\ {\rm mm}^2$) with wall temperature
 $T_w = 189\,^\circ$C–282
 $\,^\circ$C. The IR images show that the temperature fluctuation is less than 1
 $\,^\circ$C, which is relatively small compared to the wall temperature. Therefore, the effect of the temperature difference of the steadily heated substrate could be neglected.
Two IR images of the heated substrates with wall temperatures (a)  $T_w = 189\,^\circ$C and (b)
 $T_w = 282\,^\circ$C. The temperature deviations are 0.40
 $\,^\circ$C and 0.95
 $\,^\circ$C, respectively. Distributions of the temperature difference with wall temperatures (c)
 $T_w = 189\,^\circ$C and (d)
 $T_w = 282\,^\circ$C. The black bar represents a length scale of 5 mm. The colour bars show the value of surface temperature distribution
 $T$ for (a,b), and temperature difference distribution
 $T-T_w$ for (c,d).



