I. INTRODUCTION
A resonant Bragg structure (RBS) is a kind of one-dimensional photonic crystal where the periodic perturbation in the dielectric susceptibility is provided by the quasi-2D excitons in a system of quantum wells (QWs). The electro-magnetic coupling of the individual excitons leads to the formation of a superradiant optical mode. Reference Ivchenko, Nesviszhskii and Jorda1 The exciton binding energy and the strength of its coupling with light are the most important physical parameters in this phenomenon. A sufficiently large value of the exciton binding energy is necessary for a stable excitonic state existing at room temperature. Exciton binding energy (exciton Rydberg) is proportional to the electron and hole effective masses and inversely proportional to the squared dielectric constant. It is known that larger band gap materials have larger effective masses and smaller dielectric constant. Therefore, the wide-band-gap III-nitrides should be the materials of choice, if we consider possible applications of such excitonic systems in photonic devices. Reference Chaldyshev, Bolshakov, Zavarin, Sakharov, Lundin, Tsatsulnikov, Yagovkina, Kim and Park2,Reference Bolshakov, Chaldyshev, Zavarin, Sakharov, Lundin, Tsatsulnikov and Yagovkina3
Technological development of GaN-based heterostructures with multiple InGaN QWs faces two major problems. One of them is a significant density of dislocations due to a large difference between the lattice parameters and thermal expansion coefficients of GaN and sapphire substrate. Reference Moram, Oliver, Kappers and Humphreys4 The dislocations affect the excitonic states of interest in many aspects, including inhomogeneous broadening and enhanced nonradiative decay (see, for instance, Ref. Reference Choi, Park, Kim, Song, Lee, Jung and Lee5). The other problem is a phase separation in the InGaN QWs due to a difference between the lattice parameters of InN and GaN and nonequilibrium growth conditions. The phase separation leads to a local variation of the In content in the InGaN QWs, which results in a strong inhomogeneous broadening of the excitonic transitions. Different approaches have been developed to stimulate or suppress the phase separation during deposition of InGaN QWs. Reference Kumar, Park, Lee, Chung, Hong and Suh6–Reference Sun, Choa, Suh, Lee, Choi and Hahn10 Changing the conventional growth parameters such as the In flow or growth temperature modifies the structure and properties of the InGaN QWs. A growth interruption (GI) after the deposition of an InGaN QW Reference Choi, Jang, Yi, Kim and Jung11,Reference Ji, Su, Chang, Tsai, Hung, Chuang, Fang and Tsai12 leads to a transformation of the mostly uniform InGaN QW into separate islands. Annealing after the deposition of an InGaN QW in molecular nitrogen causes a quantum dot formation. Reference Oliver, Briggs, Kappers, Humphreys, Yasin, Rice, Smith and Taylor13 Change in the NH3 flow Reference Wang, Wang, Bai, Cullis, Parbrook and Ranalli14 during the deposition of an InGaN QW and the growth conditions of the GaN layer covering the InGaN QW Reference Wen, Lee and Lee15 affect strongly the phase separation as well. Admixing of hydrogen during the GI after the deposition of an InGaN QW stimulates phase separation while admixing of hydrogen directly during the growth of an InGaN QW suppresses phase separation. Reference Tsatsulnikov, Lundin, Zavarin, Nikolaev, Sakharov, Sizov, Usov, Musikhin and Gerthsen16,Reference Tsatsulnikov, Lundin and Dr. Ameenah Al-Ahmadi17
In this study, we investigated different approaches to grow InGaN QWs, which are suitable to realize a RBS in the near UV range. The goal of our materials research is a high lateral uniformity of the individual QWs and their reproducibility during the growth of a large number of periods.
II. GROWTH AND CHARACTERIZATION TECHNIQUES
All the structures were grown by the metal–organic vapor-phase epitaxy (MOVPE) on GaN-on-sapphire templates with a GaN thickness of 2 micrometers. For all the structures, the epitaxy started by the growth of 700 nm GaN buffer under the following conditions: T = 1030 °C, P = 200 mbar, H2 = 5500 sccm, NH3 = 3050 sccm, and TMGa = 40 µmol/min. After the growth of the buffer layer, the active InGaN/GaN structures were grown with single QWs or multiple QWs (MQWs).
We used electron microscopy (a JEOL JSM-7001F machine, JEOL Ltd. Tokyo, Japan) and x-ray diffraction techniques (a Bruker Discover-D8 diffractometer with a LEPTOS application suit, Bruker AXS, Rheinstetten, Germany) for structural characterization of the samples. An optical characterization was done by an analysis of microphotoluminescence (PL) spectra and mapping of the optical reflection (OR) spectra at different angles of the light incidence with s- and p-polarization.
III. STRUCTURES WITH SINGLE InGaN QWs
Before the growth experiments with the MQW structures, the epitaxial process was optimized for structures with a single QW. Optimization of the technological process was performed in a way of creation of the InGaN QW with a uniform composition in the lateral directions, i.e., the goal was a suppression of the InN–GaN phase separation as much as possible. Several variations in the technology have been examined, as described below in this section.
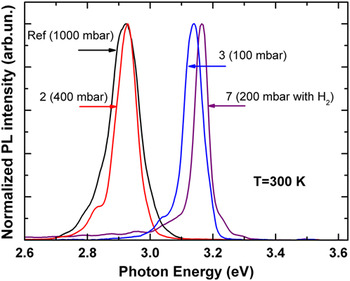
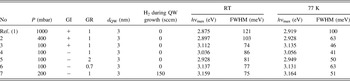
The active region of the reference structure (sample 1) was grown in a following manner: after a buffer layer, a 8 nm thick GaN barrier was grown (growth temperature T gr = 920 °С, growth pressure P = 1000 mbar, nitrogen flow N2 = 4500 sccm, ammonia flow NH3 = 6250 sccm, and trimethylgallium flow TMGa = 20 µmol/min); after that a 3 nm thick InGaN QW was grown (T gr = 780 °C, P = 1000 mbar, N2 = 4500 sccm, NH3 = 6250 sccm, TMGa = 3.8 µmol/min, and TMIn = 10 µmol/min) with a GI with admixing hydrogen for 16 s and a subsequent overgrowth by 2 nm thick low-temperature GaN cap layer; after that 8 nm thick GaN barrier was grown at increased growth temperature (T gr = 920 °C); and finally, 50 nm thick high-temperature GaN layer was deposited (T gr = 1030 °C, P = 200 mbar, H2 = 5500 sccm, NH3 = 3050 sccm, and TMGa = 40 µmol/min). Figure 1 shows the PL spectrum from this structure. The PL spectrum contains a single line with a maximum at 2.875 eV (430 nm) and a full-width at half-maximum (FWHM) of 120 meV at 300 K. At 77 K, these values are 100 meV and 2.919 eV, respectively.
PL spectra measured at 77 K from the reference structure and structures 2, 3, and 7 grown under different pressures.

Several approaches to narrowing the emission line were investigated. To reveal an effect of the reactor pressure during the deposition of the active region on the FWHM, a set of samples containing single InGaN QWs was grown at different pressures. The InGaN QW thickness and composition (growth time and all flows) were constant, while only the reactor pressure was changed from 100 to 1000 mbar. The PL spectra recorded at 77 K from several samples are shown in Fig. 1. Table I summarizes the PL peak positions and FWHM values for the whole set of samples measured at 300 and 77 K.
Growth parameters (P-pressure, GI-growth interruptions, GR – growth rate, H2 – hydrogen flow), thickness of the QW (dQW ) and optical properties [peak position (hν max) and FWHM at room temperature (RT) and T=77K] of the investigated samples.

As can be seen from the table data, reduction of the pressure (P) leads to a strong decrease in the FWHM. It means better uniformity of the QW in respect of both the composition and thickness. At the same time, the shift of the emission peak energy indicates that the In incorporation into QWs lowers with decrease in pressure.
It was shown previously Reference Tsatsulnikov, Lundin, Zavarin, Nikolaev, Sakharov, Sizov, Usov, Musikhin and Gerthsen16 that the admixing of hydrogen during a GI can stimulate the phase separation in the InGaN QWs, which increases the FWHM of the emission line. Therefore, samples 4, 5, 6, and 7 were grown without GI after deposition of the InGaN QWs. A comparison of the parameters of PL emission from sample 4 (grown without GI) and sample 3 (grown with GI) reveals a small blue shift of the emission from sample 3 that seems to originate from a decrease in the In content during the GI due to evaporation of In atoms. The smallest FWHM is observed for sample 4 when measured at low temperature, but it appears to be larger at room temperature. The lower FWHM at low temperature demonstrates better uniformity in the In distribution in In-rich areas of the well, where the nonequilibrium electrons and holes are collected after relaxation. Reference Petrosyan, Chaldyshev and Shik18
Another possibility to affect the lateral fluctuation of In distribution in a QW was examined via changes in the growth rate (GR) for the QW from the previously found optimal value (samples 1–4). The GR was varied for samples 5 and 6 to be compared to sample 4 (see Table I). We observe desirable narrowing of the emission line at low temperature neither with higher nor with lower GR.
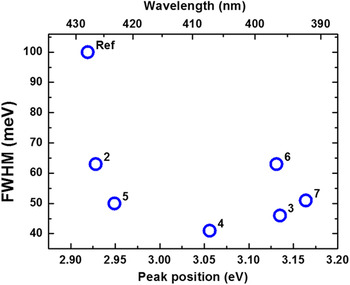
The described above samples were grown at a pressure of 100 mbar, which seems to be optimal for the InGaN QWs. The MOVPE technology should also be optimized for GaN barriers between QWs having thickness about 80 nm in desired MQW structures. Optimal conditions for the GaN growth are: T gr = 1030 °C, P = 200 mbar, H2 = 5500 sccm, NH3 = 3050 sccm, and TMGa = 40 µmol/min. If GaN and InGaN are grown at the different pressures, changing the pressure from GaN to InGaN and back is a complex task for a MQW structure with a large number of periods. It should be avoided if possible. Analysis of the experimental data in Table I shows that an increase in the pressure to 200 mbar might be acceptable for InGaN QW growth making certain impact on the FWHM of the PL line. It was shown previously Reference Tsatsulnikov, Lundin, Zavarin, Nikolaev, Sakharov, Sizov, Usov, Musikhin and Gerthsen16 that admixing of hydrogen during the deposition of InGaN suppresses the phase separation in an InGaN QW. We grew a QW under a pressure of 200 mbar with an admixing of 150 sccm H2 during the InGaN growth (sample 7). It is seen (Fig. 2) that this structure demonstrates a reasonable FWHM for the observed peak position.
FWHM versus peak energies of the PL lines measured at 77 K for samples 1–7.

IV. MQW STRUCTURES
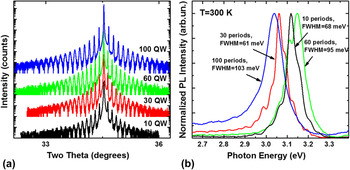
Growth regimes of the MQW structures were the same with ones for sample 7. Structures with 10 periods, 30 periods, 60 periods, and 100 periods were grown. The period of the InGaN/GaN MQW structure was 81 nm. Samples were grown without rotation of substrate during growth to realize a reasonable nonuniformity in the thicknesses of layers in the structures. This allows us to find several points on the sample surfaces having matched peak energy of the QW exciton emission and Bragg reflection. X-ray diffraction curves for the structures with different number of periods are shown in Fig. 3(a). The well-developed multiple diffraction pattern evidences a high quality and planarity of the interfaces and a very good uniformity of the geometrical parameters along the lateral and growth directions. Coincidence of the diffraction pattern for the samples with different number of periods indicates reproducibility of the structure parameters in different epitaxial processes.
X-ray diffraction curves (a) and PL spectra (b) of the MQW structures with different numbers of periods.

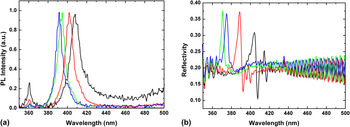
PL spectra from the MQW samples [Fig. 3(b)] show an increase in the FWHM from 61 to 103 meV with the increase in the number of periods from 10 to 100. As well, there is a noticeable shift of the QW exciton emission peak. The shift depends on the actual position of the excitation spot. Figure 4 shows the PL and OR spectra recorded at different points along one direction on the surface of the sample with 100 QWs. The distance between points at which the measurements were performed was approximately 5 mm. The OR spectra were measured at normal light incidence. One can see a variation in the spectral position of the Bragg OR peak within a range from 370 to 405 nm and a variation in the spectral position of the QW exciton PL peak within a range from 390 to 410 nm. It is important that the two ranges overlap, so that the double resonance conditions can be arranged by tuning the Bragg peak, which depends on the angle of the light incidence in accord with the Bragg's law:
 $${\lambda _{{\rm{Br}}}} = 2d\sqrt {\varepsilon - {{\sin }^2}\theta } \quad ,$$
where d is the period of the structure, ε is the dielectric permittivity, and θ is the angle of the light incidence.
PL spectra (a) and OR spectra (b) recorded at different points of the MQW structures with 100 periods.

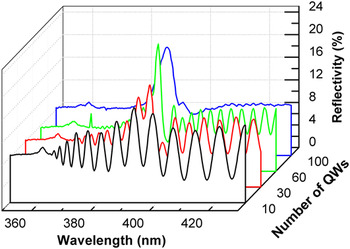
Figure 5 shows typical OR spectra from periodic MQW structures with different numbers of InGaN QWs. The spectra were recorded for p-polarized light incident at the angle of 45°. The spectra from structures with 60 and 100 QWs were measured at points of the sample surfaces, which were different from those in Figs. 4(b) and 6. The shape of a reflected light spot on the sample surfaces was roughly an ellipse. It was revealed that decreasing the size of the minor axis of this ellipse to values less than 0.5 mm does not lead to the exposure of any additional spectral features, so the spectra were measured with this size being equal to approximately 0.5–1 mm. The size of the major axis of the ellipse increased correspondingly to the increase in the angle of the light incidence. A small feature at 361 nm relates to the fundamental absorption edge of GaN. In the region of larger wave lengths, Fabry–Pérot oscillations emerge due to the interference of electromagnetic waves reflected from the front (air–GaN) and the back (GaN–sapphire) boundaries of the epitaxial structure. The period of these oscillations becomes shorter with the increase in the thickness of the epitaxial film, i.e., with the increase in the number of periods in MQW. The Bragg reflection appears as a background band. A difference in the refractive indices of GaN and InGaN layers is rather small, Reference Sanford, Munkholm, Krames, Shapiro, Levin, Davydov, Sayan, Wielunski and Madey19,Reference Leung, Djurisic and Li20 moreover, InGaN QWs are very thin, so the Bragg feature in the OR spectrum from 10 QW structures appears as a small perturbation of the Fabry–Pérot oscillations. Increasing number of QWs leads to more distinct Bragg peaks. However, in the 100 QW structure, nonuniform broadening effects seemingly become significant.
OR spectra from the MQW structures with different numbers of QWs. The angle of the light incidence is 45°, p-polarization.

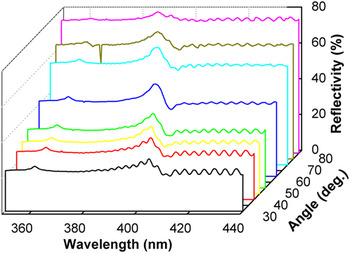
OR spectra at different incident angles from the sample with 60 QWs, s-polarization.

In Fig. 5, we select the OR spectra from the points of the samples, where the Bragg resonance occurs near 390 nm. Note that the QW exciton resonance is not visible in the OR spectra as any pronounced separate feature.
Figure 6 shows OR spectra from the structure with 60 QWs at different angles of light incidence. The Bragg peak moves toward smaller wave lengths by increasing the angle of incidence in concordance with the Bragg's law. One can see that the Bragg peak increases in magnitude when passing a wave length range 390–395 nm. The maximum of a PL spectrum of this point occurs just at 395 nm. Similar behavior has also been revealed in another point of this sample, suggesting that the Bragg peak enhancement is caused by the collective action of QW excitons situated in a Bragg sequence. Reference Chaldyshev, Bolshakov, Zavarin, Sakharov, Lundin, Tsatsulnikov, Yagovkina, Kim and Park2
V. DISCUSSION AND CONCLUSIONS
So, we successfully realized RBS MQW structures on the base of III-nitrides. We observe a resonant enhancement in the OR at room temperature, which is a very important advantage of this material system over the system of III-arsenides previously used for the growth of RBS. Reference Hayes, Staehli, Oesterle, Deveaud, Phillips and Ciuti21–Reference Chaldyshev, Kundelev, Nikitina, Egorov and Gorbatsevich24 The observation of this effect at the room temperature becomes possible due to the large exciton binding energy in InGaN QWs with GaN barriers compared to InGaAs/GaAs and GaAs/AlGaAs systems.
The requirement of a good quality and uniformity of III-N epitaxial layers was met with the developed technology. This technological effort is opposite to the formation of InGaN QWs for light-emitting diode applications, where the creation of In-rich areas suppresses carrier transport in plane of the QW toward defects, decreasing the nonradiative recombination. In the case of RBS, the limitation of the lateral electron transport is not important. Then, the additional potential fluctuations lead to a decrease in density of states and inhomogeneous broadening of the excitonic transitions. As a result of such broadening, the exciton coupling becomes weaker and the superradiant mode may be destroyed even if the double resonance conditions are met.
The strength of the superradiant mode increases with the number of QWs in the Bragg sequence. However, the simultaneous increase in the destructive broadening is documented by PL spectra in Fig. 3(b) for the samples with larger number of QWs. Then, for the available crystalline quality, there may be a compromise between these two factors. In our case, the strongest enhancement of resonant OR was achieved in RBS with 60 periods.
ACKNOWLEDGMENTS
This work was supported by Ministry of Science and Education of Russia (agreement No. 02.G25.31.0014) and by the Russian Foundation for Basic Research (Grant No. 14-29-07243). The x-ray study was carried out by Joint Research Center “Material science and characterization in advanced technology” under financial support of the Ministry of Education and Science of the Russian Federation.