


Introduction
Numerical models of the evolution of the Earth’s ice sheets rely on accurate representations of the basal regime and englacial structure (e.g. Reference MacAyealMacAyeal, 1989; Reference Walker, Christianson, Parizek, Anandakrishnan and AlleyWalker and others, 2012). Active seismic methods in glacierized regions are emerging as the most effective means of capturing these important subsurface properties; the data provide modelers with the information necessary to determine how the current state of the system influences ice dynamics and allows them to predict how the subglacial environment and overlying ice will affect the evolution of the system in a changing climate. Seismic imaging presents two key advantages over other geophysical methods (in particular, over ice-penetrating radar and other electrical and magnetic methods): (1) a complete image of the subglacial environment, in terms of its morphology, water content, thickness and spatial extent (e.g. Reference Blankenship, Bentley, Rooney and AlleyBlankenship and others, 1987; Reference SmithSmith, 1997, Reference Smith2007; Reference Peters, Anandakrishnan, Alley and SmithPeters and others, 2007, Reference Peters, Anandakrishnan, Holland, Horgan, Blankenship and Voigt2008) and (2) englacial observations of crystal orientation fabric (Reference Blankenship and BentleyBlankenship and Bentley, 1987; Reference HorganHorgan and others, 2008, Reference Horgan, Anandakrishnan, Alley, Burket and Peters2011) and temperature (Reference Peters, Anandakrishnan, Alley and VoigtPeters and others, 2012).
Active seismic exploration in glacierized regions involves deploying a spread of receivers (geophones, or here, ‘georods’) and initiating a source in order to record reflections from within and below the glacier; these data are used to generate an image or model of the subsurface in the region. A seismic source, such as an explosive charge, hammer, vibroseis or similar device, is initiated at or near the surface, and the resultant seismic waves propagate through the subsurface. The receiver spread then records detectable signals from all subsurface interfaces over a range of source-to-receiver distances (known as ‘offsets’). The variation in arrival time, magnitude and phase of a given reflection with changes in offset allows us to map subsurface structure, topography and basal morphology (e.g. Reference Peters, Anandakrishnan, Alley and SmithPeters and others, 2007; Reference PetersPeters, 2009). Variations in the seismic velocity of a given englacial or ice-bottom reflection are generally related to the crystal orientation fabric of the ice (Reference Blankenship and BentleyBlankenship and Bentley, 1987; Reference Horgan, Anandakrishnan, Alley, Burket and PetersHorgan and others, 2011), and the rate of change of frequency with offset along that reflector is related to attenuation (which can be used to infer temperature) (Reference Peters, Anandakrishnan, Alley and VoigtPeters and others, 2012).
Optimizing seismic data quality depends on three key field parameters during the acquisition process: (1) reducing external noise sources, (2) improving receiver coupling and (3) improving source coupling. External noise sources include wind, blowing snow, power generators and movement or vibration on the surface. The geophone spread is always placed near the surface in active seismic acquisition, and therefore wind and blowing snow are the most significant and uncontrolled noise sources; thus, seismic acquisition is generally limited to periods when wind is at a minimum. Improved receiver coupling can be achieved by burying the geophones deeper within the firn, where the firn is higher-density and less porous, or by increasing the surface area of the geophone, so that the geophone is sensitive to a larger part of the seismic wavefront. Burying the geophones more than 50–75cm below the surface would greatly slow the deployment and retrieval of the receivers during acquisition; therefore, in this work we focus on increasing the effective surface area. Source coupling is best achieved by placing the source near or below the firn/ice transition; this allows more energy release into the ice itself and avoids the trapping of seismic energy within the firn (Reference AlbertAlbert, 1998). Of course, this is limited by the type of source used, as a hammer or vibroseis can only be utilized at the surface, whereas explosives can be detonated at depth within the firn and ice column.
Here we present a novel geophone receiver technology, the ‘georod’, that has been developed and built at Pennsylvania State University. These sensors improve signal quality significantly, while saving time and effort during acquisition. This achievement over the conventional geophone is achieved by using multiple geophone elements per sensor (vs one in traditional geophones) and a larger geophone body. These are optimized for glacial settings (in particular, cold polar conditions, where surface firn is extensive). The design allows rapid insertion into the firn and extremely rapid (nearly instantaneous) and safe retrieval, making it far easier to use in the field than conventional geophones. Finally, the data acquired with the georods are 20–30 dB higher in amplitude and demonstrate a larger bandwidth for all test cases when compared with conventional geophones.
‘Georod’ Description
The design of the georod addresses two key goals in active seismic acquisition: (1) improved signal quality of the targeted subsurface signals and (2) more rapid deployment and retrieval of the geophones during acquisition. Typical conditions in glacierized regions require that the geophone is deployed near the surface within the firn, because the large number of geophones and their frequent rearrangement do not allow us to dig or bore deep holes. Experience has shown that conditions must be appropriate (low wind speeds, no blowing snow, no cultural noise) in order to record high-quality data with conventional geophones. We have been able to improve the signal quality by using a larger geophone body (while reducing deployment time) and by using multiple geophone elements.
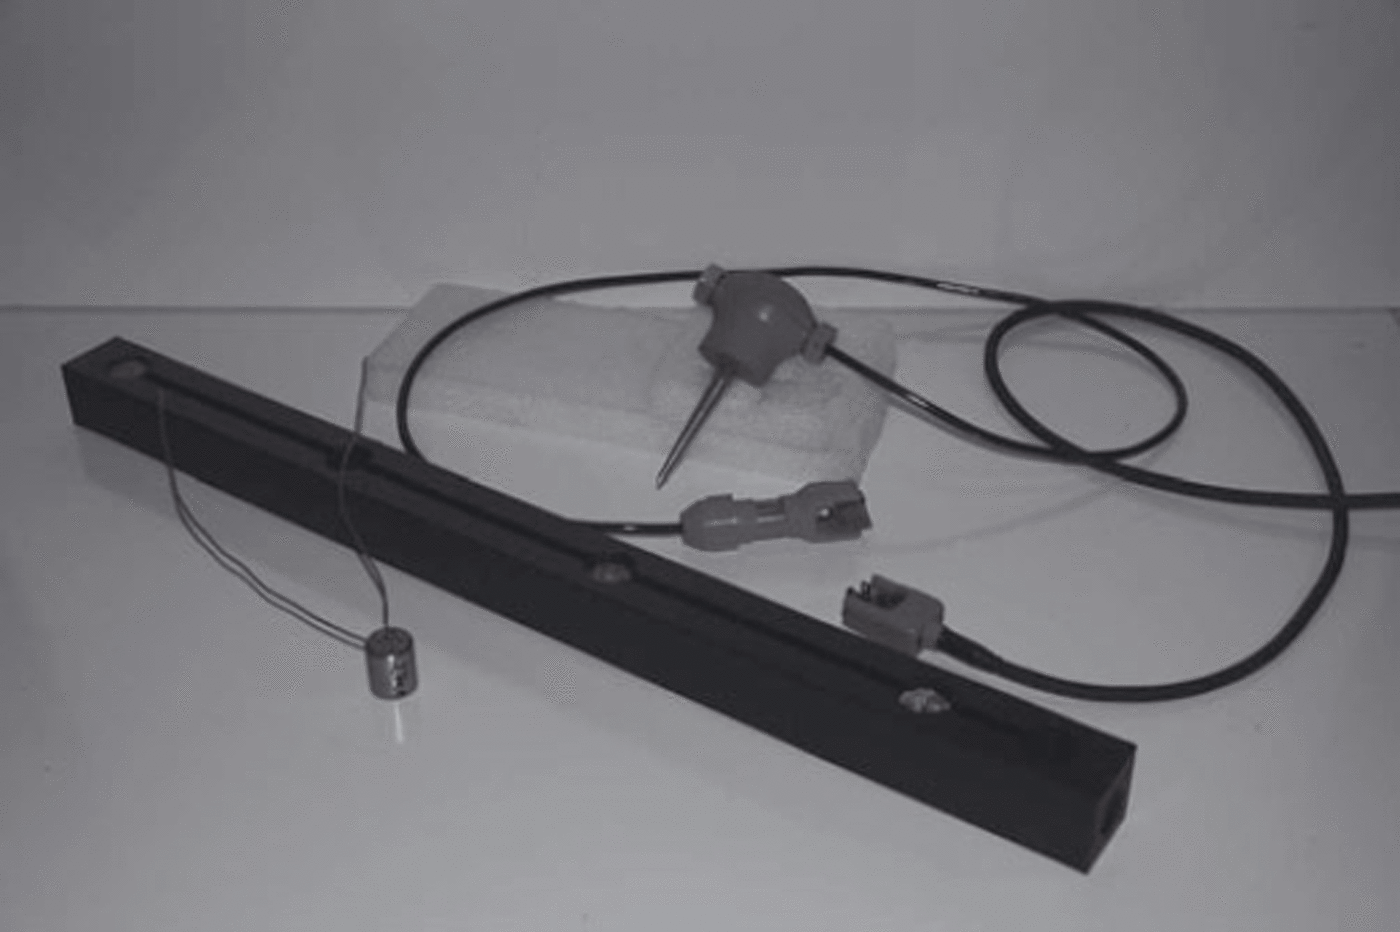
The georod body is made of acrylonitrile butadiene styrene (ABS) plastic that is 3 cm square and 61 cm long. ABS plastic was chosen for its impact resistance, lightweight nature and strength in the cold. Four 40 Hz elements (Geospace LP, DM-20, 40 Hz natural frequency, 60% open circuit damping) are wired in series so their signals sum coherently. The four elements are epoxied in wells milled perpendicular to the long axis of the rod and are 16.5 cm apart (Fig. 1 ; contact the lead author for further details and sketches of the georod construction). A 1 m long 16-AWG (American Wiring Gauge), two-conductor neoprene-jacketed cable is used to connect the geophones to the digital-acquisition hardware. A critical feature of the georod is robust strain relief at the junction of the cable and georod body. This was a point of failure in early designs, following multiple deployments and retrievals; a wire mesh cable-grip was devised to protect this connection, while allowing for flexibility in deployment.
A georod prior to epoxying the geophone elements into the wells, along with a conventional 28 Hz geophone. A 40 Hz geophone element (left) is inserted into each of the wells within the georod body and connected in series. Both the georods and conventional geophones are fitted with split-plate connectors for coupling to the seismic cable.
Data Acquisition
In practice, the georods are placed horizontally in 20 cm deep trenches with the geophone elements oriented vertically for compressional-wave (P-wave) data acquisition, or horizontally for shear-wave (S-wave) acquisition. For the SV orientation (particle motion in the plane that contains the source and receiver), the georod main axis would be perpendicular to that plane, so that the geophone elements are aligned with the particle motions. For SH acquisition (particle motion perpendicular to the plane containing the source and receiver), the georod main axis would be in that plane.
Once the georods are in place, they can be quickly leveled (this is done visually, without leveling instruments) because seismic waves are insensitive to a significant degree of tilt (up to 10°). The trench is then filled with loose snow that is packed around the georods to improve coupling. After the source detonation, the georod is quickly removed by grasping a rope loop tied through a hole bored in the georod and pulling sharply upwards. This breaks the sintered surfaces and allows the georod to be pulled out quickly. By contrast, buried conventional geophones have to be dug up by hand, and care has to be taken to not slice the cable with the shovel. This can take anywhere from 30 s to 2-3 min, depending on the degree of sintering and depth of burial.
In December 2009, multichannel seismic reflection data were collected along Thwaites Glacier, West Antarctica, to image the subglacial environment and relate these observations to observed ice dynamics (Fig. 2). A receiver spread of 48 geophones was used during the data acquisition, with a geophone spacing of 20 m. Alternating georods and conventional 28 Hz geophones were deployed along the spread for signal comparison between the two types of geophones. According to the specifications from the manufacturer (Geospace LP, DM-20, 28 Hz natural frequency, 42% open circuit damping), the 28 Hz geophones are ∼30% more sensitive than the 40 Hz elements. The quoted bandwidth of the two is comparable, with a slightly better low-frequency response for the 28 Hz geophones.
Map showing where the georods have been used in the field across West Antarctica. The black circle marks where the data presented in this study were acquired, along Thwaites Glacier. The black diamonds highlight other recent field sites at the South Pole (Reference Peters, Anandakrishnan, Holland, Horgan, Blankenship and VoigtPeters and others, 2008) and along Whillans Ice Stream (Reference HorganHorgan and others, 2012). Georods have also been used along Jakobshavn Isbræ, West Greenland, with a primary focus on englacial reflectivity (Reference HorganHorgan and others, 2008; Reference Peters, Anandakrishnan, Alley and VoigtPeters and others, 2012).

In a given receiver spread, four separate explosive charges, ranging from 175 to 400g, were detonated in shot holes. Depths for the shots ranged from the near-surface to 96 m depth. These shots were backfilled with snow and allowed to sinter for a day or more, so that the shot coupled well with the surrounding firn or ice, and energy release up the borehole and into the atmosphere was minimized. Shots were detonated at +1920, +960, 0 and –960 m from the center of the 940 m receiver spread during each shooting sequence. Half the receiver spread was ‘leapfrogged’ to the front (wherein the 24 geophones that were at the back of the spread were placed at the front), the shooting sequence was repeated, and so forth, during the seismic data acquisition, resulting in the collection of fourfold seismic data.
The georods were positioned in a vertical element orientation to record P-waves, with each georod buried perpendicular to the length of the receiver spread at ∼20 cm depth. Four-second long records were collected to record both the ice bottom and ice-bottom multiple, with a sampling frequency of 4000 Hz (giving a Nyquist frequency of 2000 Hz).
Comparison with Conventional Geophones
The alternating arrangement of georods and 28 Hz geophones for each shooting sequence provides the ideal means of comparing the signal quality for these two types of sensors. We assume that because of this alternating placement, on average a neighboring geophone and georod are observing the same wave field, with any differences in signal levels due to the sensors. The example shot gathers presented in Figure 3 illustrate the distinct differences between the georods (black) and conventional geophones (gray), both in signal strength and quality.
Shot gathers for case I (windy, blowing snow conditions) and case III (deep source at 75.0 m depth). Georod signals are shown in black, and conventional geophone signals are shown in gray; here the conventional geophone signals have been amplified threefold. For the case III scenario, the ice bottom is observed at ∼1.15 s at 500 m source-to-receiver offset; an englacial reflection is observed at ∼1.03 s at 500 m source-to-receiver offset. An englacial reflection is weakly observed by the georods in case I.

These data are analyzed in both time and frequency domains to compare signal strength, peak frequency and bandwidth. In order for a seismic signal to be detected, the signal must be sufficiently above the background noise levels. The peak frequency and bandwidth of the signal are critical components in delineating subsurface structure because the higher the bandwidth, the better the resolving ability of the wavelet. Following Reference RickerRicker (1953), a subsurface layer can be detected down to 1/4 of a wavelength, A, where A = VP/f (V P is the compressional-wave velocity of the layer and f is the peak frequency of the wavelet). If the wavelets defining the upper and lower bounds of the layer are separated by > λ/4, this layer can be seismically detected; as such, the ability to observe wavelets that possess higher frequencies will lead to improved vertical resolution.
Five test cases are presented for comparison of the georod data quality with that of the conventional geophones: (I) wind (blowing snow), (II) sintered (geophones left in place for 12 hours prior to acquisition), (III) deep source (75.0 m depth), (IV) mid-firn source (40.0 m depth) and (V) surface source (0.5 m depth). A 500 m section of a 940 m shot gather is analyzed for each case (shot gathers for cases I and III are shown in Fig. 3); the details of each case are presented in Table 1.
Details of the source and receiver parameters for the test cases

Time domain
Comparison of the georod and conventional geophone signals in the time domain consists of determining how well the ice-bottom reflection and any englacial reflections are detected by the two geophone types. The striking improvement in signal levels from the georods is apparent, as the ice bottom is present in all five cases (e.g. see Fig. 3 for cases I and III). The ice-bottom amplitudes are up to ten times larger than those from the conventional geophones, and englacial reflectors are also more readily observable with the georods in comparison with the conventional geophones.
More seismic energy and resultant signals are also observed below the ice-bottom reflections with the georods, thereby providing greater detail on subglacial structure, in comparison with the conventional geophones. The more compact signal wavelets observed with the georods point to higher peak frequencies being captured, and the ability to resolve subglacial layer thicknesses more finely.
Frequency domain
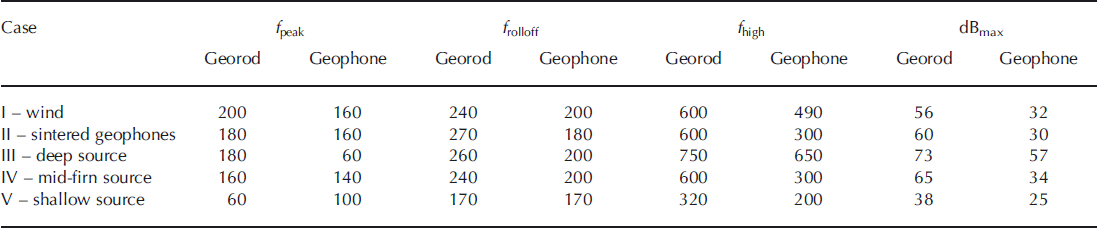
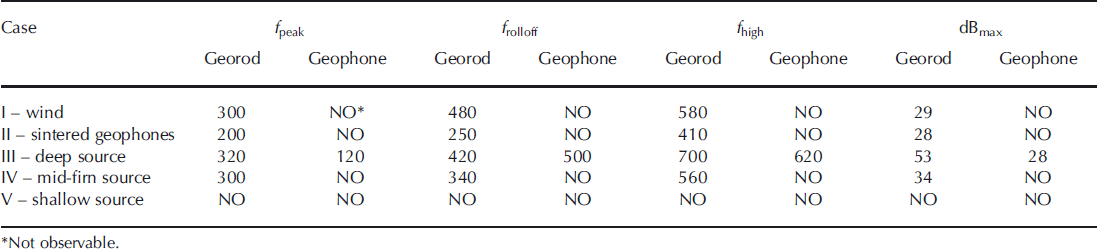
Frequency spectra of the ice-bottom reflection for each case, along with any englacial reflectors that were observed in the time domain, are calculated to determine the frequency content of the observed signals for both the georod and conventional geophone. The frequency spectra are derived from 50 ms time windows of the seismic data, centered on the target wavelet, and averaged over a 500m source-to-receiver offset range; the background noise level is derived from a 50 ms time window of the quietest part of the dataset, generally taken above the direct arrival signal. In each instance, the calculated frequency spectrum is the average of 13 georods (or conventional geophones), to dampen any spurious signal due to poor coupling or a noisy geophone. The key observations here are that the georod signals exhibit a 20–30 dB enhancement, higher peak frequencies are observed, and wider frequency bandwidths are captured in all five cases (Figs 4 and 5; Tables 2 and 3).
Frequency spectra of the ice-bottom reflector for all five cases presented. The georod spectra are shown in black and the conventional geophone spectra in gray; the labeling scheme for the five cases is given in the legend. Relative signal power is given on the vertical axis, where 0 dB represents the background noise level of each frequency spectrum; frequency is given on the horizontal axis. Details of the observations in the frequency domain for all cases are given in Table 2. Each presented frequency spectrum is the average spectrum from 13 georods (black) or conventional geophones (gray), to dampen any spurious signal due to poor coupling or a noisy geophone.

Frequency spectra of an englacial reflector for cases I–IV (no englacial reflectivity is discernible in the shallow-source case for either the georods or conventional geophones). The georod spectra are shown in black and the conventional geophone spectra are in gray; the labeling scheme for the four cases is given in the legend. Relative signal power is given on the vertical axis, where 0 dB represents the background noise level of each frequency spectrum; frequency is given on the horizontal axis. Details of the observations in the frequency domain for all cases are given in Table 3. Each presented frequency spectrum is the average spectrum from 13 georods (black) or conventional geophones (gray), to dampen any spurious signal due to poor coupling or a noisy geophone.

Details of the frequency content of the ice-bottom reflection for the test cases: f peak is the peak frequency observed in the spectrum; f rolloff is the frequency at which the power is consistently at least 10 dB below f peak; f high is the maximum frequency where the power is at least 10 dB above the noise; dBmax is the relative power of f peak
Details of the frequency content of an englacial reflector for the test cases: f peak is the peak frequency observed in the spectrum; f rolloff is the frequency at which the power is consistently at least 10 dB below f peak; f high is the maximum frequency where the power is at least 10 dB above the noise; dBmax is the relative power of f peak
Discussion
A 20-30dB improvement in signal is equivalent to a 102 - 103 increase in observed signal energy above background noise, as observed when comparing the georod data with conventional geophone data (Figs 4 and 5). The signal improvement from increasing the number of elements is likely to scale as E x N (because the data are summed coherently), where E is the signal energy observed by an individual element and N = 4, the number of elements present in the georods (note that noise would only increase as
 because it will sum incoherently). The surface area of a georod is ∼20 times that of the conventional geophone, with each element benefiting independently from that increase in surface area. Such a marked improvement in signal quality exhibits the true potential of employing georods as the geophone of choice for active seismic acquisition in glacierized regions.
The greatest advantages of using the georods over conventional geophones arise during windy, blowing snow weather conditions, when seismic sources are shallow or near the surface, or when detecting englacial reflectivity is a primary target. In all these cases, the noise levels increase as
 where signal increases by a factor of four. Over the course of a day in the field, weather conditions can rapidly deteriorate from calm and sunny to windy and snowing; thus, tremendous degradation in data quality and the potential loss of target signal can occur during acquisition. Results from Case I show that a clear ice-bottom reflection and weak englacial reflection (56 and 29 dB above background, respectively) can be detected by the georods, in comparison to a noisy ice-bottom return (32 dB above background noise) and no observable englacial returns from the conventional geophones.
A shallow or surface seismic source means that the seismic energy from the surface must propagate downward through the highly attenuative firn, reflect off any englacial and subglacial interfaces and then propagate back through the firn, before being recorded by the near-surface geophones. The firn often traps seismic energy and can lead to greater dissipation of the original source energy in comparison to a source detonated near or below the firn/ice transition (Reference Clarke, Burkholder, Smithson, Bentley and RicciClarke and others, 1997; Reference AlbertAlbert, 1998); this increased energy loss near the surface dictates the need for capturing more reflected seismic energy, which the georods provide (38 dB ice-bottom reflection vs 25 dB).
The remaining three cases (sintered geophones and deeper sources) also show that the georods exhibit a 20-30 dB improvement in signal quality and a broader frequency bandwidth in comparison with the conventional geophones; in each of these cases, the sintering and/or deeper sources also greatly improve the signal quality of the conventional geophones in comparison with the wind and shallow cases, highlighting the importance of deeper sources and calmer wind conditions. Again, the key improvement with the georods is the ability to capture higher-frequency signals from the ice-bottom and englacial reflectors, as this increased frequency content will lead to better vertical resolution of the subglacial environment. According to Reference RickerRicker (1953), for a subglacial sedimentary bed with a compressional-wave velocity of V P = 2000 ms–1, an enhancement in observable peak frequency from 60 to 180 Hz (as we observe in case III) leads to the ability to discern a 2.8 m basal layer with the georods vs an 8.3 m basal layer with the conventional geophones; such improvements are critical in accurately characterizing the subglacial environment and modeling basal processes.
The georods exhibit tremendous enhancements in capturing englacial reflectivity compared with conventional geophones (Figs 4 and 5). The georods detect englacial reflections in all cases, except case V when the source is near the surface. The detection of these englacial reflectors depicts a change in the seismic properties of the ice itself, which is primarily due to variations in crystal orientation fabric (Reference Blankenship and BentleyBlankenship and Bentley, 1987; Reference HorganHorgan and others, 2008, Reference Horgan, Anandakrishnan, Alley, Burket and Peters2011). Higher peak frequencies and broader frequency bandwidths are also observed; the latter is a critical component in estimating englacial temperature from englacial seismic signals (Reference Peters, Anandakrishnan, Alley and VoigtPeters and others, 2012).
We suggest that the more important effect in enhancing seismic signal quality is the larger effective surface area of the georod relative to a single geophone case. Whereas conventional geophones have a simple casing and spike that sense the wavefront of the propagating wave, each element of the georod senses the same wavefront with the larger surface area of the georod body; we suggest that the enhanced seismic energy detection (up to 30 dB greater than the conventional geophones) is due to the increased surface area used by each geophone element. In non-polar settings, the long form-factor would be a liability because the uneven surface (e.g. pebbles, gravel, soil inhomogeneities) would decrease the area of contact. However, there is no such penalty in polar environments, as the georod can be positioned, leveled and buried within the shallow firn with ease and quickly sinters into the firn to form good coupling.
It should be noted that these observations are in no way meant to imply that conventional single-element geophones will not detect the ice-bottom or englacial reflections in glacierized regions; the point here is to demonstrate that the georods consistently exhibit a 20–30dB improvement in signal quality over the conventional geophones for all the cases presented. Previous authors have had success with detecting englacial and subglacial reflectors using shallow seismic sources and simple geophone spreads, as much of the pioneering active seismic exploration across Antarctica had limited logistical capabilities (e.g. Reference Robin Robin, 1958; Reference Bentley and CraryBentley, 1971). Various environmental conditions can impact the observed signal quality, including the thickness of ice through which the seismic imaging is occurring, the thickness and velocity structure of the firn and the seismic properties of the subglacial bed.
Summary
Georods present the potential to greatly improve seismic imaging in glacierized regions. The ability to enhance the signal quality of the ice-bottom and englacial reflectors by >20 dB will lead to improved imaging of the subglacial environment and better constraints on the physical properties of the ice and basal regime. Their long, slender design allows for rapid deployment and retrieval during seismic acquisition. These georods also have the advantage that they are able to detect englacial and subglacial targets in unfavorable conditions, such as blowing snow, or when logistical constraints require the use of a shallow source. These major improvements in our seismic imaging capabilities will enhance our ability to elucidate the key subsurface structures that are critical to ice-sheet modelers in predicting the evolution and fate of the Earth’s ice sheets.
Acknowledgements
We thank the US National Science Foundation (NSF OPP 063198 and 0424589) for financial support. We thank Raytheon Polar Services, the Air National Guard, Ken Borek Air and Ice Coring and Drilling Services for their logistical support in conducting the fieldwork in West Antarctica; we also thank R. Boon, K. Christianson, M. Jayred, J. Koehler, R. Ward and L. Zoet for assistance in the seismic data acquisition. We thank The Pennsylvania State University’s Engineering Shop Services for machining the georod bodies, and L. and K. Voigt for construction of the georods. This work was conducted under the auspices of the Center for Remote Sensing of Ice Sheets (CReSIS). We also thank B. Hubbard and two anonymous reviewers for comments which improved the manuscript.



