Iranian ultrafiltrated (UF) white cheese has the highest selling rate compared with other types of cheese in Iran. It is manufactured by using UF-treated and pasteurised bovine milk with mesophilic starter cultures and commercial recombinant chymosin in modern dairy plants (Hesari et al. Reference Hesari, Ehsani, Khosroshahi and McSweeney2006). In addition to increasing cheese yield because of retention of whey proteins in the curd, there are some advantages such as saving in starter culture, rennet, energy and time in manufacturing of cheese by ultrafiltration technique (Al-Otaibi & Wilbey, Reference Al-Otaibi and Wilbey2005; Benfeldt, Reference Benfeldt2006).
Ultrafiltration provides a method for concentration of milk before the formation and handling of the curd and prevention of whey removal during cheese manufacture (Mistry & Maubios, Reference Mistry, Maubios and Fox1993). In addition to having more fat and protein contents in cheese, the moisture content of UF cheeses are higher than those of cheeses manufactured by conventional methods due to the high concentration of whey proteins and high water holding capacity (Karami et al. Reference Karami, Ehsani, Mousavi, Rezaei and Safari2009). However, high concentration of whey proteins may cause inhibition of chymosin, altered ripening and flavour development in UF-cheeses compared with conventional cheeses (Benfeldt, Reference Benfeldt2006).
Salt is a common additive used in the food industry and has a significant role in improving some characteristics of foods (Lvova et al. Reference Lvova, Denis, Barra, Mielle, Salles, Vergoignan, Di Natale, Paolesse, Temple-Boyer and Feron2012). In this context, the addition of salt to the cheese during the manufacturing process is applied in order to (i): improve flavour, texture and colour of the cheese, (ii): restrict the acid development in the cheese by control of the metabolism of microorganisms and (iii): increase the shelf-life by reducting the water activity and inhibiting the germination of microbial spores (Kaya, Reference Kaya2002; El-Bakry et al. Reference El-Bakry, Beninaty, Duggan, O'Riordan and O'Sullivan2011; Rolikowska et al. Reference Rolikowska, Kilcawley, Doolan, Alonso-Gomez, Nongonierma, Hannon and Wilkinson2013). Also, it was reported that the salt caused some changes in rheological and functional properties of cheese. The amounts of free oil, apparent viscosity, meltability and expressible serum are affected by the amount of salt added to cheese matrix (Rowney et al. Reference Rowney, Roupas, Hickey and Everett2004; Boisard et al. Reference Boisard, Andriot, Martin, Septier, Boissard, Salles and Guichard2014).
The important role of salt in regulation of blood pressure, transmission of nerve cell impulse and transportation of water in and out of cells has been confirmed (Al-Otaibi & Wilbey, Reference Al-Otaibi and Wilbey2006). However, high consumption of salt may cause some diseases such as hypertension and cardiovascular problems in human (Campbell et al. Reference Campbell, Correa-Rotter, Neal and Cappuccio2011; Boisard et al. Reference Boisard, Andriot, Martin, Septier, Boissard, Salles and Guichard2014). Previous studies showed that the average daily salt consumption is higher than the recommended levels of 5–6 g NaCl per day for a healthy diet (He & Mac Gregor, Reference He and Mac Gregor2009).Therefore, the importance of reduction in salt which human can be achieved by decreasing of use of salt during food processing is emphasised by health authorities (Lvova et al. Reference Lvova, Denis, Barra, Mielle, Salles, Vergoignan, Di Natale, Paolesse, Temple-Boyer and Feron2012).
Because of the effect on composition, microflora, protein hydration and enzymatic activity, some quality characteristics of cheese may be affected by salt concentration (Kilcast & Angus, Reference Kilcast and Angus2007). In Iran, the salt concentration applied in dairy plants for production of UF-white cheese is about 3% (Hesari et al. Reference Hesari, Ehsani, Khosroshahi and McSweeney2006; Zomorodi et al. Reference Zomorodi, Khosrowshahi Asl, Razavi Rohani and Miraghaei2011). On the other hand, according to the Institute of Standard and Industrial Researches of Iran (ISIRI), the maximum rate of salt that could be added to cheese during the manufacturing should not be more than 4% (w/w) (ISIRI, 2002). In this context, the objective of this study was to investigate the influence of low (salt free, 0%) and high (4%) levels of salt on the quality characteristics of Iranian white cheese manufactured by UF-treated milk. So, in addition to cheese production with 4% (w/w) of salt which is the highest recommendable level according to the Iranian legislations, cheeses were manufactured with the various concentrations of salt for comparison. Cheeses manufactured with the above levels of salt were tested for their gross chemical composition, proteolysis including urea-polyacrylamide gel electrophoresis of caseins and non-caseins, RP-HPLCs of peptides, total number of lactic acid bacteria and sensory characteristics during 90 d of ripening.
Materials and methods
Milk, starter culture and chymosin
Raw cows’ milk and cheese production equipment were provided by Damaneh Sahand Co. (Tabriz, Iran). Mesophilic homofermentative starter culture containing Lactococcus lactis spp. lactis and Lactococcus lactis spp. cremoris were obtained from Danisco Deutschland GmbH (Alemanha, Germany). A recombinant chymosin from Rhizomucor miehei (Fromase® 2200 TL Granualte, its strength was ≥2200 international milk clotting units/g) was used as the chymosin obtained from DSM Food Specialties, Seclin, Cedex, France. All chemicals and standards used in chemical and chromatographic analyses were obtained from Merck (Darmstadt, Germany) or Sigma-Aldrich (St. Louis, USA).
Cheese manufacture
Experimental cheese samples at four different levels of salt were manufactured at three replicates on separate days in Damaneh Sahand dairy plant (Tabriz, Iran) according to UF cheese production method as introduced by Tetra-Pack incorporation (Bylund, Reference Bylund1995). This method was adapted by Hesari et al. (Reference Hesari, Ehsani, Khosroshahi and McSweeney2006). Raw cow's milk was standardised at 3% fat after pre-heat treatment (45–48 °C). After bactofugation in two steps, pasteurisation (76 °C, for 15 s) and ultrafiltration (52 ± 1 °C, 140 kPa) were applied to milk. The membrane of ultrafiltration unit (spiral wound type 6338, SPIRA-CEL®-Modules from MICRODYN-NADIR GmbH, Germany) contained three modules with a total surface area of 427 m2. The inlet and outlet pressure of ultrafiltration unit were about 520–540 and 140–160 kPa respectively. The time needed for passing milk through the three modules in order to complete the ultrafiltration process was 900 s. After ultrafiltration process, 1·0 kg retentate was obtained from 5·1 kg milk. The retentate was pasteurised (78 °C for 60 s) and homogenised (at 5 MPa) and then sent to starter tanks for mixing with starter culture at a rate of 20 g per 1000 kg retentate. The retentate with pH of 6·5–6·6 was pumped to the filler machine and mixed with rennet solution at the rate of 30 g per 1000 kg. The mixture then immediately filled into containers (100 g) and left to coagulate at 35 °C for 20 min in coagulation tunnel. Next, a parchment paper was placed on the top of coagulum [cube with a weight of 100 g and dimensions (mm) of 80 × 50 × 25 l × w × h] and different dry salt concentrations (0, 1, 2·5 and 4%) were sprayed on the parchment paper. The containers were then sealed with aluminium foil. Cheeses produced were coded according to the amount of salt added to them; A(free of salt), B(1%), C(2·5%) and D (4%). The cheese samples were first held at 26 ± 1 °C for 24 h and then transferred to a cold room (9 ± 1 °C) and ripened for 90 d. Sampling of cheeses produced for analysis was implemented in 1, 15, 45 and 90 d of ripening.
Gross chemical composition
Cheese samples were analysed in duplicate from three batches for moisture by the oven drying method at 102 °C (International Dairy Federation (IDF), 1982), fat by the Van Gulik method (Ardo & Polychroniadou, Reference Ardo and Polychroniadou1999) and the total nitrogen by the micro-Kjeldahl method as described in IDF (1993). Salt contents were determined according to the procedure described by Bradley et al. (Reference Bradley, Arnold, Barbano, Semerad, Smith, Vines and Marshall1993). For pH measurement, 10 g sample were diluted in 10 ml distilled water and the pH of the resultant slurry was measured using a digital pH meter (testo® 230, Testo, GmbH & Co, Germany).
Proteolysis
Water–soluble nitrogen (WSN) and 12% trichloroacetic acid soluble nitrogen (TCA–SN) fractions as % of total nitrogen of the cheeses were determined by the methods described by Hayaloglu et al. (Reference Hayaloglu, Guven, Fox and McSweeney2005). The WSN and TCA–SN were expressed as % of TN. Total free amino acid (FAA) levels in the pH 4·6–soluble fraction of the cheeses were determined by the Cd–ninhydrin method described in Hayaloglu (Reference Hayaloglu2007).
The water-insoluble fractions of the cheeses were freeze-dried and then analysed by urea-polyacrylamide gel electrophoresis (urea-PAGE) using Protean II XI vertical slab gel unit (Bio-Rad Laboratories Ltd., Watford, UK) according to the method of Andrews (Reference Andrews1983). The gels were stained directly according to the method of Blakesley & Boezi (Reference Blakesley and Boezi1977) with Coomassie Brilliant Blue G-250. After destaining using pure water, gel slabs were digitised using a scanner (HP ScanJet software, ScanJet G4010, Hewlett Packard, Palo Alto, CA). Scans of the electrophoretograms were used to quantify bands using densitometric software (Image Master Total Lab Phoretix 1D Pro software, Keel House, Newcastle upon Tyne, UK). The caseins and peptides were determined quantitatively by integration of peak volumes using the densitometer. The WSN fractions of the cheeses were also freeze-dried and analysed by reversed-phase high performance liquid chromatography (RP-HPLC). The multi-variable statistical analysis of the peak heights obtained from RP-HPLC was implemented by using Principal Component Analysis (PCA) (Hayaloglu et al. Reference Hayaloglu, Guven, Fox and McSweeney2005, Reference Hayaloglu, Topcu, Koca, Hayaloglu and Ozer2011).
Total number of lactic acid bacteria (LAB)
The method as described by Harrigan (Reference Harrigan1998) was used for counting total number of LAB in the cheeses. For this purpose, 10 g of each cheese sample was weighed and dispersed in 90 ml citrate buffer (2%, w/v) in a sterile conical flask and then homogenised with a blender (model T10 Basic, Ultra-Turrax IKA, Staufen, Germany) for 1 min. 0·1% sterile peptone water was used for preparation of serial dilutions. The enumeration of total number of LAB in the cheeses was performed using MRS Agar (Merck GmbH, Darmstadt, Germany) after incubation at 30 °C for 48 h in anaerobic conditions considering catalase negative colonies. All determinations were made in duplicate.
Sensory analysis
The cheese samples were evaluated after 1, 15, 45 and 90 d of ripening by seven expert panel familiar with UF-cheeses from the Laboratory of Milk and Dairy Products at Çukurova University. Cheeses were evaluated for colour and appearance (scale 0–5), body and texture including firmness and springiness (scale 0–5) and odour and flavour including creamy and sweaty properties for odour and saltiness, acidity and bitterness for flavour (scale 0–10) by using an evaluation form. Moreover, the sum of sensory scores given to cheeses by panellists during ripening was presented as total score (Clark & Costello, Reference Clark, Costello, Clark, Costello, Drake and Bodyfelt2009).
For sensory evaluation, the coded cheese samples were removed from the cold room about half an hour before evaluation and kept at room temperature. About 100 g cheese was presented to each member. Water was also provided to the panellists for rinsing their mouths between samples (Hayaloglu et al. Reference Hayaloglu, Guven, Fox and McSweeney2005).
Statistical analysis
The data obtained from three trials were analysed statistically using the analysis of variance (ANOVA) of SPSS program (SPSS package program, version 16.0, SPSS Inc., USA). Different groups were statistically determined by Duncan's multiple range tests. Analysis was performed for 1, 15, 45 and 90 d of ripening. The obtained results were considered significant at α = 0·05 or α = 0·01.
Results and discussions
The mean DM (%), fat (%), protein (%), pH and titratable acidity (as % of lactic acid) values of milk used in all three trials of cheese production were 12·44 ± 0·22, 3·10 ± 0·01, 3·21 ± 0·06, 6·63 ± 0·01 and 0·15 ± 0·01, respectively. These values were normal for cow's milk as reported by various workers (Madadlou et al. Reference Madadlou, Khosroshahi and Mousavi2005; Khosrowshahi et al. Reference Khosrowshahi, Madadlou, Ebrahim zadah Mousavi and Emam-Djomeh2006).
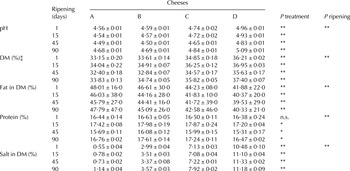
The gross chemical composition of Iranian UF white cheeses during ripening are given in Table 1. Significant differences in gross composition of cheeses manufactured with different concentrations of salt during ripening were observed (P < 0·05). The pH values of the cheeses increased with increasing salt concentration. Prasad & Alvarez (Reference Prasad and Alvarez1999) have reported that the higher salt concentrations tends to produce a cheese having a higher pH. Increasing salt concentration may cause an increase in pH of cheese due to the restriction of the starter culture metabolism and acidification (Hystead et al. Reference Hystead, Diez-Gonzalez and Schoenfuss2013). On the other hand, utilisation of lactic acid, formation of non-acidic decomposition products and liberation of alkaline products (like NH3) during hydrolysis of protein have a significant role in the increasing of pH values of experimental cheeses towards the end of ripening (McSweeney & Fox, Reference McSweeney, Fox and Fox1993; Awad, Reference Awad2006).
The chemical composition of Iranian UF White cheeses manufactured with addition different concentrations of salt [salt-free (A), 1% (B), 2·5% (C) and 4% (D)] after 1, 15, 45 and 90 d of ripening†

† Values are shown as mean ± sd of three separate samples from three batches
‡ DM: Dry Matter, Fat-in-DM and Salt-in-DM were chosen according to ISIRI
n.s.: non-significant, *: P < 0·05, **: P < 0·01
The dry matter (DM) contents of the cheeses were significantly (P < 0·01) influenced by salt concentration. At the first day of ripening, with increase in salt concentration from 0% (salt free) to 1, 2·5 and 4%, the DM of cheeses increased by 0·46, 1·6 and 3·06 units, respectively. At the end of ripening, increase in the DM in cheeses B, C and D compare with cheese A was determined 0·91, 1·99 and 3·57 units, respectively. Previous workers reported that the DM content of UF white brined cheese and traditional Feta cheese also increased during storage possibly because of loss of moisture into the out of cheese matrix (Katsiari et al. Reference Katsiari, Voutsinas, Alichanidis and Roussis1997). Osmotic pressure difference between the cheese moisture and the brine is caused by movement salt ions from the brine into the cheese and then diffusion out of the moisture through the cheese matrix in order to restore osmotic pressure equilibrium (Guinee, Reference Guinee2004). The significant differences (P < 0·01) between cheeses were noticeable in terms of fat in DM. These changes were also observed in the cheeses during ripening. Changes in fat in DM contents during ripening were observed in parallel with changes in DM contents of cheeses due to the moisture loss (Al-Otaibi & Wilbey, Reference Al-Otaibi and Wilbey2004, Reference Al-Otaibi and Wilbey2005; Hayaloglu et al. Reference Hayaloglu, Guven, Fox and McSweeney2005). Because of the direct effect of salt on the DM (Prasad & Alvarez, Reference Prasad and Alvarez1999), increasing the salt concentration in experimental cheeses had an important role in reduction of fat in DM contents of cheeses.
Although no significant differences were seen at the first day, significantly but not substantial changes were observed in protein contents of the cheeses especially at the end of the ripening (P < 0·05). Fluctuations were observed in protein contents of the cheeses during ripening. These changes may be related to drainage of the cheeses and further losses may be attributed to proteolysis and diffusion of water-soluble nitrogen into brine (Prasad & Alvarez, Reference Prasad and Alvarez1999; Al-Otaibi & Wilbey, Reference Al-Otaibi and Wilbey2004; Guven et al. Reference Guven, Yerlikaya and Hayaloglu2006) and water holding characteristics of some compounds formed during ripening (Hayaloglu et al. Reference Hayaloglu, Guven and Fox2002, Reference Hayaloglu, Guven, Fox and McSweeney2005).
The major differences in salt in DM contents were observed in cheeses by adding different concentrations of salt. On the other hand, significant changes (P < 0·01) were observed in salt in DM contents of each cheese during ripening that were in line with the changes of DM in cheeses during ripening. These changes were parallel with salt addition to the cheese curd. Salt contents in experimental cheeses increased during ripening because of diffusion of salt from the surfaces into the centre (Akin et al. Reference Akin, Aydemir, Kocak and Yildiz2003). During salting procedure, first, the salt on the top of cheese is changed to soluble form because of the presence of moisture. Then salt penetrates the cheese and moves to the interior of the product by diffusion between salt and water molecules. Parchment paper provides a more uniform distribution of sodium chloride in UF White cheese (Hardy, Reference Hardy and Eck1986; Guinee & Fox, Reference Guinee, Fox, Fox, Mc Sweeney, Cogan and Guinee2004).
The diffusion of salt is impeded by the casein matrix due to its narrow pores. However, high salt content may cause a rapid loss of water and shrinkage, resulting in decreased porosity of the structure of the casein matrix. Consequently, the narrowed pores of the casein matrix impede the movement of salt and water (Guven et al. Reference Guven, Yerlikaya and Hayaloglu2006). The relation between added salt and salt in DM contents of various cheese types and their DM and moisture content has been reported (Kaya, Reference Kaya2002; Al-Otaibi & Wilbey, Reference Al-Otaibi and Wilbey2004; Hayaloglu et al. Reference Hayaloglu, Guven, Fox and McSweeney2005).
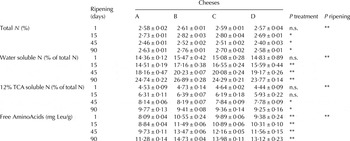
Proteolysis in experimental cheeses expressed as WSN (as % of TN), TCA-SN (as % of TN) and FAA during ripening are given in Table 2. It was observed that salt had a significant (P < 0·01) and inhibitory effect on the WSN content in cheeses produced. The rate of WSN being inversely proportional to salt concentration of the salted cheeses which is in line with the results reported by Al-Otaibi & Wilbey (Reference Al-Otaibi and Wilbey2004). The concentration of WSN increased significantly (P < 0·01) in all cheeses during ripening. Due to proteolytic activity of starter bacteria, the level of WSN was highest at 90 d of ripening (Hayaloglu et al. Reference Hayaloglu, Guven, Fox and McSweeney2005; Hayaloglu, Reference Hayaloglu2007).
Soluble nitrogen fractions and total free amino acids in Iranian UF white cheeses manufactured with addition different concentrations of salt [salt-free (A), 1% (B), 2·5% (C) and 4% (D)] after 1, 15, 45 and 90 d of ripening†

† Values are shown as mean ± sd of three separate samples from three batches
n.s.: non-significant, *: P < 0·05, **: P < 0·01
The values of TCA-SN in experimental cheeses were significantly (P < 0·05) influenced by salt in DM levels and ripening time. Higher Salt in DM levels leads to lower TCA-SN values, as cheese D with highest salt in DM level had the least amount of TCA-SN among salted cheeses. These results are in agreement with the results reported by Al-Otaibi & Wilbey (Reference Al-Otaibi and Wilbey2004, Reference Al-Otaibi and Wilbey2005). Furtado & Partridge (Reference Furtado and Partridge1988) reported that short-chain peptides, amino-acids, ammonia and other minor compounds that are soluble in 12% TCA-SN formed by bacterial catabolism, whereas chymosin is responsible for production of large peptides from casein which is soluble in water or pH 4·6 buffer.
The FAA values of cheeses were significantly (P < 0·01) affected by the salt in DM content of the cheeses during ripening. As in WSN and TCA-SN, the FAA values of cheeses decreased with increasing levels of salt concentration. The final products of proteolysis are free amino acids and their concentration in cheese at any stage of ripening time is the net result of the liberation of amino acids from casein. Catabolism of free amino acids can result in a number of sapid compounds, including ammonia, amines, aldehydes, phenols, indole and alcohols (Sousa et al. Reference Sousa, Ardo and McSweeney2001).
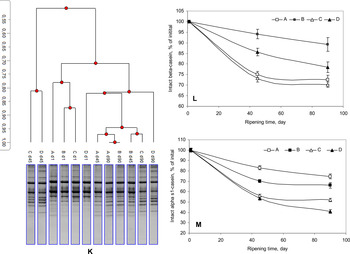
Urea-PAGE electrophoretograms (as dendrogram) of the water-insoluble fraction of experimental cheeses after 1, 45 and 90 d of ripening are shown in Fig. 1K. Chymosin and plasmin are responsible for the primary proteolysis of casein in cheese. They are the two main proteolytic agents that have hydrolytic effect on αs1-CN and β-CN (Hannon et al. Reference Hannon, Sousa, Lillevang, Sepulchre, Bockelmann and McSweeney2004). In this study, some noticeable differences were detected in urea-PAGE patterns among four types of UF-cheese. No significant differences were seen between electrophoretograms at the beginning of ripening. However, hydrolysis of the caseins was accelerated especially after 45 d of ripening. It was possible to see the hydrolysis product of αs1-CN including αs1-CN (f102-199) and αs1-CN (f24-199) in all cheeses. Breakdown of αs1-CN and the formation of its degradation products also increased with increasing cheese age and salt concentrations (Fig. 1K). Interestingly, increasing salt did not negatively influence the breakdown of αs1-CN in the cheeses; the hydrolysis of αs1-CN increased with increasing the levels of salt. As shown in Fig. 1M, the hydrolysis of αs1-CN in cheese D was higher than that in other cheeses. The residual αs1-CN in cheese D after 45 and 90 d of ripening was 53 and 40%, respectively (Fig. 1M). It was reported that the high salt concentration and low pH lead to decrease in the degradation of β-CN by the coagulant and plasmin, while the hydrolysis of αs1-CN was not inhibited by higher salt content (Alichanidis et al. Reference Alichanidis, Anifantakis, Polychroniadou and Nanou1984). On the other hand, the hydrolysis of β-CN in the cheeses A & C was higher than the cheeses B & D after 45 and 90 d of ripening (Fig. 1L); no relationship was observed between β-CN and salt level. The hydrolysis of β-CN in cheese C was higher than that in other cheeses. The residual β -CN in cheese C after 45 and 90 d of ripening was 72 and 70%, respectively. The hydrolysis of β-CN and αs1-CN increased during ripening in all cheeses (Fig. 1L, M) and age-related changes were observed in all cheeses. These results are in agreement with the results reported by Al-Otaibi & Wilbey (Reference Al-Otaibi and Wilbey2005) and Hesari et al. (Reference Hesari, Ehsani, Khosroshahi and McSweeney2006).
Dendrogram (K) of urea-PAGE electrophoretograms and degradation profiles of intact β- (L) and αs1-caseins (M) of water-insoluble fractions of Iranian UF White cheeses manufactured with addition different concentrations of salt [salt-free (A), 1% (B), 2·5% (C) and 4% (D)] after 1, 45 and 90 d of ripening.

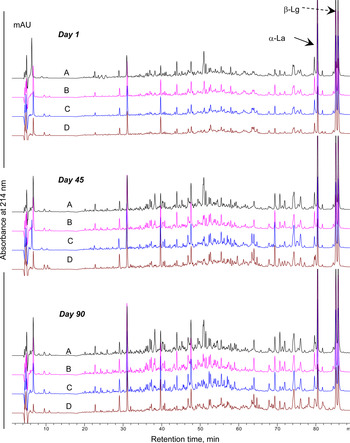
RP-HPLC peptide profiles of the water-soluble fractions of the cheeses after 1, 45 and 90 d are shown in Fig. 2. Hydrophilic peptides were mainly eluted earlier than hydrophobic peptides in the RP-HPLC chromatograms (Hesari et al. Reference Hesari, Ehsani, Khosroshahi and McSweeney2006). Elution of small peptides and free amino acids occurs between 10–40 min retention time (Engels & Visser, Reference Engels and Visser1994). As shown in Fig. 2, no major differences were observed between the peptide profiles of experimental cheeses at early elution time (5–20 min). As ripening progressed, the main differences between peptide profiles of cheeses were present in the region of the chromatogram with retention time of 30–60 min. The concentration of peptides eluting in this region were decreased with increasing salt concentration which is in agreement with results reported by Al-Otaibi & Wilbey (Reference Al-Otaibi and Wilbey2005). Hydrophobic and high molecular mass peptides along with whey proteins are observed in the portion of the chromatogram with retention time of 70–100 min (Hayaloglu et al. Reference Hayaloglu, Topcu, Koca, Hayaloglu and Ozer2011). It was observed that the peaks eluting at 81 and 86 min corresponded to α-lactalbumin and β-lactoglobulin, respectively that is similar to results reported by Hesari et al. (Reference Hesari, Ehsani, Khosroshahi and McSweeney2006). These two proteins were confirmed by injection of their standard compounds under the same chromatographic conditions.
Reversed phase-HPLC peptides profiles from Iranian UF White cheeses manufactured with addition different concentrations of salt [salt-free (A), 1% (B), 2·5% (C) and 4% (D)] after 1, 45 and 90 d of ripening. Straight and dashed arrows show β-lactoglubulin (β-lg) and α-lactalbumin (α-la).

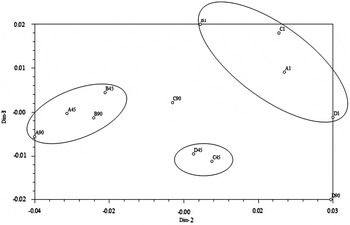
Results of principal component analysis of peak heights obtained from RP-HPLC analysis of water-soluble fractions confirmed the differences between the experimental cheeses. As shown in Fig. 3, all cheeses located on the positive side at the first stage of ripening (1st day). As the ripening proceeded, the location of cheeses was changed and tended to negative side. In accordance with the chromatographic data shown in Fig. 2, salt concentration had a significant effect on the peptides. It was observed that because of the inhibition effect of salt on the peptides, cheese D had lower concentrations for peaks eluting with retention time of 30–60 min than the other cheeses.
Principal Component Analysis of peak heights obtained from RP-HPLC analysis of water-soluble fractions of Iranian UF White cheeses manufactured with addition different concentrations of salt [salt-free (A), 1% (B), 2·5% (C) and 4% (D)] after 1, 45 and 90 d of ripening.

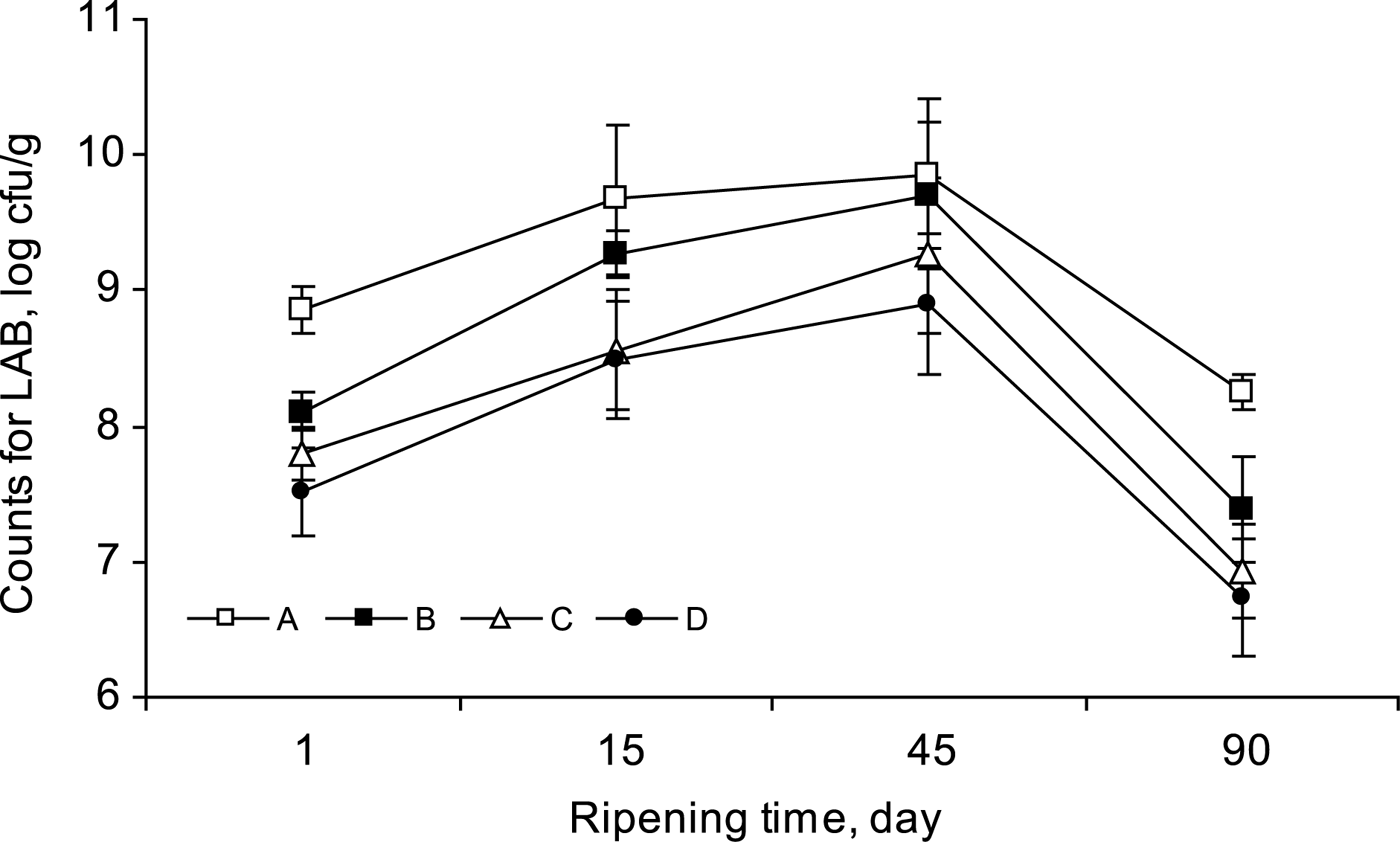
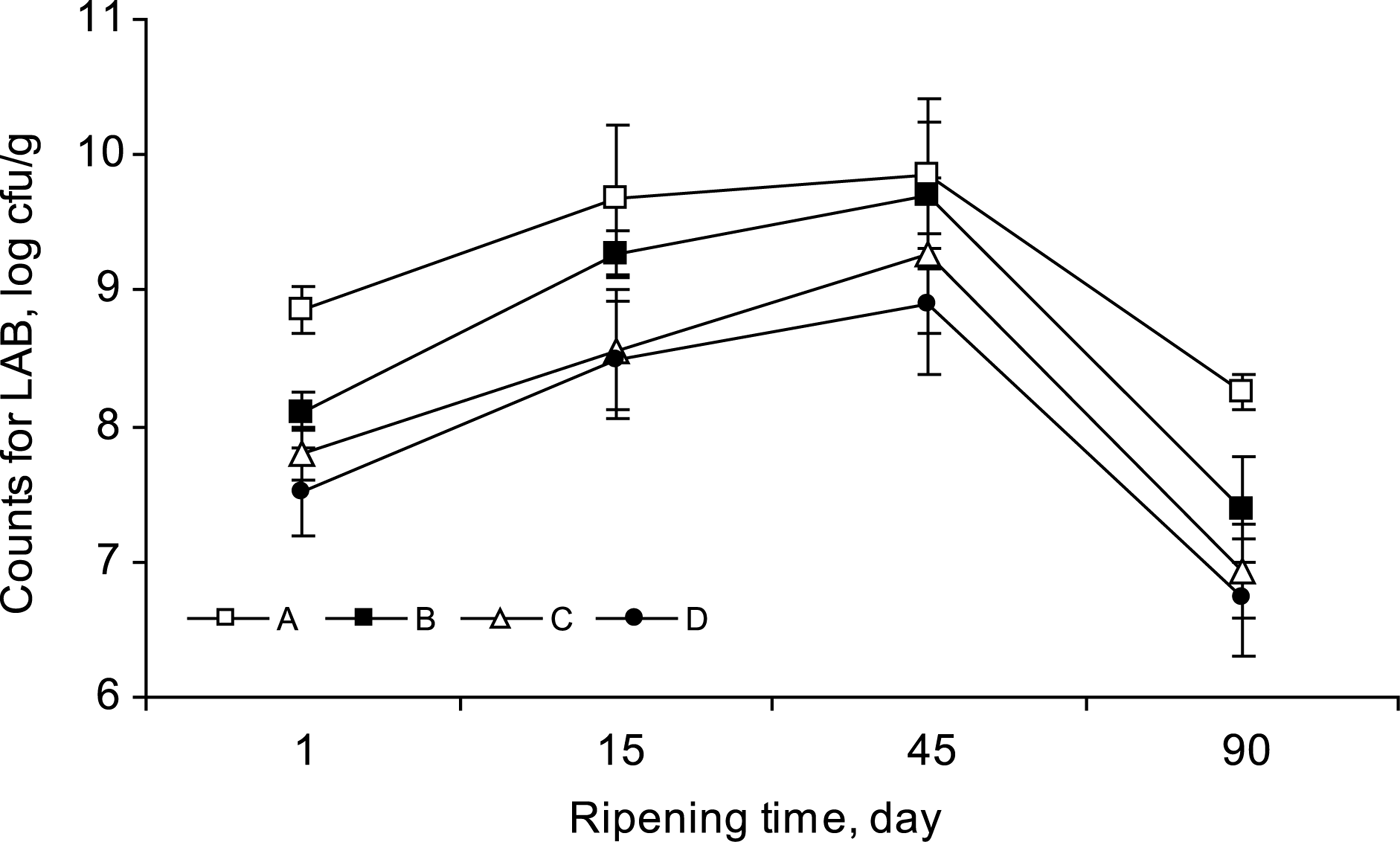
The influence of salt concentration on the total number of LAB in experimental cheeses are given in Fig. 4. An inverse relationship was determined between the total number of LAB and salt concentration of cheeses analysed. Cheeses A and D had the maximum and minimum number of LAB among the cheeses during ripening. The number of LAB in cheese decreased faster in high salt concentration (Kocak et al. Reference Kocak, Kilic-Akyilmaz, Turhan, Hayaloglu and Ozer2011). On the other hand, the total number of LAB were constantly increased up to 45 d of ripening in the cheeses probably due to production of acid by starter and non-starter microorganisms, the decrease in pH value providing suitable conditions for increase the number of LAB (Tzanetakis & Litopoulou-Tzantaki, Reference Tzanetakis and Litopoulou-Tzantaki1992).
Total number of LAB in Iranian UF White cheeses manufactured with addition different concentrations of salt [salt-free (A), 1% (B), 2·5% (C) and 4% (D)] after 1, 15, 45 and 90 d of ripening.
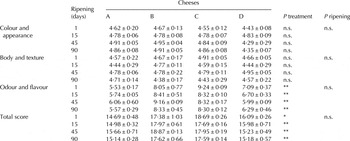
The mean sensory scores of the experimental cheeses are shown in Table 3. No significant differences were noted in colour and appearance among cheeses during ripening. Appearance is an important factor in the consumer acceptance and directly related to product quality. Salting the cheese results in the absorption of free serum into the matrix, giving an homogeneous matrix with few discontinuities or surfaces to cause light scattering. Thus, the salted cheese becomes translucent (Kaya, Reference Kaya2002).
Sensory scores of Iranian UF white cheeses manufactured with addition different concentrations of salt [salt-free (A), 1% (B), 2·5% (C) and 4% (D)] after 1, 15, 45 and 90 d of ripening†

† Values are shown as mean ± sd of three separate samples from three batches
n.s.: non-significant, *: P < 0·05, **: P < 0·01
The body and texture points in cheese D were higher than those of cheeses B and C. The texture values in cheeses increased with increasing salt concentrations. Similar results were also reported by Kaya (Reference Kaya2002) for Gaziantep cheese and Al-Otaibi & Wilbey (Reference Al-Otaibi and Wilbey2004) for UF-White cheese. The odour and flavour of experimental cheeses were significantly (P < 0·01) affected by salt concentration and cheeses B and C received significantly higher odour and flavour points than cheeses A and D during ripening. The higher points for odour and flavour in cheeses B and C may be due to their moderate levels of proteolysis products compared with cheeses A and D (Al-Otaibi & Wilbey, Reference Al-Otaibi and Wilbey2005).
A bitterness in cheese A was detected by graders especially after 45 and 90 d of ripening probably due to increased β-casein degradation by chymosin because of absence of salt; this may cause bitterness and off-flavours (Al-Otaibi & Wilbey, Reference Al-Otaibi and Wilbey2006). Significant differences (P < 0·01) were observed among cheeses in term of total sensory scores due to higher points of cheeses B and C than cheeses A and D in odour and flavour during ripening.
Conclusion
The results showed that increasing salt concentration led to decrease in fat in DM content in experimental cheeses probably due to increase the DM content. Because of effect of salt concentration on some factors such as drainage and proteolysis, the protein content was changed among the cheeses. Cheeses with higher salt concentration exhibit a lower extent of proteolysis (i.e., soluble N fractions, FAA contents, peptide profiles).
The differences in urea-PAGE patterns and RP-HPLC peptide profiles of the cheeses increased and were more pronounced as ripening progressed. Higher salt concentration caused a decrease in number of LAB in the cheeses produced. Furthermore, the cheeses B (1% salt) and C (2·5% salt) received higher points from sensory expert panel especially in odour and flavour scores and no negative scores were realised for these cheese during 90 d of ripening. So, Iranian UF-white cheese can be manufactured with lower salt concentration than is applied now (~3%).
Thanks are to The Scientific and Technological Research Council of Turkey (TUBITAK, Ankara, Turkey) for awarding a doctoral fellowship (under 2215 programme) to first author Mostafa Soltani. Authors express their thanks to Research Projects unit of Çukurova University for partially funding this work (Project No: ZF2011D25).