Introduction
Often found in the tropic and subtropic regions (Indraratna and Nutalaya Reference Indraratna and Nutalaya1991; Mahalinger-Iyer and Williams Reference Mahalinger-Iyer and Williams1997; Ng et al. Reference Ng, Akinniyi, Zhou and Chiu2019), the distinctly red-brown lateritic soil (lateritic clay, laterite) is the residual product of intense chemical weathering processes (Ko et al. Reference Ko, Chu, Lin and Peng2006) and laterization of a wide variety of rocks. Through weathering and laterization processes, components such as CaO, MgO, K2O, and Na2O are partially or completely removed, while laterite constituents (Al, Fe, Ti, and Mn oxides and hydroxides) tend to accumulate (Gidigasu Reference Gidigasu1976; Berger et al. Reference Berger, Janots, Gnos, Frei and Bernier2014; Engon et al. Reference Engon, Abane, Zame, Ekomane, Bekoa, Mvogo and Bitom2017). Laterite is characterized by the presence of sesquioxides (i.e. Fe2O3 and Al2O3) which can cement the soil particles to form a weakly bonded particulate material (Ola Reference Ola and Ola1983), and clay-size particles also form large aggregates resulting in a more granular microstructure (Ng et al. Reference Ng, Akinniyi, Zhou and Chiu2019). Kaolinite, gibbsite, goethite, hematite, and quartz are common in laterite (Wei et al. Reference Wei, Ji, Wang, Chu and Song2014; Morandini and Leite Reference Morandini and Leite2015; Oluremi et al. Reference Oluremi, Eberemu, Ijimdiya and Osinubi2019), but laterite is montmorillonite-poor (Kamtchueng et al. Reference Kamtchueng, Onana, Fantong, Ueda, Ntouala, Wongolo, Ndongo, Ngo'o Ze, Kamgang and Ondoa2015). Laterite, in its various forms, is found on about a third of the world’s continents (Stoops and Marcelino Reference Stoops, Marcelino, Stoops, Marcelino and Mees2018), and can be up to tens of meters thick.
Laterization may result in a very microporous structure (Morandini and Leite Reference Morandini and Leite2015). If well compacted, laterite can reach a maximum dry density of 1.82 g/cm3 (Morandini and Leite Reference Morandini and Leite2015), with hydraulic conductivities of ~10–7 cm/s or less (Anderson and Hee Reference Anderson and Hee1995). Additionally, due to the significant presence of sesquioxides and clay minerals with large specific surface areas, lateritic soils commonly have a notable capacity for immobilizing heavy metals or organic contaminants (Axe and Trivedi Reference Axe and Trivedi2002; Wang et al. Reference Wang, Li, Yeh, Wei and Teng2008; Syafalni et al. Reference Syafalni, Lim, Ismail, Abustan, Murshed and Ahmad2012). Because of its relative abundance, low cost, and beneficial geotechnical and geochemical properties, residual lateritic clay can serve as lining material for waste-containment facilities.
Many previous works have examined the feasibility of employing lateritic soils as liners in waste disposal facilities, especially with respect to their physical and chemical characteristics (Frempong and Yanful Reference Frempong and Yanful2008; Miguel et al. Reference Miguel, Barreto and Pereira2017), hydraulic conductivity (Anderson and Hee Reference Anderson and Hee1995; Leton and Omotosho Reference Leton and Omotosho2004; Osinubi and Nwaiwu Reference Osinubi and Nwaiwu2006), heavy metal-sorption capacity (Udoeyo et al. Reference Udoeyo, Brooks, Inyang and Bae2010; Chotpantarat et al. Reference Chotpantarat, Ong, Sutthirat and Osathaphan2011; Miguel et al. Reference Miguel, Barreto and Pereira2015; Ojuri et al. Reference Ojuri, Akinwumi and Oluwatuyi2017), and compatibility with metal solutions (Frempong and Yanful Reference Frempong and Yanful2006; Chalermyanont et al. Reference Chalermyanont, Arrykul and Charoenthaisong2009). The permeability, desiccation-induced volumetric shrinkage, and unconfined compressive strength of lateritic soils sourced from acidic igneous and metamorphic rocks were investigated by Osinubi and Nwaiwu (Reference Osinubi and Nwaiwu2006). The effects of municipal solid-waste landfill leachate on the geotechnical, mineralogical, sorptive, and diffusive properties, and on the permeability of tropical soils which represent the residual weathered products of Middle Precambrian phyllites were examined by Frempong and Yanful (Reference Frempong and Yanful2008). The physical-chemical properties of lateritic soil residues from Carboniferous rocks (sandstone, shale, siltstone, chert, and mudstone) were studied by Chalermyanont et al. (Reference Chalermyanont, Arrykul and Charoenthaisong2009). The geotechnical parameters (Atterberg limits, compaction characteristics, hydraulic conductivity, unconfined compressive strength, and volumetric shrinkage strain) of a lateritic soil as a liner in waste-containment structures were measured by Amadi and Eberemu (Reference Amadi and Eberemu2013). Many studies have focused on the use of lateritic soils in municipal, solid-waste landfills and hazardous-waste dumps; few studies have assessed naturally occurring lateritic clay overlying carbonate rocks as potential tailings-impoundment liner materials. Mining operations produce over five billion tons of mine tailings per year (Schoenberger Reference Schoenberger2016; Wang et al. Reference Wang, Ji, Hu, Liu and Sun2017); these tailings are contained in various types of impoundments. Clay (both artificially purified and naturally occurring) has been used widely as an impoundment liner (Vick Reference Vick1990; USEPA 1994; Akayuli et al. Reference Akayuli, Gidigasu and Gawu2013; Agbenyeku et al. Reference Agbenyeku, Muzenda and Msibi2016); the performance of laterite liners, especially in karst mining areas, is not well known, however.
The Gejiu Tin Mine, located in southern China, is the world's largest Sn-polymetallic mine. Because this region lacks the topography required for conventional impoundments, mining activities have filled more than 30 natural karst depression (polje) impoundments with tailings since the 1950s. While the rocks underlying the depressions are highly karstified, the karst aquifers are not polluted. The puzzling absence from the aquifers of heavy metals found in the impoundments should be partly attributed to the presence of the laterite lining the karst depressions (Gao et al. Reference Gao, Xu, Wang, Ren, Yang, Tang, Tian and Chen2019).
Karstic carbonate rocks are common hosts of metal mines (Li and Zhou Reference Li and Zhou1999; Zhang et al. Reference Zhang, Dai, Huang, Luo, Qian and Zhang2015; Johnson et al. Reference Johnson, Gutiérrez, Gouzie and McAliley2016; Yan et al. Reference Yan, Wang, Wang, Yang and Li2019), and are commonly clad in laterite (Durn et al. Reference Durn, Ottner and Slovenec1999; Ji et al. Reference Ji, Wang, Ouyang, Zhang, Sun, Liu and Zhou2004; Feng and Zhu Reference Feng and Zhu2009; Liu et al. Reference Liu, Liu, Zhao, Xu, Liang, Li and Feng2013; Wei et al. Reference Wei, Ji, Wang, Chu and Song2014; Engon et al. Reference Engon, Abane, Zame, Ekomane, Bekoa, Mvogo and Bitom2017; Xu et al. Reference Xu, Sun, Zeng and Lv2019). In order to test the inference about the barrier effects of naturally occurring laterite in karst depressions, and to evaluate further the feasibility of the construction of karst depression impoundments, the present study was undertaken to examine the laterite layers located beneath the active WJWT tailings impoundment in the Gejiu Tin Mine (Fig. 1 in Gao et al. Reference Gao, Xu, Wang, Ren, Yang, Tang, Tian and Chen2019) and the laterite on basin walls.
STUDY AREA
The WJWT tailings impoundment (23°18′06″ N, 103°13′25″ E) lies ~300 km SSE of Kunming, Yunnan, SW China (Fig. 1a). The regional climate is temperate (tropical−subtropical monsoon climate) with a short, mild winter and a warm summer. The average annual temperature is 11.8°C with minimum and maximum temperatures of –4.4 and 35.6°C, respectively. The monthly average air temperature ranges from 9.9 to 20.1°C. Mean annual precipitation is approximately 1610 mm and almost 85% of the total annual precipitation occurs in the rainy season (May–October). Annual potential evaporation is ~1203 mm.
Map of the karst depression tailings impoundment. a Overview map of the WJWT impoundment and surrounding tailings impoundments (NBH, MDD, HMS, BYS, AXZ, BLJ, LDC, and YBD); b the WJWT depression prior to the deposition of tailings; and c the present-day karst depression impoundment and the sampling sites for the laterite. Boreholes and test pits are labeled as B and TP, respectively

Extensive karstic features and an alternating pattern of enclosed poljes and haystack hills (dolines) (Huggett Reference Huggett2007) characterize the landscape surrounding the impoundment (Fig. 1a). As is typical in karst-rich areas, no natural surface water bodies are found; most of the precipitation seeps into subterranean channels through sinkholes or fissures (Li Reference Li2011; Gao et al. Reference Gao, Xu, Wang, Ren, Yang, Tang, Tian and Chen2019).
The nearly ubiquitous Quaternary cover consists almost exclusively of laterite in the study area. The layer of laterite is dotted by rock outcrops which are 10s–100s of m2 in area, and not continuous, therefore. As a result, the thickness of the laterite layer varies from meters to decameters from location to location. This thickness variation, of course, is smaller in the bottoms of larger depressions, where more laterite is deposited compared to depression slopes. Significant differences in color, structure, and mineralogy mark the abrupt contact between the laterite layer and the underlying carbonate rocks.
The carbonate bedrock is composed of thick-bedded limestone and dolostone from the Middle Triassic Gejiu Group, with the outcrop (planimetric area of ~100 km2) taking the form of a gently dipping monoclinal structure striking NNE and a dip of 5–20°. The bedrock is highly fractured, and faults of all sizes trending N–S, SW–NE, ESE–WNW, and NW–SE are heavily developed. The Beiyinshan Fault Zone (~14 km long and 100–500 m wide) is one of the largest tectonic discontinuities in the study area, and it runs in a WNW–ESE direction from the northeastern part of the Niubahuang (NBH) impoundment through the Huangmaoshan (HMS), Beiyinshan (BYS), and WJWT impoundments before terminating in the Yangbadi (YBD) impoundment (Fig. 1a). Like most of the discontinuities in this area, the Beiyinshan Fault Zone has a sub-vertical orientation.
Eight karst depression tailings impoundments including NBH, Mudengdong (MDD), HMS, BYS, Bailongjing (BLJ), Axizhai (AXZ), Ladachong (LDC), and YBD, in addition to the WJWT targeted in the present study, are hosted within the rectangular area with a length of 15.6 km and a width of 5.6 km (Fig. 1a).
The WJWT depression, with elevations of 2188 m a.s.l. at the floor to 2243 m a.s.l. at the outlet and a total catchment area of ~4.49 km2, is a structural polje caused mainly by the Beiyinshan Fault Zone (Fig. 1b). The polje is roughly olive-shaped in plan view, with a length of ~1.6 km in the NW–SE direction and a width of ~0.4 km. The bedrock of the depression is almost entirely covered by laterite at the bottom of the depression; the average thickness of the laterite is ~12.8 m, with a maximum thickness of 45.2 m. Over the course of 10 years, the depression has received nearly 6 million metric tons of mill tailings and reached an elevation of ~2242 m (Fig. 1b and c). At present, a retention dam is being constructed near the mouth of this natural polje, which will increase the storage volume by ~4 million m3.
METHODS
The laterite studied was collected during geotechnical survey campaigns related to the potential expansion of the WJWT impoundment in 2013 and 2016.
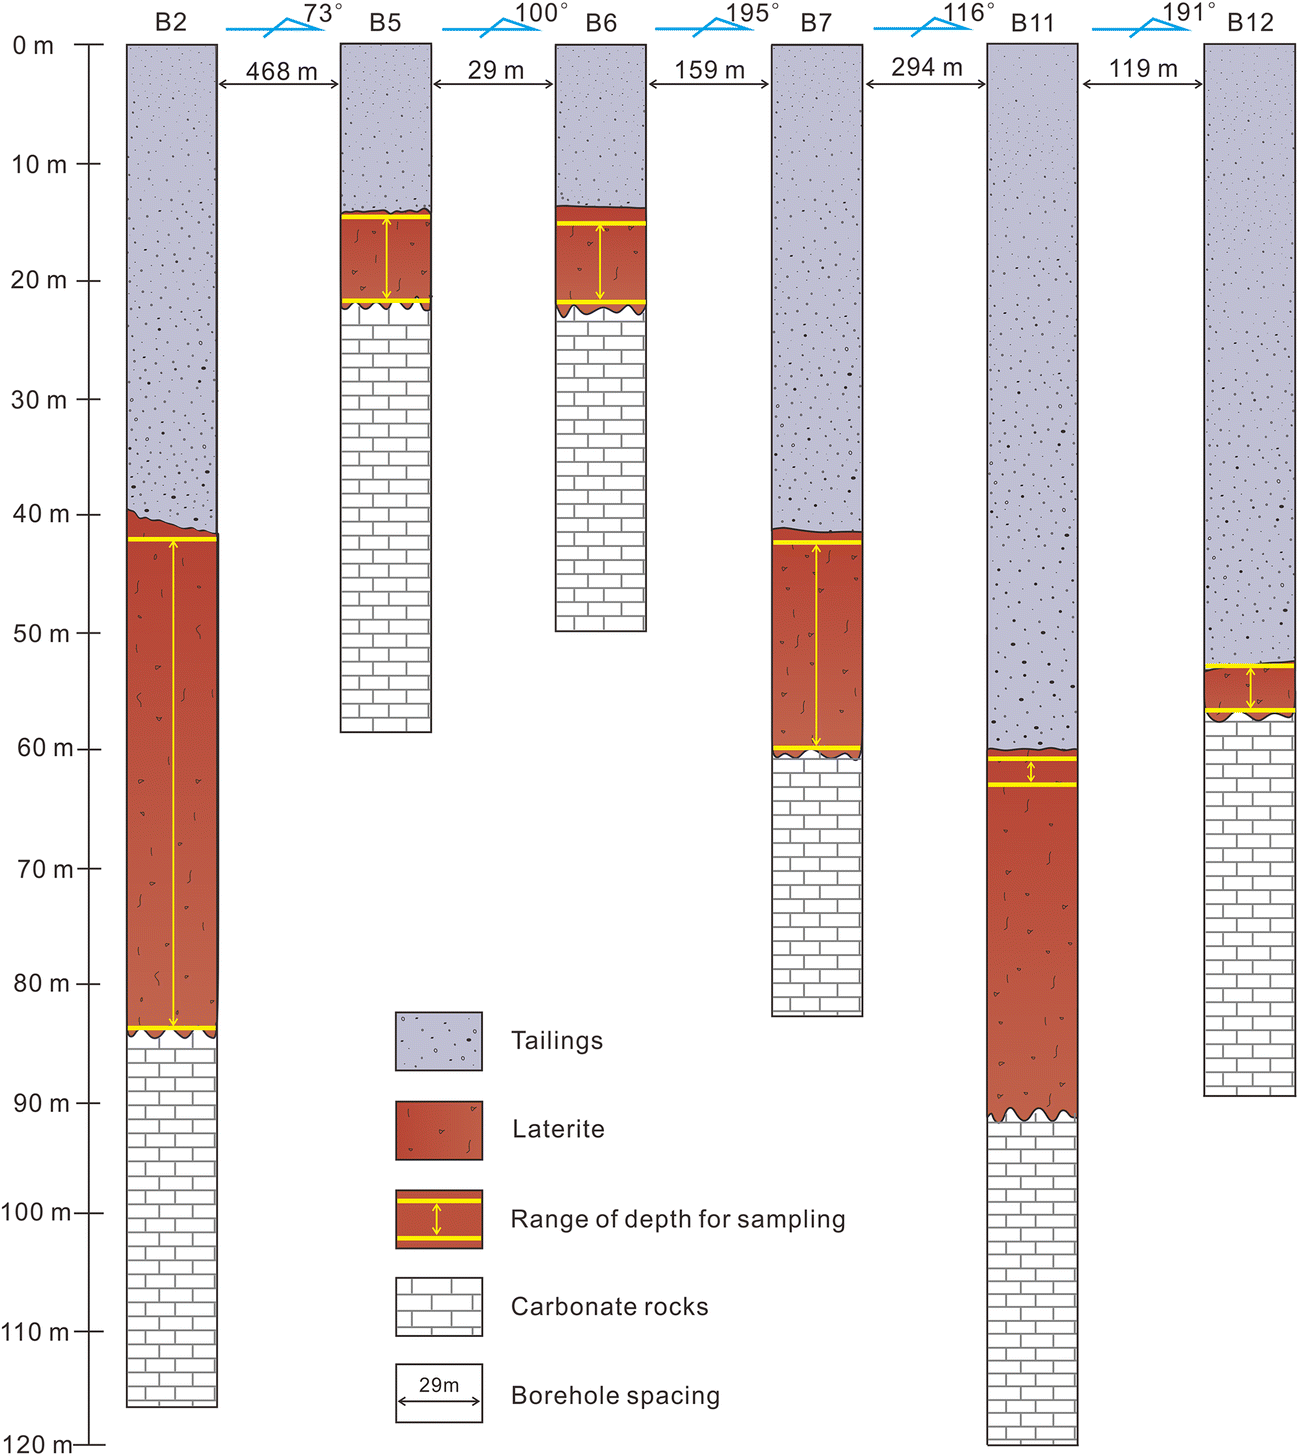
The laterite beneath the tailings impoundment (disturbed laterite) was gathered from six cores drilled (boreholes B2, B5-B7, B11, and B12) at spacings of 29 to 468 m apart (Figs 1c and 2); sample depths ranged from 14.2 to 84.2 m (Fig. 2).
The sampled boreholes and the sampling strategy for the laterite beneath the tailings impoundment. The locations of the boreholes are shown in Fig. 1c

The laterite from the basin slope was sampled at depths of 0.5–1.8 m in test pits 1 and 2 (TP1 and TP2), which are located on the southeastern and northern slopes of the WJWT depression, respectively (Fig. 1c). Because the samples from TP1 and TP2 are only a few hundred meters from the depression occupied by the impoundment, they should have experienced climatic and tectonic conditions identical to those from the laterite beneath the impoundment, and are similarly underlain by a uniform carbonate bedrock unit. Each sample was placed in a clean polyethylene bag and sealed prior to transport to the laboratory.
Using previous studies relating to the barrier effects of native soils (Humayun Kabir and Taha Reference Humayun Kabir and Taha2004; Ige Reference Ige2011; Seun et al. Reference Seun, Ige and Alao2016; Emmanuel et al. Reference Emmanuel, Anggraini and Gidigasu2019) as guidelines, a sequence of relevant indices was selected as the variables to characterize the geotechnical-hydraulic-mechanical behaviors of the tested soils.
Geotechnical parameters included the grain-size distribution (D 90, D 60, D 50, D 30, D 10, coefficient of uniformity (C u), and coefficient of gradation (C c)), the specific gravity of soil solids (G s), the specific surface area (SSA), and the Atterberg limits (the liquid limit (ωL), the plastic limit (ωP), and plasticity index (PI)) for the <0.5 mm fraction following GB/T 50123 (1999). Further, the free swelling rate (FSR) for the <0.5 mm fraction and the P-wave velocities of the saturated bulk samples (V psat) were also measured. Compression (compression index, C i; Terzaghi et al. Reference Terzaghi, Peck and Mesri1996; Das Reference Das2008) was regarded as a key parameter here, reflective of mechanical properties with particular significance for impoundment seepage.
The particle-size distribution of the selected bulk samples was obtained using a wet-sieving method (Johnson and Rodine Reference Johnson, Rodine, Brunsden and Prior1984; ASTM D422-63 2007) with 2, 1, 0.5, 0.25, and 0.075 mm mesh sized sieves (for the >0.075 mm fraction) combined with laser granulometry (Beckman Coulter®LS 13320, Brea, California, USA) (for the <0.075 mm fraction). The SSA was measured using the Beckman Coulter laser particle size analyzer. Standard tests for Atterberg limits of the laterite were performed using the methods described in ASTM D4318-10 (2014). The FSR, or the ratio of the volumetric increment in water to the initial volume of 10 cm3 of dry soil solids, was obtained using the methodology outlined in GB/T 50123 (1999).
Samples of 5 cm in diameter and 5 cm in height embedded in rigid cutting rings in situ were soaked in water in the laboratory to achieve saturation for comparison, and then both ends of the saturated samples were trimmed using a sharp knife, thus obtaining the specimens for V psat tests, which were done using a wave-propagation test device (CTCO®QYCS-A6, Wuhan Jianke Technology Co., Ltd, Wuhan, Hubei, China). Conventional tests for some of the index properties, including G s, the Atterberg limits, and C i, were implemented in accordance with GB/T 50123 (1999).
Moisture content (ω), porosity (n), and permeability (saturated hydraulic conductivity, K sat) are the main hydrogeological parameters affecting the migration of contaminants through laterite. K sat tests following the procedure proposed in GB/T 50123 (1999) were conducted in rigid-wall permeameters (diameter 61.8 mm and height 40 mm) with the falling-head method.
Geochemically, the bulk chemical composition and the heavy-metal contents in both the laterite from underneath the impoundment and from the basin walls were determined, including loss on ignition (LOI), pH, major elements (SiO2, Al2O3, Fe2O3(T), FeO, CaO, MgO, Na2O, K2O, MnO, TiO2, P2O5, and Cr2O3), and minor elements (As, Hg, Cd, Co, Cr, Cu, Mn, Mo, Ni, Pb, and Zn). K2O, Na2O, and Cr2O3 were analyzed by inductively coupled plasma optical emission spectrometry (ICP-OES, Perkin Elmer Optima 5300DV, Waltham, Massachusetts, USA, with a lower detection limit of 0.1–1 ppm). SiO2, Al2O3, Fe2O3(T), TiO2, CaO, MgO, MnO, and P2O5 were determined with a wavelength dispersive XRF spectrometer (Philips PW2400, Almelo, the Netherlands), equipped with a 2.4 kW Rh X-ray tube. The detection limit was 0.01 wt.% for the major elements and 0.001 wt.% for Ti, P, and Mn.
The concentrations of minor elements (heavy metals and metalloid) were measured using an inductively coupled plasma mass spectrometer (ICP-MS, X Series II, Thermo Fisher Scientific®, Waltham, Massachusetts, USA) with detection limits of 0.27 mg/kg for As, 0.0004 mg/kg for Hg, 0.02 mg/kg for Cd, 0.07 mg/kg for Co, 0.82 mg/kg for Cr, 0.89 mg/kg for Cu, 2.91 mg/kg for Mn, 0.04 mg/kg for Mo, 0.44 mg/kg for Ni, 0.96 mg/kg for Pb, 0.2 mg/kg for Sn, and 2.15 mg/kg for Zn.
To confirm the geochemical results, the <0.075 mm fraction of the laterite was separated using a precipitation method (separation and analysis of clay minerals in Quaternary sediments, DD2014-16, 2014). The mineral composition of the fines obtained was analyzed by XRD (Rigaku D/MAX-IIIA, Tokyo, Japan) equipped with CuKα X-radiation (λ = 1.5406 Å). The step-scan mode was 5–40°2θ, 0.02°2θ step size, with a 2 s count for each step. Mineral abundances were estimated by means of semi-quantitative analysis. In addition, the shapes of the particles making up the laterite were examined through a combination of a high-resolution digital, single-lens reflex camera (Canon®EOS 5D Mark III) equipped with macro lenses (Canon®MP-E 65 mm f/2.8 1–5× Macro Photo and EF 100 mm f/2.8 L Macro IS USM, Tokyo, Japan), a scanning electron microscope (SEM, FEI®QUANTA 200, FEI company, Hillsboro, Oregon, USA) and a field-emission scanning electron microscope (FESEM, FEI®NovaNanoSEM 450, Hillsboro, Oregon, USA) coupled with Energy Dispersive X-ray Spectroscopy (EDX).
Results
Geotechnical Properties
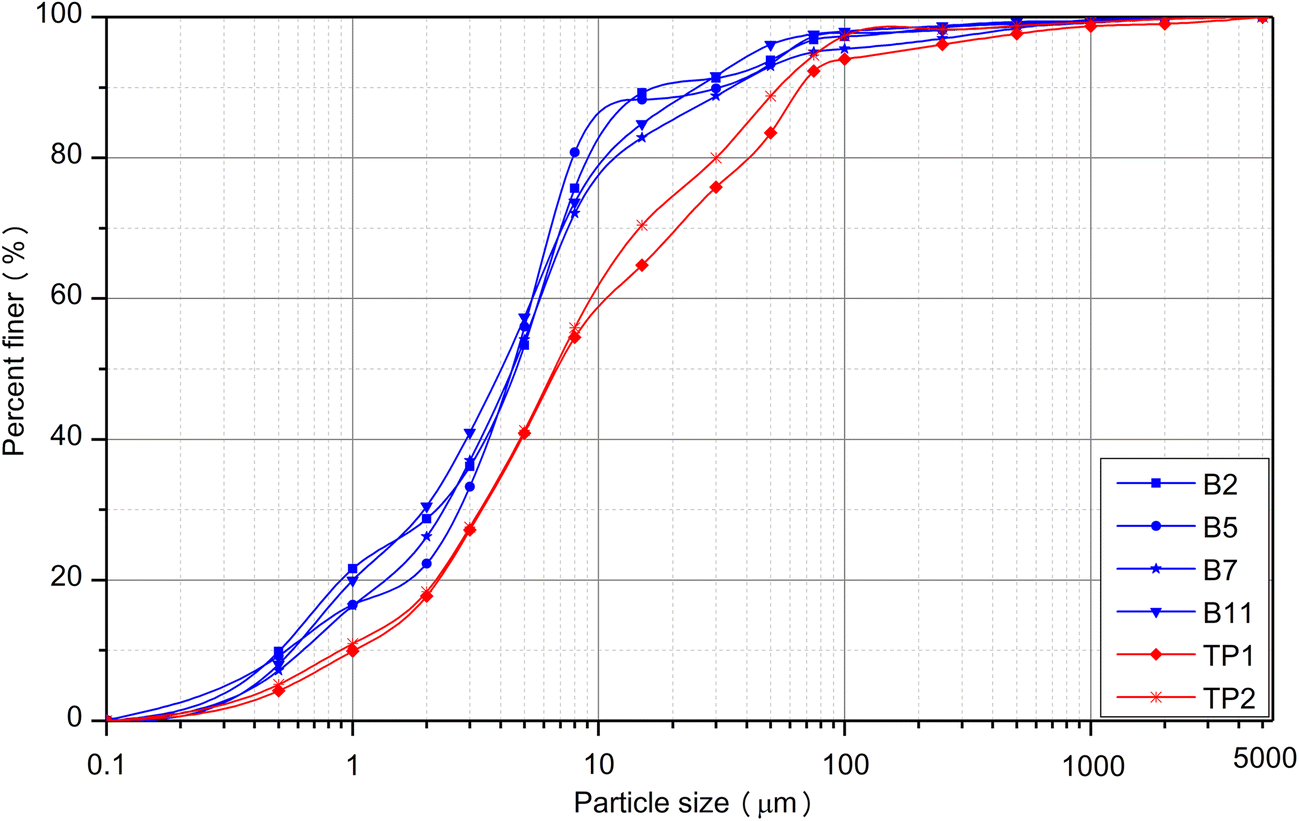
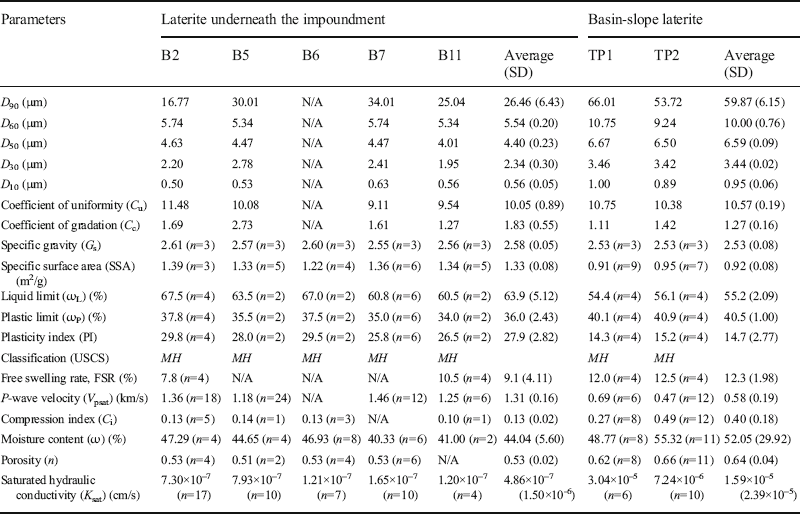
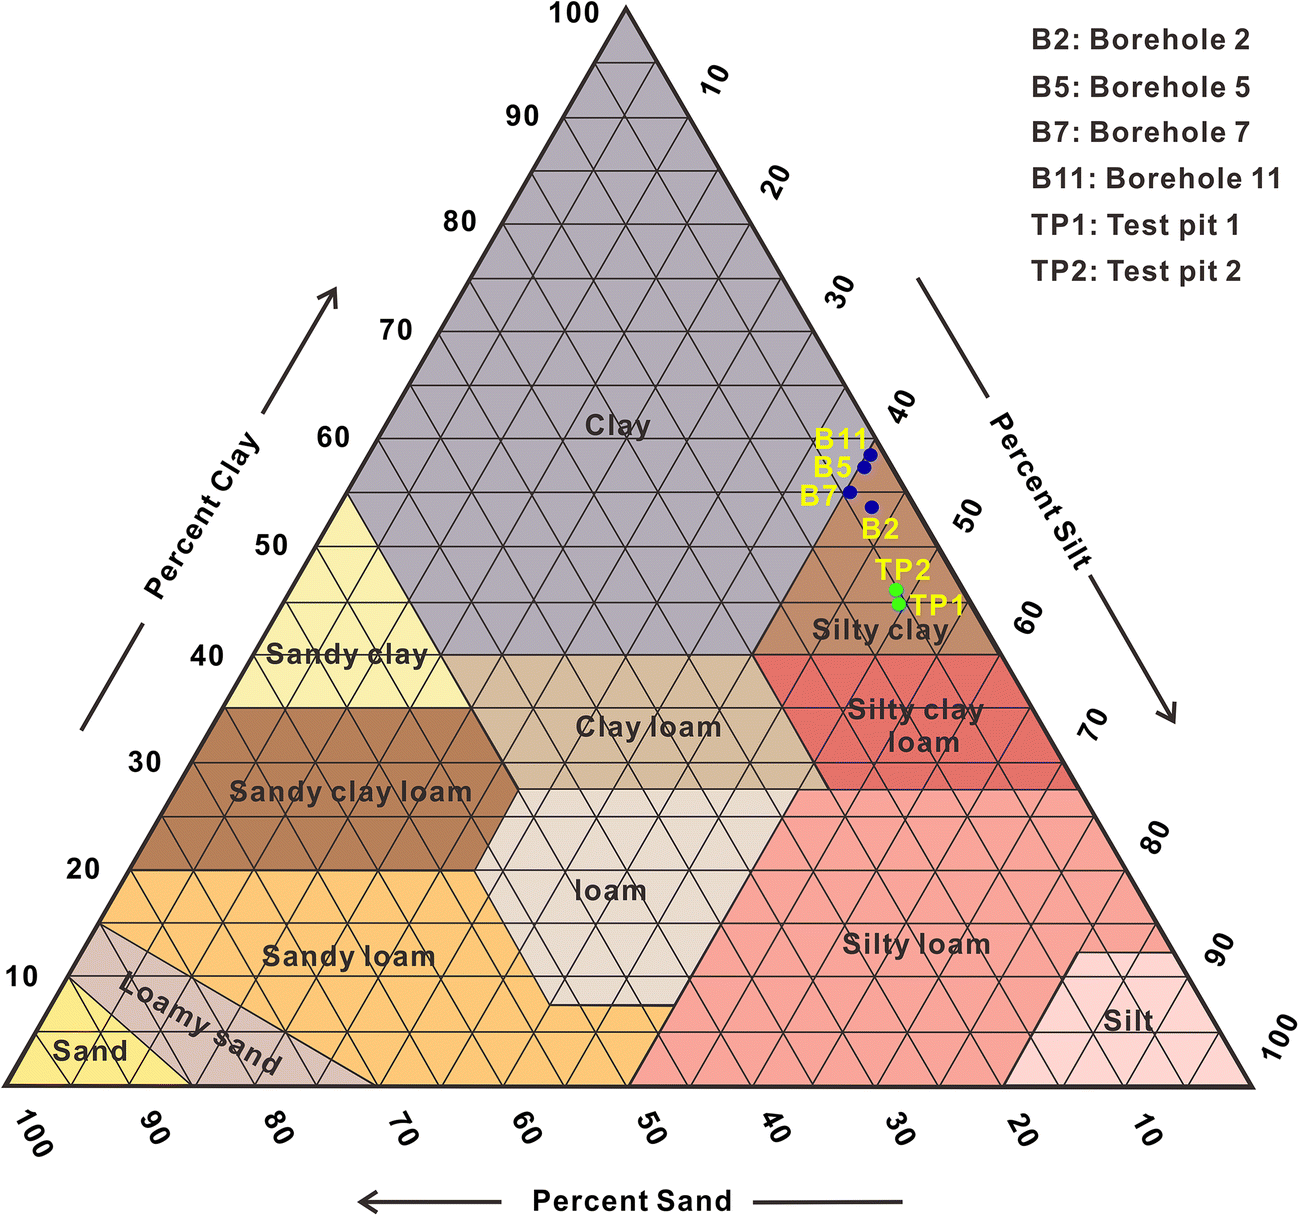
According to the results of the grain-size analysis (Fig. 3, Table 1), all of the laterite in this study fell in the silty clay domain, rather than the clay domain, of the USDA textural triangle (USDA 2017) (Fig. 4) following particle-gradation scales for the fine-earth fraction proposed by AASHTO (1997). This was somewhat surprising because the study area lies on the well known ‘red-soil’ plateau in China and the soil involved has traditionally been viewed as laterite (Li Reference Li2000; Xiao et al. Reference Xiao, Wang, Zhao and Ye2011; Qiao et al. Reference Qiao, Zhou, Yang, Lei and Chen2014; Ran et al. Reference Ran, Ning, Sun and Liang2019). Furthermore, the data points for the laterite underneath the impoundment were concentrated close to the boundary between the silty clay and the clay domains in the USDA textural triangle, whereas the basin-slope laterite was closer to the boundary line between silty clay and silty clay loam (Fig. 4). This indicated that the laterite under the impoundment was finer-grained than that on the polje wall. The PI measurements supported the grain-size data. Using the criteria of GB50021 (2001), the impoundment laterite, which had an average PI value of 27.9 (Table 1), can be classified as clay, while the basin-slope laterite, with PI values ranging from 14.3 to 15.2 (Table 1), belongs to silty clay.

Physico-mechanical parameters of the laterite studied

n: number of measurements; N/A: not measured; SD: standard deviation; MH: silts of high liquid limit (USDA-NRCS 2012); SSA was measured for the <0.075 mm fraction.

The C u (9.11-11.48; Table 1) and C c (1.11-2.73; Table 1) measurements indicated that the laterite from the two locations was well graded (Das Reference Das2008), albeit very fine-grained. In addition, for both the <1 μm and the <75 μm fractions, the grain sizes of the impoundment laterite particles were much finer than those of the slope laterite (Fig. 3).
While the G s values of the two different sets of laterite varied only slightly (2.5-2.6; Table 1), the difference between the average specific surface areas of the two sites was pronounced. The average SSA of the impoundment laterite obtained from 23 core samples was 1.33 m2/g (standard deviation, SD = 0.08 m2/g), which was much larger than the SSA value of 0.92 m2/g determined by analysis of 16 basin-slope laterite samples.
According to the USDA-NRCS (2012) Unified Soil Classification for fine-grained soils (i.e. capable of passing through a number 200 mesh sieve), which takes into account both PI and ωL, all the tested laterite fell into the MH domain (silts of high liquid limit). These data, taken in conjunction with the aforementioned textural classification, indicated that the materials involved were not strictly lateritic clay (Anifowose Reference Anifowose2000). For the purposes of the present study, however, the terms “lateritic clay” and “laterite” (McCarthy and Venter Reference McCarthy and Venter2006) were used interchangeably.
Note that the laterite used as the liner in the WJWT impoundment, with an average PI of 27.9 in a spectrum from 25.8 to 29.8 (Table 1), can be classified as clay (in the PI range of >17), and the basin-slope laterite, with a PI of 14.3–15.2 (Table 1), is classified as a silty clay (in the PI range of 10–17) according to the criteria of GB50021 (2001).
The laterite from underneath the impoundment had an average FSR value of 9.1% (standard deviation of 4.11%) and an average V psat of 1.31 km/s (standard deviation of 0.16 km/s), while the basin-slope laterite samples had a mean FSR of 12.3% (standard deviation of 1.98%) and a V psat average value of 0.58 km/s (standard deviation of 0.19 km/s) (Table 1). Both types of laterite samples were categorized as non-swelling soil (with a <40% FSR, GB50021 2001). While the two sets of samples exhibited largely similar swelling behavior (Figs 1b, c, 2), they differed significantly in terms of their wave-propagation characteristics.
To understand better the mechanical behavior of the laterite, 10 compression test runs were performed for core samples collected from B2, B5, B6, and B11 (impoundment); and 20 test runs were performed for the basin-slope samples (Table 1, Fig. 2). Typical log effective stress (σ′) values with respect to the void ratio (e) were obtained (Fig. 5). The C i values of the laterite under the tailings varied from 0.10 to 0.16 with an average of 0.13, whereas those of the basin-slope laterite spanned a range between 0.14 and 0.69 with a mean of 0.40. While the locations for both the core and the basin-slope samples varied systematically with depth, the C i trend did not exhibit the expected linear decrease as a function of depth.

Hydrogeological Parameters
The basin-slope laterite contained more moisture than that under the impoundment, 49–55% as opposed to 40–47% (Table 1). Referring to the number of samples and the date upon which the samples were collected (2016/01/12), this observed variability in ω should be minimal during the year. The mean porosity of 16 core samples from four drill holes was 53±2%, compared to 64±4% for the 19 test-pit samples.
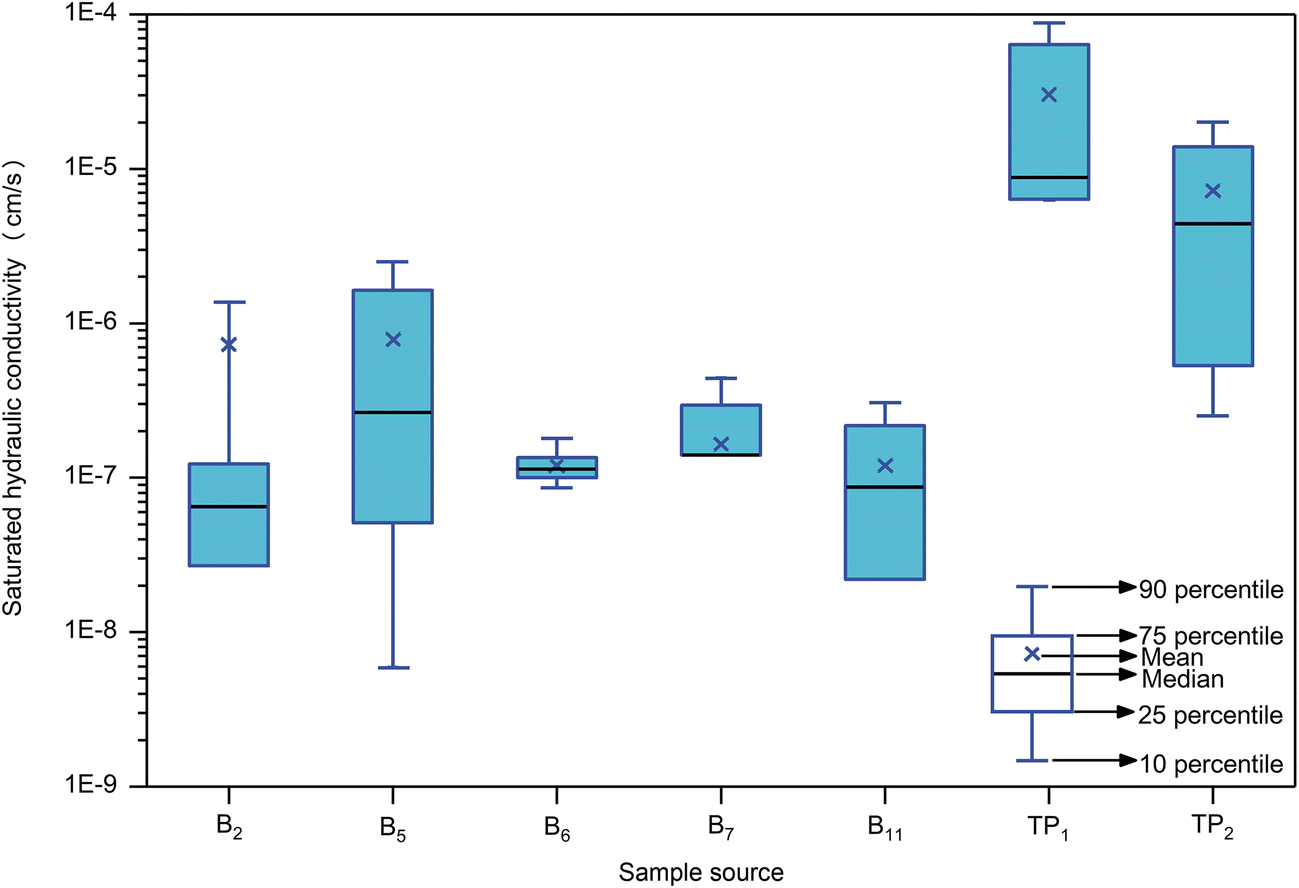
The K sat values obtained for the impoundment laterite varied between 1.20×10⁻⁷ and 7.93×10⁻⁷ cm/s, and for the basin-slope laterite varied between 3.04×10⁻⁵ and 7.24×10⁻⁶ cm/s. The former had a mean of 4.86×10⁻⁷ cm/s with a standard deviation of 1.50×10⁻⁶ cm/s, compared to the latter, having a mean of 1.59×10⁻⁵ cm/s with a standard deviation of 2.39×10⁻⁵ cm/s (Table 1), which was a difference of roughly two orders of magnitude (Fig. 6). Similar to the C i described above, 17, 10, 7, 10, and 4 K sat samples were collected at intervals from cores at locations B2, B5, B6, B7, and B11, respectively, and tested (Fig. 2). No systematic variations in K sat with increasing depth in the laterite beneath the tailings were found, however.

Geochemistry and Mineralogy
Major constituents
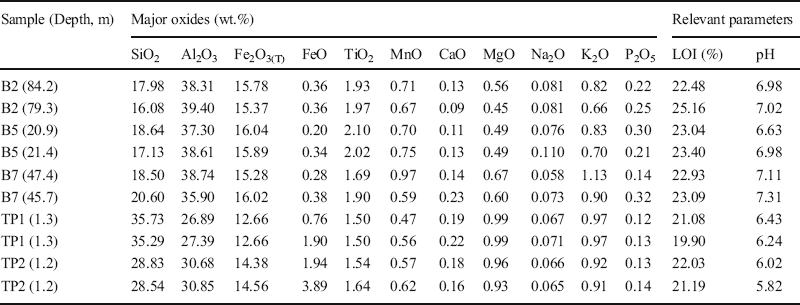
Samples B2, B5, B7, TP1, and TP2 (Fig. 1c) were sampled in the investigation of the bulk chemical composition of the laterite. For every one of the five reconnaissance sites, two samples were taken concurrently at about the same depth (in an attempt to achieve reliability and reproducibility of measurements), producing ten sets of chemical analysis results (Fig. 7, Table 2). The main geochemical properties of the laterite, according to the major-constituent analyses, can be summarized as follows:
(1) Si, Ca, and Mg were less abundant than in laterites from elsewhere (Zhu and Lin Reference Zhu and Lin1996; Sarkar et al. Reference Sarkar, Banerjee and Pramanick2006; Hong et al. Reference Hong, Li and Xiao2009; Sunil et al. Reference Sunil, Shrihari and Nayak2009; Biswal et al. Reference Biswal, Sahoo and Dash2016; Campodonico et al. Reference Campodonico, Pasquini, Lecomte, García and Depetris2019). Si, while one of the important constituents of laterite, ranged only between 16.08 and 35.73% (mean value of 23.73%). The Ca contents varied from 0.09% to 0.23%, and Mg made up only 0.45–0.99%.
(2) Much greater proportions of Al, Fe, and Ti were observed. The abundances of Al were as high as 26.89% to 39.40% (average value of 34.41%), and those of Fe2O3(T) typically fell between 12.66 and 16.04% (average abundance of 14.86%). The average Ti contents were roughly one order of magnitude smaller than those of Al and Fe, and had values between 1.50 and 2.10% (average value of 1.78%).
(3) The laterite under the impoundment contained less Si, Ca, and Mg (Fig. 7a, g, and h) and more Al, Fe, Ti, and Mn than the basin-slope laterite (Fig. 7b, c, e, f). The average contents of Si, Ca, and Mg of the cores had values that were 57%, 74%, and 56% of those of test-pit samples, respectively, whereas the mean abundances of Al, Fe, Ti, and Mn were 1.2 to 1.3 times greater than those of the basin-slope laterite samples (Table 2). Moreover, smaller FeO concentrations (0.20–0.38%), greater concentrations of P2O5 (0.14–0.32%), and higher pH values (6.63–7.31) were observed in the core samples compared to the FeO concentrations (0.76–3.89%), P2O5 concentrations (0.12–0.14%), and pH values (5.82–6.43) of the basin slope laterite (Fig. 7d, i, and m).
Major-element concentrations and relevant parameter values of the laterite underneath the impoundment (B2, B5, and B7) and from the basin slope above the impoundment (TP1 and TP2) with respect to the sampling sites shown in Figs 1b, c, and 2

Selected major-element concentrations (wt.%) and relevant parameters of the laterite studied

No obvious differences in the Na2O and K2O contents and LOI values between the two sets of laterite samples (Table 2; Fig. 7j, k, and i) were detected.
Trace elements
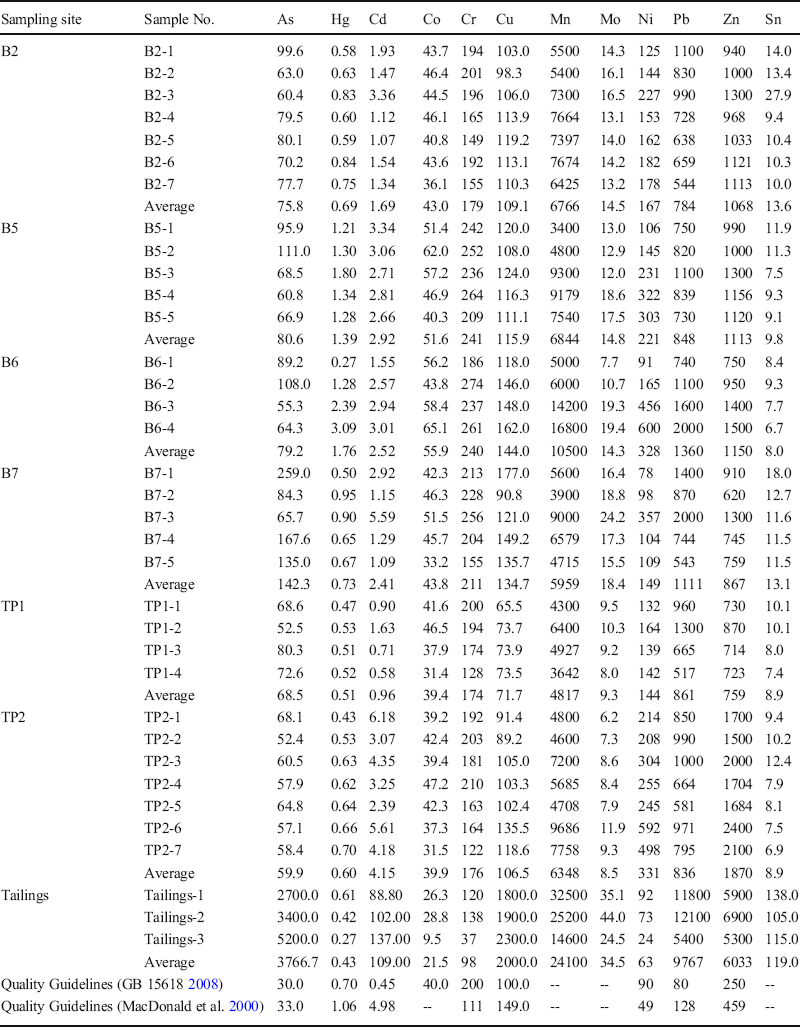
The trace-element abundances in the laterite samples (Table 3) and the comparisons with the quality guidelines (MacDonald et al. Reference MacDonald, Ingersoll and Berger2000; GB 15618 2008) (Fig. 8) revealed that, in general, the laterite has high concentrations of trace metals, to the point where the values meet or surpass the critical limits for environmental quality standards in soils (GB 15618 2008). Additionally, the laterite contained elevated levels of Hg, and its mean concentration was 0.84 mg/kg, which was greater than the guideline value of 0.7 mg/kg (GB 15618 2008, Table 3, Fig. 8).
Trace-element contents (mg/kg) of the laterite and the tailings in the WJWT impoundment

Quality Guidelines (GB 15618 2008, MacDonald et al. Reference MacDonald, Ingersoll and Berger2000) for the soils in the pH range between 6.5 and 7.5. Data for B5-1, B5-2, B5-3, B6-1, B6-2, B6-3, and B6-4 are cited from Gao et al. (Reference Gao, Xu, Wang, Ren, Yang, Tang, Tian and Chen2019)
Abundance ranges and their average trace-metal contents in the impoundment and basin-slope laterite vs. quality guidelines (GB 15618 2008, MacDonald et al. Reference MacDonald, Ingersoll and Berger2000). Sampling sites are shown in Figs 1b, c, and 2

Furthermore, the laterite under the tailings had greater trace-metal concentrations than the basin-slope laterite, with the exception of Cd, Ni, and Zn. The concentrations of most of the trace elements (As, Hg, Co, Cr, Cu, Mn, Mo, Pb, and Sn) were of the order of 1.12-1.80 times the quantities detected in the basin-slope laterite (Fig. 8 and Table 3).
While the As abundance decreased with increasing depths below the floor of the tailings impoundment, the actual depth at which sharp decreases in the content occurred varied by a few meters from one borehole to another (Figs 1c, 9). The other elements, however, showed no systematic content variations with depth.
Arsenic abundance as a function of depth below the contact between the tailings and the underlying laterite. Sampling sites are shown in Figs 1b, c, and 2

Mineralogical constituents
The semi-quantified mineralogy was determined by XRD (Fig. 10). Gibbsite (20–50%), goethite (5–10%), chlorite (5–20% except for 30–40% in TP1), and quartz (1–20% except the <2% of B2) prevailed in all of the six analyzed samples, the most significant among which was gibbsite. Also identified were trace amounts of kaolinite, illite, and talc in certain of the samples.
XRD patterns of the laterite under the impoundment (B2, B5, B7, and B11) and on the basin slopes (TP1 and TP2). Sampling sites are shown in Figs 1b, c, and 2

Note that slight differences in mineralogy between the laterite from underneath the impoundment and from the basin slopes were observed (Fig. 10), the most noteworthy among which was the greater presence of gibbsite in the former (40–50%) compared to the latter (20–40%).
Geometry of the Laterite Particles
The morphologic features of the coarse fraction (>0.075 mm) in six sieve classes of the laterite are displayed in Fig. 11. First of all, almost all particles were equidimensional, with minor platy muscovite crystals occurring in the ranges of 0.5–0.25 mm and 0.25–0.1 mm (Fig. 11g–j). The most impressive, of course, was the glomerospheric appearance of the particles, with subglomerospheric–glomerospheric (subrounded–rounded, USDA-NRCS 2012) grains comprising >50% by volume of the granular masses, the remainder of which was irregular, such as silkworm chrysalis- and ginger-shaped (Fig. 11a–j). At greater magnifications, the particles in a relatively narrow size range of 0.1–0.075 mm still showed no sharp edges and corners, but, instead, were closer to glomerospheric or subglomerospheric (Fig. 11k–n). Under FESEM, roughness heights of the order of microns to decamicrons on the surfaces of the particles 0.5–1 mm in size were observed (Fig. 11o–s).
The coarse laterite particles (>0.075 mm) separated by wet sieving in six sieve classes. a and b 2–5 mm; c and d 1–2 mm; e and f 0.5–1 mm; g and h 0.25–0.5 mm; i and j 0.1–0.25 mm; k–n SEM images of the grains of ~0.075–0.1 mm size; o–s close-up views of the grains ~0.5–1 mm in size (viewed under FESEM)

The clay fraction (<0.005 mm, AASHTO 1998) extracted using the precipitation method, was still dominated by microspherolitic particles (Fig. 12), but it differed from the above coarse ones in that a platy clay mineral, principally chlorite (Fig. 10), was found by close inspection as mono-crystalline particles or their aggregates (Fig. 12k, l). In addition, the maximum dimension of the clay grains was <1 μm. Most of the microspherolitic particles had a diameter smaller than ~300 nm (Fig. 12a–f) (down to <50 nm, Fig. 12e) and micrometric particles were rare. Similarly, chlorite particles were almost exclusively of the order of nanometers with very rare micron-sized examples (Fig. 12b, c, f–h).
FESEM images showing the geometry of the laterite particles of clay size extracted following the protocol in DD2014-16 (2014). a–d nm-sized grains with roughly spherulitic shape; e–f irregular aggregate; g–h elongate and microspherulitic particles with finer-gained chlorite

Analysis by EDX (Fig. 13) of the mechanically formed fractures (during the preparation of the scanned samples) and surfaces of the multi-scale spherulites showed that the main elements making up the laterite grains were Al, Fe, Ti, Mn, and Si.
Chemical compositions of the artificial fracture surfaces and the surfaces of laterite particles determined using EDX. a and b fracture surfaces of mm-scale particles; c and d surfaces of mm-scale particles; e and f surfaces of μm-scale particles

Discussion
Field and laboratory measurements revealed a number of features that distinguished the laterite below the tailings impoundment from its basin-slope counterpart. Furthermore, as a group, all of the samples collected within or near the WJWT basin were also distinctly different from other laterite deposits worldwide.
The Efficacy of Laterite as an Impoundment Liner
Geotechnical properties
The fact that the laterite studied here fell in the silty-clay domain of the USDA textural triangle (Fig. 4) suggests that the main mineral constituents were equidimensional minerals (including their aggregates) rather than phyllosilicates (with the exception of chlorite). This assertion is consistent with the grain-size distribution shown in Fig. 3 when the sizes of typical clay minerals (Rodine and Johnson Reference Rodine and Johnson1976; Godt and Coe Reference Godt and Coe2007), such as kaolinite, smectite, and illite, are taken into account; at the same time, the continuous gradation of the laterite with the small D 90 is reflective of its being clay mineral-poor, all of which can be thought of as the physical expression of the mineralogy of the laterite described above in the ‘Mineralogical constituents’ section.
The grain-size gradation indicated by the C u and C c values shows that this laterite is an appropriate material for low-permeability liners because small-scale pores develop easily in well graded (poorly sorted) unconsolidated sediments. D 10, the mean effective size value, is diagnostic of soil permeability (Terzaghi et al. Reference Terzaghi, Peck and Mesri1996). The D 10 (0.56 μm) value for the laterite under the impoundment is only about half that of the basin-slope laterite (0.95 μm), suggesting that the former is better suited than the latter to serve as an impoundment liner. This conclusion is further supported by the larger specific gravity, G s (finer secondary minerals are denser), and larger SSA value of the <0.075 mm fraction of the former (2.58; 1.33 m2/g) in comparison to those of the latter (2.53; 0.92 m2/g) (Table 1).
Similar to textural soil classification, the plasticity index, PI, and liquid limit, ωL, classify the laterite as a silt of high liquid limit in the MH domain of the Unified Soil Classification System plasticity chart (USDA-NRCS 2012), indicative of the dominance of equidimensional minerals and the scarcity of typical clay minerals, which confirms the identification of the laterite-forming minerals by XRD (Fig. 10). The result of the classification using GB 50021 (2001) also showed that the laterite under the tailings impoundment contains more fines.
The laterite mineralogy and its physical expressions (locations in various classification systems) were supported further by the measurements of the free swelling rate, i.e. indicating the absence of swelling smectite (Moon and Simpson Reference Moon and Simpson2002; Moon et al. Reference Moon, Lange and Lange2003; Das Reference Das2008; Ferber et al. Reference Ferber, Auriol, Cui and Magnan2009).
In summary, the laterite is dominated by equidimensional minerals; in particular, the discussion above of the geotechnical properties of the laterite shows that: (1) the poorly sorted laterite with a small D 90 may, to a certain extent, be a good candidate for impoundment liners; (2) the laterite beneath the impoundment, despite being in the same basin, is finer-grained and has a larger SSA than its natural counterpart on the basin slopes, meaning it has a lower permeability and is more suited to acting as a lining material. The latter, coupled with the deposit thickness of the laterite of the impoundment floor revealed during the field investigations and reconnaissance (Fig. 2), can be considered as a potentially significant finding. The presence of layers of lower permeability, larger specific surface area which is indicative of a significant sorption capacity, and greater thickness is of utmost importance for preventing downward migration of contaminants into underlying karst-water systems from karst-depression impoundment bases, which are the most vulnerable areas to seepage due to potentially highest pore-water pressures in the tailings.
That the laterite under the impoundment had a mean P-wave velocity, V psat, ~2.3 times that of the basin-slope laterite suggests that the size of individual pores (discontinuities) in the former soil mass is smaller than that in the latter. The compression tests on the laterite confirm the results of the P-wave non-destructive detection and resulting inference, with the former having a mean compression index C i of 0.13 with the mean C i of the latter ranging as high as 0.40 (Table 1, Fig. 5).
The poorly developed pore system and low compressibility of the laterite underneath the impoundment are undoubtedly very favorable for retarding migration of contaminants from the tailings. These mechanical properties can be attributed partly to the finer grain sizes, early cementation and the initial compaction prior to the storing of tailings, and the subsequent loading of further tailings are responsible for its greater degree of compaction.
Physical barrier effect
The moisture content, ω, of the laterite below the tailings porewater table remained less than that of the laterite on the basin-slope profiles measured during the dry season. This comparison apparently reflects the compaction experienced by the former laterite, and suggests that it acts to some extent as a seepage barrier, which is in reasonable agreement with the measurements of porosity, n, and saturated hydraulic conductivity, K sat, discussed elsewhere in this study.
While the preceding sections have shown that the laterite acting as the impoundment liner is finer grained, it achieves a smaller average n value of 53% when compared to the basin-slope laterite. This interesting phenomenon (Hiscock Reference Hiscock2005) can be understood easily if consideration is given to the long-term compaction it has undergone.
The difference in saturated hydraulic conductivity between the impoundment and basin-slope laterite in the WJWT basin identified during permeability tests matched the geotechnical-hydrogeological property measurements including grain-size distribution, the division of the laterite following the GB 50021 (2001), specific surface area, P-wave velocity, compression, moisture content, and porosity. Last but not least, the laterite underneath the impoundment provides permeability of <10–6 cm/s, the hydraulic conductivity guideline for impoundment liners (Vick Reference Vick1990; USEPA 1994).
In summary, the laterite beneath the WJWT impoundment has functioned as a low-permeability barrier attenuating seepage discharge into the underlying karst aquifer, and this conclusion is strongly supported by the data from both the geotechnical and the hydrogeological tests.
Composition Controls of the Laterite Properties
The chemical composition of the laterite (Table 2, Fig. 7) showed that systematic co-variations in the contents of the major constituents occur. The abundances of Fe, Ti, and Mn increased simultaneously with increasing Al (Fig. 14a–c). On the other hand, the concentrations of Ca, Mg, and Na plus K increased uniformly with Si concentrations (Fig. 14d–f). Note that the contents of Al, Fe, Ti, and Mn were inverse functions of that of Si (Fig. 14g–j), while the contents of Ca, Mg, and Na plus K were proportional to that of Si (Fig. 14d–f). In other words, the contents of Al, Fe, Ti, and Mn were inversely proportional to those of Si, Ca, Mg, and Na+K, demonstrating that the laterite under study has undergone typical laterization during which immobile laterite constituents (Al, Fe, Ti, and Mn) were enriched with the partial or complete removal of highly mobile Si, Ca, Mg, and Na+K (Davies et al. Reference Davies, Friedrich and Wiechowski1989; Kisakürek et al. Reference Kisakürek, Widdowson and Jame2004; Widdowson Reference Widdowson, Nash and McLaren2007; Berger and Frei Reference Berger and Frei2014).
Scatterplots of relationships between major-element concentrations of the laterite under the impoundment (B2, B5, and B7) and the basin-slope laterite (TP1 and TP2): a–c Al2O3 vs. the other immobile constituents (Fe2O3, TiO2, and MnO); d–f SiO2 vs. the other mobile constituents (CaO, MgO, and Na2O+K2O); g–j SiO2 vs. the immobile constituents (Al2O3, Fe2O3, TiO2, and MnO). Locations of samples are indicated in Figs 1b, c, and 2

The laterite in this case also had smaller concentrations of Si and greater concentrations of Al (Fe and Mn) in comparison to most of those reported in the literature (Ogunsanwo Reference Ogunsanwo1989; Zhu and Lin Reference Zhu and Lin1996; Sarkar et al. Reference Sarkar, Banerjee and Pramanick2006; Frempong and Yanful Reference Frempong and Yanful2008; Hong et al. Reference Hong, Li and Xiao2009; Wei et al. Reference Wei, Ji, Wang, Chu and Song2014), indicating that the laterite studied is fully developed and more mature. The molecular silica-sesquioxide ratios (SiO2/(Al2O3+Fe2O3)) (Kr) were between 0.56 and 1.76, average 0.99 with a standard deviation of 0.46. According to the criteria based on Kr (Winterkorn and Chandrasekharan Reference Winterkorn and Chandrasekharan1951; Gidigasu Reference Gidigasu1974; Madu Reference Madu1977; Camapum de Carvalho et al. Reference Camapum de Carvalho, Rezende, Cardoso, Lucena, Guimarães and Valencia2015; Okeke et al. Reference Okeke, Duruojinnaka, Echetama, Paschal, Ezekiel, Okoroafor and Akpunonu2016), the laterite is classified as true laterite (Kr < 1.33) except for TP1 which is a lateritic soil, whereas most laterites in the reviewed studies belong to the class of non-lateritic tropically weathered soils (Kr > 2.00) (Alao Reference Alao1983; Aristizabál et al. Reference Aristizabál, Roser and Yokota2005; Sarkar et al. Reference Sarkar, Banerjee and Pramanick2006; Sunil et al. Reference Sunil, Shrihari and Nayak2009; Yang et al. Reference Yang, Liu and Jin2009; Ehrlich et al. Reference Ehrlich, Almeida and Curcio2019). In only a few cases are lateritic soils found with Kr values of 1.33–2.00 (Chandran et al. Reference Chandran, Ray, Bhattacharyya, Srivastava, Krishnan and Pal2005; Chalermyanont et al. Reference Chalermyanont, Arrykul and Charoenthaisong2009; Goure-Doubi et al. Reference Goure-Doubi, Lecomte-Nana, Nait-Abbou, Nait-Ali, Smith, Coudert and Konan2014); fewer are true laterite (Akoto Reference Akoto1986).
In terms of the laterite itself within the WJWT depression, clear differences between the bulk chemical compositions of the laterite in the two target areas described above are shown in Fig. 14. The laterite beneath the impoundment showed greater levels of Al, Fe, Ti, and Mn (Fig. 14a–c) and smaller levels of Si, Ca, Mg, and Na+K (Fig. 14d–f) than its basin-slope counterpart. This appears not to be diagnostic of the greater degree of laterization of the former and should be associated with its finer grain sizes (Table 1 and Fig. 3). In other words, the difference in element level resulting from the grain-size distribution of the laterite in different locations within the WJWT depression is shown in Fig. 4. The finer-grained laterite delivered to the depression floor from the basin slopes by slopewash (Ford and Williams Reference Ford and Williams1989) should be dominated by purer products of laterization, e.g. gibbsite [Al(OH)3] and goethite [α-FeOOH], which cause the laterite under the impoundment to be rich in immobile constituents. This interpretation is supported by greater concentrations of Fe2O3(T) and lower concentrations of FeO in the lining laterite.
The LOI, varying over a narrow range (19.90–25.16%, Table 2 and Fig. 7i), indicates that the organic matter content of the laterite from both sets of locations is similar.
The chemical analysis results discussed above match the laterite mineralogy determined by XRD. The development and evolution (typical laterization), location in the classification scheme (true laterite), and the principal-component differences between the laterite in the two sites can be seen as the intrinsic controls (at the level of elements) of its geotechnical properties and physical barrier effect. These properties include grain-size distribution, textural and plastic categorization, SSA, FSR, ω, n, and K sat, which, in turn, are the physical expression of its geochemical characteristics.
Particle Geometry Controls of the Laterite Properties
The shapes of the particles in the laterite were examined to improve understanding of the controls of the mineralogy preconfigured by the chemical composition on the laterite properties. Note that the clay-mineral particles of ~5 μm in maximum dimension in fines separated from Quaternary deposits according to DD2014-16 (2014) are common (Ren et al. Reference Ren, Zhang, Xu, Zhang and Chen2016, Reference Ren, Wang, Yang, Zhou, Tang, Tian and Xu2018), but the maximum dimension of the particles extracted following the procedure proposed by DD2014-16 (2014) was <1 μm. Most of these particles were almost exclusively of the order of nanometers with very rare micron-scale occurrences. This points to the absence of typical clay minerals, such as montmorillonite and illite, and the rarity of kaolinite.
The EDX analysis showed that the main elements of the laterite grains were Al, Fe, Ti, Mn, and Si. This coincides approximately with the bulk chemical composition (Table 2 and Fig. 7) and the arguments about the evolution of the laterite, i.e. enrichment of immobile constituents and depletion of mobile ones (Fig. 14). The mineral-composition estimates shown in Fig. 13 of the laterite confirmed those from XRD (Fig. 10), such as gibbsite [Al(OH)3] and goethite [α-FeOOH], if the oxygen was considered. More generally the laterite grains were mainly the mixtures (concretions) of the oxides and hydroxides of Al with those of Fe, Ti, and Mn.
Observations by camera, SEM, and FESEM, together with the elemental analyses of the laterite particles by means of EDX, allow a visual interpretation of the laterite properties. The laterite was dominated primarily by equidimensional particles, or, more correctly, subspherolitic-spherolitic cohesionless concretions over a continuous size spectrum from <5 mm to <50 nm, despite the presence of lesser amounts of flaky chlorite in the <1 μm fraction. The smaller SSA of the spherulites compared to that of platy or flaky particles somewhat dampens the capacity of the laterite to trap and to hold porewater (Sterling and Slaymaker Reference Sterling and Slaymaker2007), which exerts an overwhelming influence on the bulk behavior of the laterite, such as the locations in the classification systems (silty clay and silt of high liquid limit), smaller free swelling rate (FSR), and greater permeability than residual soils rich in typical clay minerals.
Fortunately, the laterite, especially that under the tailings impoundment, still has sufficiently low permeability to serve as a water-retention layer because of its continuous gradation and small D 90 and D 10 values.
Barrier Effect of the Laterite
The metals and metalloids are mainly responsible for the toxicity of mining wastes (Johnson et al. Reference Johnson, Gutiérrez, Gouzie and McAliley2016). Comparison of the chemical analysis results of the heavy metals in the tailings, laterite beneath the tailings, and basin-slope laterite (Table 3, Figs 8, and 9) shows that the amounts of As, Cu, Mo, Pb, and Sn in the lining laterite are greater than those in the basin-slope laterite. These elevated levels can be ascribed to low permeability and larger SSA of the lining laterite. Its low permeability is caused mainly by the finer grains transported to the depression floor by slopewash and long-term compaction of tailings. In addition, heavy-metal accumulation may also have led to the decrease in permeability of the laterite beneath the impoundment, i.e. the laterite under the impoundment has been functioning as a seepage and adsorption barrier.
In addition, the large P2O5 content in the lining laterite (Table 1) may have resulted from the process chemicals added during milling operations (Vick Reference Vick1990) and are carried into the underlying laterite by pore water percolating through the tailings, pointing again to the barrier effect of the laterite.
Comparison of the Laterite Studied here with Laterites used as Liners in Municipal-waste Landfills Worldwide
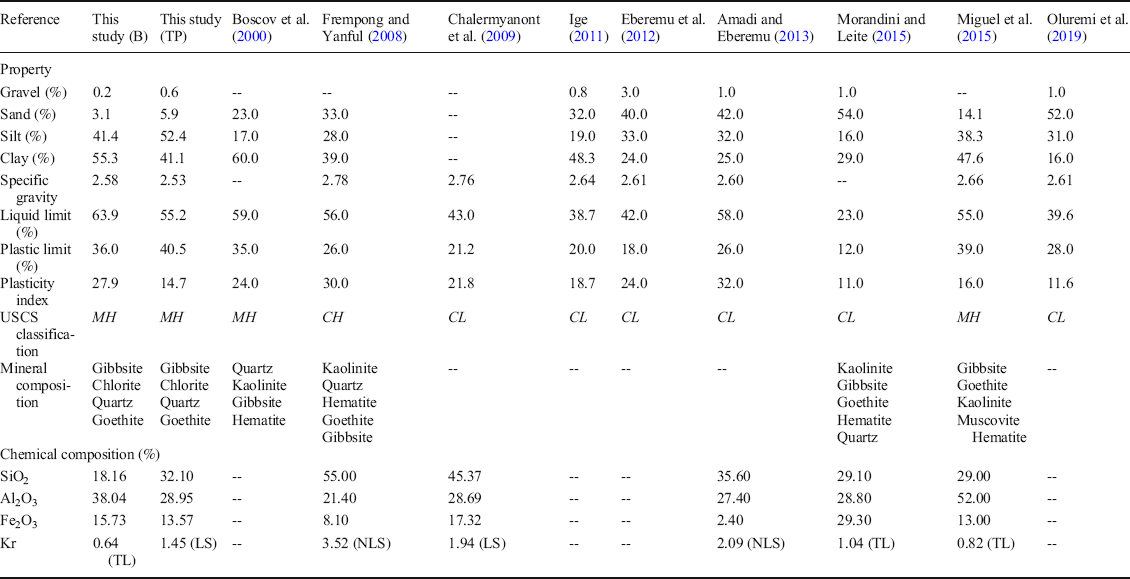
In order to understand better the barrier behavior of laterite in karst depressions, the geotechnical, mineralogical, and geochemical properties of the laterite studied here and those used in solid-waste landfills worldwide were compared (Table 4). The laterite studied here contains less gravel plus sand and more silt plus clay than others worldwide, i.e. it is finer-grained. The laterite in this case is classified as silt of high liquid limit (MH) whereas most of its counterparts in landfills are grouped as inorganic clays of low plasticity (CL) according to the Unified Soil Classification System. In addition, the laterite in this case does not contain kaolinite, and kaolinite is present in all four counterparts for which the mineralogical composition is known (Table 4). The laterite examined here should, therefore, have undergone a greater degree of laterization.
Comparison of the laterite studied here with the laterite used as liners of municipal solid waste landfills worldwide

B: borehole (the laterite beneath the impoundment); TP: test pit (the laterite from the slope above the impoundment depression). Kr: SiO2/(Al2O3+Fe2O3) (Winterkorn and Chandrasekharan Reference Winterkorn and Chandrasekharan1951); TL: true laterite; LS: lateritic soil; NLS: non-lateritic, tropically weathered soils
Conclusions
In terms of tailings-impoundment liners, the laterite underneath the Wujiwatang (WJWT) karst depression-type impoundment and the depression-slope laterite within the same polje in the Gejiu tin mine, southwest China, were investigated. The differences between the laterite studied here compared with those from elsewhere, as well as the differences between the laterite below the impoundment and its slope counterpart were established from geotechnical, hydrogeological, and geochemical perspectives.
The widely graded (<5 mm to <50 nm) and poorly sorted (a coefficient of uniformity of ~10) laterite was categorized as silty clay or silt of high liquid limit, rather than as clay. The continuous gradation, together with the small D 90 and D 10 values, suggests, however, that the laterite is appropriate for use as a lining material. As expected, the laterite under the tailings achieved the saturated hydraulic conductivities of <10–6 cm/s required for tailings impoundment liners.
The laterite beneath the tailings had finer grain sizes and lower permeability than the basin-slope laterite. The marked differences were supported consistently by almost all measurements for the geotechnical and hydrogeological parameters, including the grain-size distribution, specific gravity (G s), specific surface area (SSA), plasticity index (PI), free swelling ratio (FSR), P-wave velocity (V psat), compression index (C i), moisture content (ω), porosity (n), and saturated hydraulic conductivity (K sat). Obviously, the presence of fine-grained layers of low permeability underneath the impoundment is of the utmost importance in the control of seepage from karst depression-type impoundments.
Geochemically, the laterite was the product of laterization in the final stage which had a smaller concentration of Si and a greater concentration of Al (Fe and Mn) than that elsewhere and was classified as a rare true laterite. The main minerals identified in the laterite were gibbsite and goethite, and minor components were chlorite and quartz. Despite the occurrence of lesser amounts of flaky chlorite in the <1 μm fraction, structurally, the laterite was dominated by equidimensional particles, i.e. subspherolitic–spherolitic cohesionless grains. They were mixtures (concretions) of the Al, Fe, Ti, and Mn oxides and hydroxides.
Because of the smaller SSA of spherulites compared to platy/flaky minerals, the laterite behaved as silty clay or silt of high liquid limit. The finer particles were transported selectively to the depression floor by slopewash gave the laterite found underneath the tailings impoundment smaller D 90, D 10, FSR, C i, n, and K sat values and greater G s, SSA, PI, and V psat values compared to that on the depression slopes, and the laterite under the WJWT tailings impoundment had been acting as a barrier layer retarding most of the heavy metals. This is undoubtedly favorable to the construction of karst depression-type impoundments elsewhere in the world. The results here provide parameters for assessing and designing the liners of tailings impoundments constructed in karst depressions.
ACKNOWLEDGMENTS
This work was supported by the National Natural Science Foundation of China (41931294, U1502232, U1033601). The authors are grateful to all of the participants for their assistance in field sampling and laboratory experiments, especially to Master Tai-Qiang Yang, Zhen-Chen Shao, and Yun-Jie Yang.
Compliance with Ethical Statements
Conflict of Interest
The authors declare that they have no conflict of interest.
Funding
Funding sources are as stated in the Acknowledgments.