


Introduction
Smith Sound, located at the northern end of Baffin Bay between Ellesmere Island and Greenland (Fig. 1), is one of the channels through which the water of the Arctic Ocean and the Atlantic Ocean make contact with each other. (The term “Smith Sound” will be used in a somewhat modified way in this paper, meaning Smith Sound and its neighbouring area, as shown in Figure 1.) This area also includes the northernmost part of the polynya, the North Water. Various aspects of ice transport through Smith Sound are therefore quite important: ship navigation, offshore drilling, studies of polynya, ocean water circulation, etc. However, no systematic measurements have been made of this ice transport. It would have been extremely difficult to execute these measurements without the use of satellite data (Reference DunbarDunbar, 1973, Reference Dunbar1979).
Ice conditions in Smith Sound, April 1975. Observations are based on the imagery taken by Landsat.

The authors made intense observations of pack–ice movement in Smith Sound using the data obtained by Landsat. This paper presents an application of satellite data to the measurement of sea–ice movement.
One of the objectives of the North Water Project is to study the distribution and movement of the sea ice in the northern part of Baffin Bay: lat. 72–79° N., long. 66–96° W. It is intended the measurement be made repeatedly every 18 d throughout the daylight half of the years from 1973 to the present. The results covering the entire period will be published in the form of an atlas. The present paper shows the method and part of the results. In comparison with the rest of the investigation area, it is particularly difficult to make observations in Smith Sound. The reason for this is partly the technical limitations of the applied satellite, but the principal cause is the particular characteristics of the sound as described in this paper. Such limitations do not, however, reduce the value of the new application of satellite data; this paper therefore presents the first quantitative description of ice transport through Smith Sound.
Method
The area for the entire investigation was divided into five UTM(Universal Transverse Mercator grid) zones, Zone 15 to Zone 19, of which the upper parts of Zones 17, 18 and 19 cover the Smith Sound area. Each zone was treated separately as one plane throughout the analysis. Transparent maps at a scale of 1:1 000 000 were prepared for each zone. They were the most accurate maps available, especially for the locations of the coastlines where the Canadian Arctic Islands and Greenland are opposite one another. Landsat 1, 2. and 3 were found to be most suitable for the study because of their resolution of approximately 80 m among those satellites available for public use. Spectral band 7 (near infrared, 800 to 1 100 nm) was used most often for the analysis, while band 6 (near infrared, 700 to 800 nm) was used occasionally where band 7 was not available in reasonable quality. Imageries were obtained from the National Air Photo Library Canada and from Integrated Satellite Information Services Limited, and were in the form of positive paper prints in 9.5 inch (24 cm) format.
Once the preparations described above were completed, the actual measurement took place according to the procedure given below. Satellite imageries were placed on a digitizer desk. Local coordinates of landmarks with known real coordinates were read first. They were used to convert the local coordinates of each moving marker into real coordinates, where the local coordinates were fixed to the digitizer desk and the real ones to the Earth. A distinct ice feature, such as corner of an ice floe, a bending point of a refrozen crack or a small refrozen spot were used as markers. The coordinates of the markers were read to one tenth of a millimetre on the digitizer desk which corresponds to 100 m in real scale. The marker was found in the imagery taken on the following day and re-located. Ideally, it was intended to define a marker at every 20 km point both in the west–east and the north-south direction. As a marker was not always found where desired, the actual distance between markers was somewhat variable. The difference between the two coordinates of each marker was calculated, and this indicated the displacement of the marker in one day. The computed movement was then automatically plotted.
Several technical problems were encountered during the analysis. In general, all of them were significant, but for a particular area. Smith Sound in this case, some of the problems were less important, while others caused extreme difficulties. Four of these problems will be discussed below.
-
(1) The location accuracy was found to be as much as ± 10 km, if the latitude and longitude ticks at the edge of the frame alone were used for the re-location. This was much poorer than the accuracy figures claimed in similar studies, e.g. ± 1 to 2 km by Reference NyeNye (1975), and was suspected to be caused by imagery deformation during the photographic processing. Better accuracy could not be expected, as long as direct use of purchased prints was made for the analysis. In this study, however, a higher degree of accuracy was achieved, an expected ± 2 km at most, because the coastlines could be used as distinct markers, whose locations on the Earth were in turn precisely defined based on the map mentioned above. In other words, imagery strips without coastlines were not used for the present study. A small movement of this magnitude was, however, still within the expected position error and not reliable. This problem was less serious in Smith Sound where ice movement was quite active as presented later in this paper.
-
(2) For various reasons, the satellite picture was not always available for the following day, but it was often available for the third day, and sometimes even for the fourth day. One of the reasons for the missing imageries was the cloud cover, which concealed the sea surface. Cloud was more often observed in Smith Sound than in the other areas, with the result that there was less opportunity of observing the sea ice in this area. This was inconvenient for two reasons: first, because of a smaller overlapping area, there was less possibility of locating an ice marker on both pictures. Secondly, the ice did not move in a linear pattern; half of a two days’ movement is not necessarily equal to the movement in one day.
-
(3) When no marker was available, no measurement could be carried out. There were three different cases: first, if a field was filled with compact pack ice and no features were visible, the measurement could not be taken. The surrounding movement field might have indicated activity of the area as a whole, but an internal movement within the area was possible and was not necessarily homogeneous. If the sea surface in Smith Sound was covered at all, it was covered by thin ice. Thinner ice, having a shorter life span, had less pronounced individual characteristics, so that it looked more uniform than the older ice. Secondly, if no ice was found in the area, no observation was possible. This was, however, an indication of rapid movement during the immediately preceding days, and was a phenomenon which was very frequently observed in Smith Sound. Thirdly, if the movement was too great, the observation became impossible, partly because very little or no ice pieces were found on the succeeding pictures and partly because the rapid movement changed the form of the individual ice features. As the re-location of an ice floe could only be made based on the apparent shapes, the movement of the ice was impossible to follow if the form of the floe was not preserved for 24 h. This phenomenon was, in fact, very frequent in Smith Sound. The fact that the ice cover in the area was generally less thick encouraged easy deformation of the ice cover. The combination of both phenomena seemed to be most responsible for the difficulty in making observations in the sound.
-
(4) The ice thickness was not evaluated. All the markers presumably located on the sea ice of different thickness were treated equally, although it was unknown whether the movement field was independent of the ice thickness. As an extreme case, if an iceberg were used as a marker, whose movement was more strongly governed by the current than the pack ice, a strange movement in comparison to that of neighboring markers would be registered and it would not necessarily be apparent that this marker was an iceberg. The marker was, however, located on an ice feature of at least several hundred meters in horizontal extent as it must have had a certain distinguishable form on the picture with a resolution of 80 m. Very few icebergs beyond this size were observed in Smith Sound and it was unlikely that an iceberg would have been used as a marker.
All the problems stated above biased the results, and were caused by the limitations of the current method. Unless an improved data source were employed, there was very little that could be done. Despite these difficulties, the method offered the opportunity of observing the ice cover simultaneously over a band-shaped area of a width of more than 100 km in a relatively economical and rapid manner, and with sufficient accuracy.
Measurement
Ice movement during the period of 1–10 April 1975 was observed intensively. The distribution of sea ice in Smith Sound at this time is shown in Figure 1 (detailed description of the observation of the sea-ice distribution is given in Reference ItoIto (in press)). The observation was based on the satellite imageries taken on 7 April 1975 (bottom right of Figure 1) and on 10 April 1975 (top left). As the ice is constantly moving and changing in thickness, the distribution presented in the figure is an instantaneous one for the given dates, and is considerably different for other dates immediately before or after. Only the locations of the coastlines and of the fast-ice boundaries are assumed to be unchanged during the observation period of 10 d. The Land sat imageries taken during the period from 1 to 10 April 1975 were used for the measurement. The satellite did not cover the area before this date. It flew over the area for several days after this date, but there were no usable markers in the picture (see previous section). The imageries were taken daily at approximately 17.00 G.M.T. The imageries obtained on two succeeding days were combined to form a pair with the one exception of the pair: 3 April with 5 April (4 April imagery not available). The pairs were numbered for convenience (Table I). The measurement described in the previous section was carried out for each pair.
Measurement of the Ice Movement

The measurement was carried out for 24 h (48 h) starting at approximately 17.00 G.M.T. on day 1 and ending at the same time on day 2, where all the days are in April 1975,
The explanation of the wind pattern is given in the text.
Results
The movements of all markers observed during the whole period are plotted together in Figure 2. It should be noted that the movement field is not an instantaneous one but a combination of eight measurements. Due to the day-to-day change of the movement field, the movement at a fixed point is different from one day to another. When two neighboring points in Figure 2 have considerably different movements, this does not necessarily indicate that there is a discontinuity in the field at this location; it is more likely in this case that the two points were observed on different dates. The apparent confusion is avoided by plotting the measurements separately, as in Figures6, 7, and 8. Figure 2 serves only to present a general view of the movement field in the sound. A flow pattern, running from north to south, then rotating gradually in an eastward direction, is visible. There is an active area in the middle of the sound. Inactive zones are located between the fast-ice boundary and the active area. The ice in these zones is potentially as free to move around as that in the active zone. The northern part of the sound is very narrow (strictly speaking, this section alone makes up Smith Sound; the term "Smith Sound" is used in a generalized way in this paper, as stated before). The active zone seems to be the extension of the narrow part of the sound, and the inactive zones seem to be protected by the protruding landmasses, which face each other and form the narrow part of the sound. This lee effect of the topography, often called the "bottle-neck", suggests that the external force field is generally directed towards the south.
Ice movement in Smith Sound in April 1975 with fast-ice boundary. The magnitude of the movement is found by comparing the length of the arrow with the scale. Open circle indicates no movement observed.

Wind Patterns

Mean velocity of all 343 markers is directed 183° from the north with a magnitude of 4.2 km d−1. The mean speed (mean of the magnitude of the velocities) is calculated as 5.5 km d−1. The greatest movement was observed on measurement No. 7, 8 April to 9 April 1975, and is directed to 188° from the north with a magnitude of 34.9 km d−1. The fact that each measurement has a different number of markers was not taken into account in the calculation of the mean, i.e. the mean is not weighted.
Wind
The major forces which drive the sea ice are assumed to be sea current and wind. Very little is known about the sea current in this area, especially at this time of the year. Its day-to-day change is, however, supposed to be less than that of the wind. The difference in the movement of ice from one day to the next is assumed to be governed by the wind, but the movement pattern for a longer time period is influenced by the sea current as well.
More is known about the behaviour of the wind. The project was operating three weather stations at that time: Cape Herschel, Coburg Island and Carey Øer. The location of the stations is shown in Figures 6, 7, and 8. Station density is insufficient to allow a complete surface wind field to be set up. For this reason, the weather map was studied at the same time.
Three different patterns are found in the wind measured at the stations, each of which corresponds to different pressure distribution. The description of the wind pattern is given in Table II. Representative wind roses for each pattern are shown in Figures 3, 4, and 5. The wind data obtained at the stations were compiled from 18.00 G.M.T. on one day to 18.00 G.M.T. on the following day. Accumulated wind run for each 10° sector is plotted in the figures. The pressure distribution at 00.00 G.M.T. was taken from the Europäischer Wetterbericht, Amtsblatt des Deutschen Wetterdienstes. It is remarkable that both the measured wind pattern and the pressure distribution were classified in three patterns respectively and that they corresponded to each other. This does not mean they are the only wind patterns which can be observed in the area. There can be many other patterns and also mixtures of these patterns. The climatic observation of the project, carried out intensively from 1972 to 1974 and less intensively to the present, suggests that the weather is fairly steady in April every year and the three patterns are major ones at that time. The southerly wind at Cape Herschel in pattern I disagrees with what the pressure distribution would predict. This was neither an erroneous nor an accidental measurement, but such southerly winds were repeatedly observed. A local effect must be very strong in this area. The actual extent of this peculiar location with local wind is unknown. It is further seen that the wind at Cape Herschel is always directed along the longitudinal direction of the sound. The wind at Coburg Island and Carey Øer seems to correspond to the given pressure distributions. It would, however, be difficult to estimate the wind at the stations solely from the pressure distribution; a slight change in the form or location of the isobars would predict considerably different wind behaviour.
Wind conditions in pattern 1, measurement No. 2. The wind roses show the wind measured at the stations from 18.00 G.M.T. 2 April to 1S.00 G.M.T. 3 April 1975. Accumulated wind run for each 10° section is shown by the length of the bar. The weather map is taken from Europäischer Wetterbericht, Amtsblatt des Deutschen Wetterdienstes. Corresponding ice movement is shown in Figure 6, which also shows the location of the stations.

Wind conditions in pattern 2, measurement No. 4. The wind roses show the wind measured at the stations from 18.00 G.M.T. 5 April to 18.00 G.M.T. 6 April 1975. Accumulated wind run for each 10° section is shown by the length of the bar. The weather map is taken from Europäischer Wetterbericht, Amtsblatt des Deutschen Wetterdienstes. Corresponding ice movement is shown in Figure 7, which also shows the location of the stations.

Wind conditions in pattern 3, measurement No. 7. The wind roses show the wind measured at the stations from 18 00 G.M.T. 8 April to 18.00 G.M.T. 9 April 1975. Accumulated wind run for each 10° section is shown by the length of the bar. The weather map is taken from Europäischer Wetterbericht, Amtsblatt des Deutschen Wetterdienstes. Corresponding ice movement is shown in Figure 8, which also shows the location of the stations.

Ice movement in Smith Sound from 16.50 G.M.T. 2 April to 16.55 G.M.T. 3 April 1975. The corresponding wind data are given in Figure 3. The magnitude of the movement is found by comparing the length of the arrow with the scale. Open circle indicates no movement observed.

The ice movement of the three periods is shown in Figures 6, 7, and 8, which correspond to the wind and pressure data in Figures 3, 4, and 5, respectively. It seems generally that the sea ice moves under the direct influence of the local wind at that location. Under the wind condition given in Figure 3, pattern 1, the sea-ice movement (Fig. 6) in the southern part of the sound is directed towards the south-east, as the wind at Coburg Island and Carey Øer suggests. According to the weather map, a west-east pressure gradient was established in the area. The movement in the northern part of the sound was not observed due to the inconvenient path of the Land sat on this date. The ground observations say, not on this particular date but in general, that the ice near Cape Herschel moved in a northerly direction under the influence of the southerly wind. The movement of the ice at the most northerly part of the sound is hence assumed to be in a northerly direction. It would imply that a section of sea without ice is created somewhere in the middle of the sound, as the ice diverges both to the north and to the south. Such an open section was not found in the satellite imagery. One of the following possibilities would explain this phenomenon. If the local southerly wind is very limited in the immediate neighborhood of Cape Herschel, the open patch is not located at the middle of the sound but at the northernmost part, where such an opening exists most of the time. If the wind direction does not change suddenly through a plane but rather gradually over an extended area, no sharp dividing line is available and the ice concentration of the area is reduced instead of creating an ice-free area. If, when the wind changes direction suddenly through a plane, the sea ice does not react immediately to the change of the wind, the movement field is a continuous one and no visible ice-free area is to be expected.
Ice movement in Smith Sound from 17.06 G.M.T. 5 April to 17.12 G.M.T. 6 April 1975. The corresponding wind data are given in Figure 4. The magnitude of the movement is found by comparing the length of the arrow with the scale. Open circle indicates no movement observed

Ice movement in Smith Sound from 17.23 G.M.T. 8 April to 17.29 G.M.T. 9 April 1975. The corresponding wind data are given in Figure 5. The magnitude of the movement is found by comparing the length of the arrow with the scale.

Under the influence of wind pattern 2 in Figure 4, the sea ice moves with a large magnitude down the sound in the western part. The pressure distribution in the area represents the one under cyclone. The extension of the narrowest part of the sound is very clearly visible. Coming closer to Cobourg Island, where weak wind was observed, the ice reduces speed but maintains the southbound direction. The movement in the eastern part looks quite different. South easterly wind seems to prevail in this area. A sharp shearing line is visible at the boundary of the different movement areas. This movement pattern suggests that the current pattern similar to the one presented by Reference KiilerichKiilerich (1939, plate 3) contributes to the transport of sea ice, although his measurement was made in summer.
Wind pattern 3 in Figure 5 corresponds to the weak pressure gradient over the investigation area. The rapidly moving zone is shifted toward the east (Fig. 7) in comparison with the location of the zone as shown in Figure 6. An inactive zone is visible in the western part of the sound. The southerly wind at Cobourg Island, though weak, suggests different wind conditions in this area.
The contribution of the sea current has hardly been estimated quantitatively. It can only be said that the general assumption that the current flows from north to south through Smith Sound seems to be valid. It is clear that océanographie investigations in Smith Sound are required to clarify the influence of the sea current on the movement of sea ice.
Ice transport
Once a movement field is obtained, a calculation can be made of ice transport through a line drawn across the field. The control lines used for the evaluation are shown in Figure 9. The results of the calculation are shown in Table III. In the absence of ice-thickness data, the area of ice has to be employed, although the mass is of greatest interest. It is also to be noted that the given values are more representative of transport capacity than of actual transport, i.e. if the ice concentration is 100%, the transport through a line corresponds to the data given in the table. The quantity actually transported is obtained by multiplying the given figures by the ice concentration. For a very rough estimation of the transported mass, the mean ice thickness of 30 cm, density 0.9 Mg m−3, and ice concentration of 75% may be used; by multiplying the values given in Table III by a factor of 2 – 108, the transported mass in kilograms can be obtained.
Control lines for the calculation of ice transport. The numbers in the figure indicate the line numbers.

Transport of the Ice
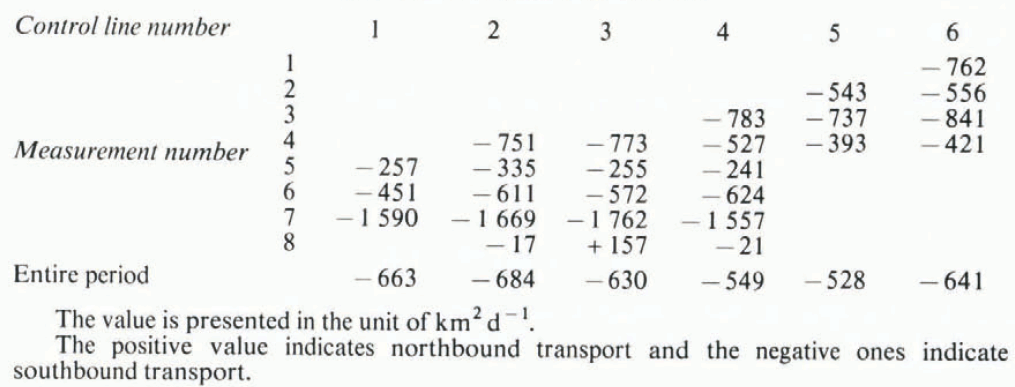
Mean ice transport is approximately 600 km2 southward through any of the six control lines. As the northern end of the sound is closed by the fast ice in Kane Basin, and the ice input through the fast-ice boundary is negligibly small (Reference Ito and MūllerIto and Muller, 1977), this amount corresponds to the ice loss from Smith Sound. This is one proof of the mechanical hypothesis of the origin of the North Water. However, this hypothesis only applies to the relatively small area discussed in this paper, and whether the hypothesis works for the North Water as a whole has not as yet been determined.
It is interesting to note that the transport amount expressed in terms of area is virtually constant for all control lines. The transport through the southerly lines is expected to be greater than through the northerly lines, as ice is constantly forming in the area. The increased ice mass in the time period passing through two lines must take the form of increased ice concentration and/or thickness. The rough estimation of the mass transport mentioned above, using constant concentration and thickness, should thus be carefully used.
The mean transport amount of 600 km2 is approximately 2% of the section of the sea north of line 6, which is not covered by fast ice. Mean life span is thus 50 d. For comparison purposes, the travel time for the longest path, from the fast-ice boundary in the north to line 6, with a speed of observed mean velocity, is 75 d.
The transport is different from one day to the next, as shown in Table III, and is in an extreme case three times as great as the mean value. The day-to-day change in the transport is the immediate result of the different movement fields under different wind conditions. However, the ice transport always remains in a southward direction, with one exception. A relatively constant southbound sea current is suspected to contribute to this phenomenon. The maximum observed transport amount suggests that a maximum of 5% of the section of the sea north of line 6 can be swept out in one day under the most favorable conditions. (Under stormy conditions, which were not encountered during the current observations, the amount may be increased, but would not be larger than a few times the maximum observed value.) Although the moving ice is a very impressive sight for the observer and the strait tends to be regarded as a transport channel, its storage effect must not be underestimated. The storage effect does not simply dampen or delay the transport but has a very complicated function as well, due to the fact that additional material is created in the storage area. Ice-thickness data for the pack ice are definitely required for further discussion of this matter.
Conclusions
The observation of pack-ice movement through satellite imagery is promising. The movement is strongly influenced by the wind at that location, which changes considerably from one point to another within a relatively short distance, and cannot easily be estimated from the pressure-distribution data due to the local topography. On the other hand, the ice-movement field can be used to some extent to evaluate the wind field. Very little consideration has been given to the influence of the sea current in this paper. Ice generally moved southbound through Smith Sound at a mean speed of 4.3 kmd−1. The greatest speed observed was 34.9 kmd−1. Eight measurements were classified in three patterns, each of which had a characteristic wind pattern. The ice transport through Smith Sound was different for different wind conditions but moved in a southerly direction with a mean value of 600 km2 d−1 or approximately 12 – 1010 kg d−1.
Acknowledgements
This research was supported by the US National Science Foundation, grant No. DPP -7826132. The ground observations were made by the North Water Project, which was subsidized by the Government of Canada (DSS Contract No. OSX4-0098), the US National Science Foundation (Contract No. GV-40404A1) and the Schweizerische Nationalfonds zur Förderung der Wissenschaftlichen Forschung (Contract No. 2.383.70). The transparent maps were made by the Digital Cartographic System, Department of Cartography, Swiss Federal Institute of Technology, Zurich. Valuable advice was given by Dr A. Ohmura during the preparation of the manuscript.



