INTRODUCTION
Little is known about the extensive trades in fishes for non-food purposes such as traditional medicines, curiosities, research and ornamental display (for example Sadovy & Vincent Reference Sadovy, Vincent and Sale2002; Vincent Reference Vincent, Côté and Reynolds2006). Fisheries landings for non-food purposes are seldom recorded because the species are often obtained by small-scale fishers in developing countries and/or are caught incidentally in non-selective gear. In the limited Customs records that do exist, non-food fishes are typically grouped in generic categories which obscure species-specific information (for example Wood Reference Wood2001; Vincent Reference Vincent, Côté and Reynolds2006). Compounding these problems is the lack of any formal international reporting system for these trades. The dearth of comprehensive, reliable data has prompted researchers to undertake field surveys, interviews (see Lunn & Moreau Reference Lunn and Moreau2004; Pajaro et al. Reference Pajaro, Meeuwig, Giles and Vincent2004), and molecular genetic research (Shivji et al. Reference Shivji, Clarke, Pank, Natanson, Kohler and Stanhope2002) to supplement the scarce institutional data and to provide a historical perspective on focal non-food fish trades.
Seahorses are among the few non-food fishes for which trade has been at least partly documented. The seahorse trade expanded substantially from the mid-1980s as China, which had little domestic seahorse production, increased imports of seahorses to meet growing demand (Vincent Reference Vincent1996). In response, small-scale fishers in Asia began targeting seahorses and other fishers began culling them from their incidental catch. Fisheries managers had little interest in any seahorse trade, presumably because it was sufficiently diffuse to appear innocuous, but field surveys in Asia revealed it to be cumulatively large and economically valuable; a minimum of 20 million seahorses were traded in 1995, with 32 countries involved (Vincent Reference Vincent1996). The majority of dried seahorses were destined for mainland China, Taiwan and Hong Kong, primarily for use in traditional Chinese medicine (TCM) and its derivatives (Vincent Reference Vincent1996). Several hundred thousand seahorses each year were also exported for use in home and public aquaria, primarily in the USA and Europe, and a large but undefined number were sold as curios (Vincent Reference Vincent1996).
Trade surveys indicated that exploitation rates in the 1990s threatened some wild seahorse populations. Fishers and traders in major exporting regions in Southeast Asia and India reported substantial declines in seahorse catches (Vincent Reference Vincent1996). The life history of these fishes increases their vulnerability to overexploitation (Foster & Vincent Reference Foster and Vincent2004), and the shallow coastal water habitats these fishes inhabit, namely mangroves, seagrasses, coral reefs and estuaries, are also threatened globally (Hodgson Reference Hodgson1999).
Traditional supply areas, particularly in Asia, have not been able to meet increased global demand for seahorses, with the consequence that trade has been expanding geographically (Vincent Reference Vincent1996; A.C.J. Vincent et al., unpublished data). However, the extent and impacts of this growing unregulated trade on wild seahorse populations were unknown, and a paucity of fisheries and trade records made assessment impossible. To address this concern, new trade surveys were initiated between 1998 and 2001 to monitor the development of the seahorse trade in Asia and previously unstudied areas (McPherson & Vincent Reference McPherson and Vincent2004; A.C.J.Vincent et al., unpublished data).
We here report the first investigation of seahorse trade in Latin America. In the late-1990s, limited official records from Asia, Europe and the USA suggested that some Latin American countries were exporting dried and live seahorses. The history, sources, magnitude and impacts of such trade, however, were unknown. In 2000, we undertook extensive field surveys in Mexico, Central and South America, to gain an overview of the entire Latin American seahorse trade. Our specific objectives were to (1) identify the major sources (gear types, areas) and amount of seahorse exploitation, (2) document the major seahorse trading areas and trade routes, (3) quantify the volumes and values of seahorses traded, and (4) identify any concerns and priority areas for future study and seahorse conservation in Latin America.
METHODS
Study species
Four of the 33 known seahorse species (genus Hippocampus) occur in Latin American waters (Lourie et al. Reference Lourie, Foster, Cooper and Vincent2004). Three species are found on the Atlantic coast: Hippocampus erectus, a medium-sized (maximum 19 cm height) deep-bodied species; Hippocampus reidi, a medium-sized slender species (maximum 17.5 cm height); and Hippocampus zosterae, the dwarf seahorse (maximum 2.5 cm height) (Lourie et al. Reference Lourie, Foster, Cooper and Vincent2004). Hippocampus erectus and H. reidi are found throughout Latin America, as far south as Argentina and southern Brazil, respectively (Lourie et al. Reference Lourie, Foster, Cooper and Vincent2004). Hippocampus zosterae is found only in the Gulf of Mexico and Caribbean, and we did not encounter it in trade. The sole species found on the Pacific coast, Hippocampus ingens, is a large species (maximum 31 cm height) with a range extending from California to southern Peru (Lourie et al. Reference Lourie, Foster, Cooper and Vincent2004). Hippocampus erectus and H. ingens are the more commonly traded of the four seahorse species; the latter is valued in the TCM trade because of its large size and smooth texture. Little research has been conducted on wild populations of these species (but see H. erectus: Texeira & Musick 2001; Baum et al. Reference Baum, Meeuwig and Vincent2003; H. reidi: Dias & Rosa Reference Dias and Rosa2003), and most parameters critical for fisheries assessment and population viability models are unknown for them (Foster & Vincent Reference Foster and Vincent2004).
Trade interviews
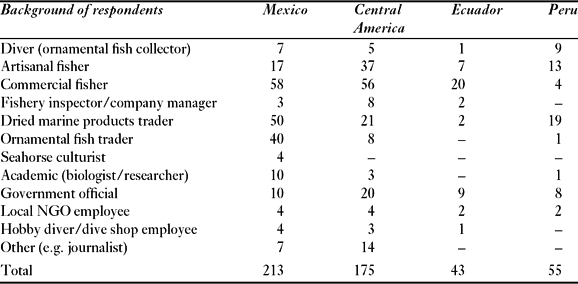
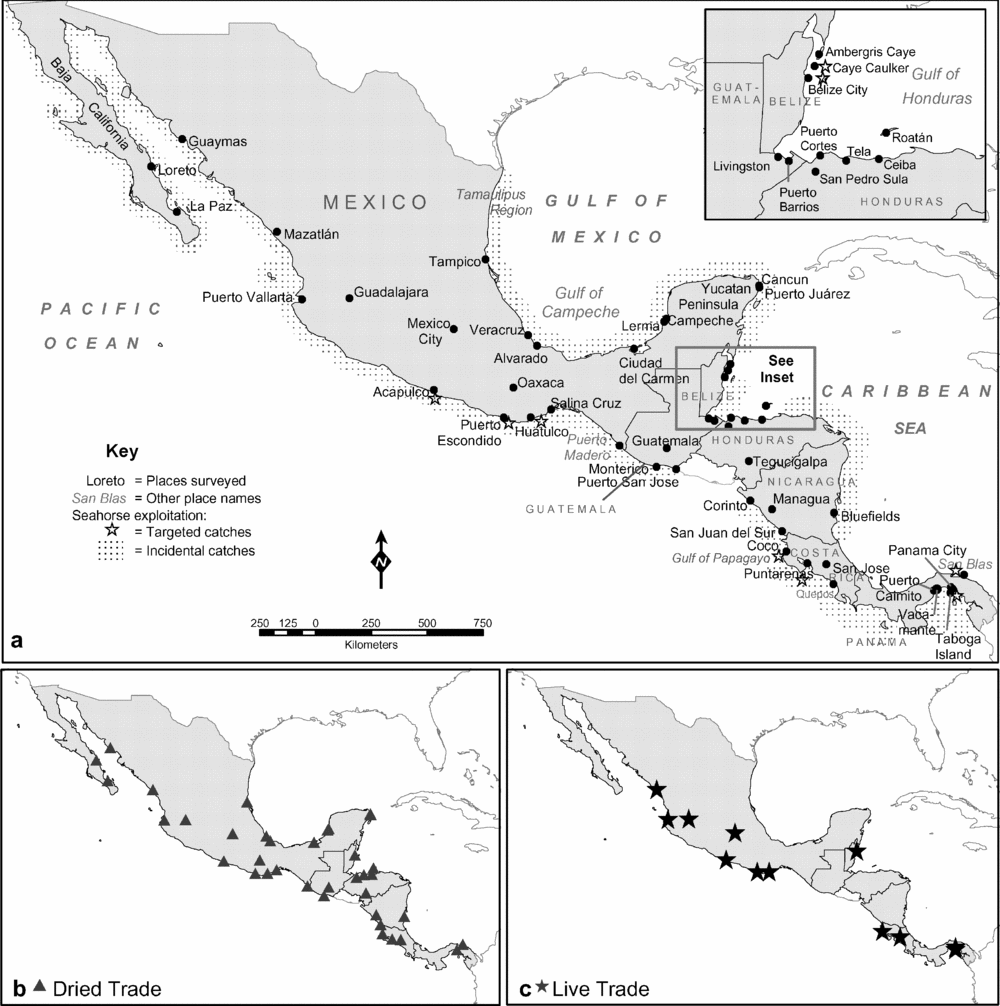
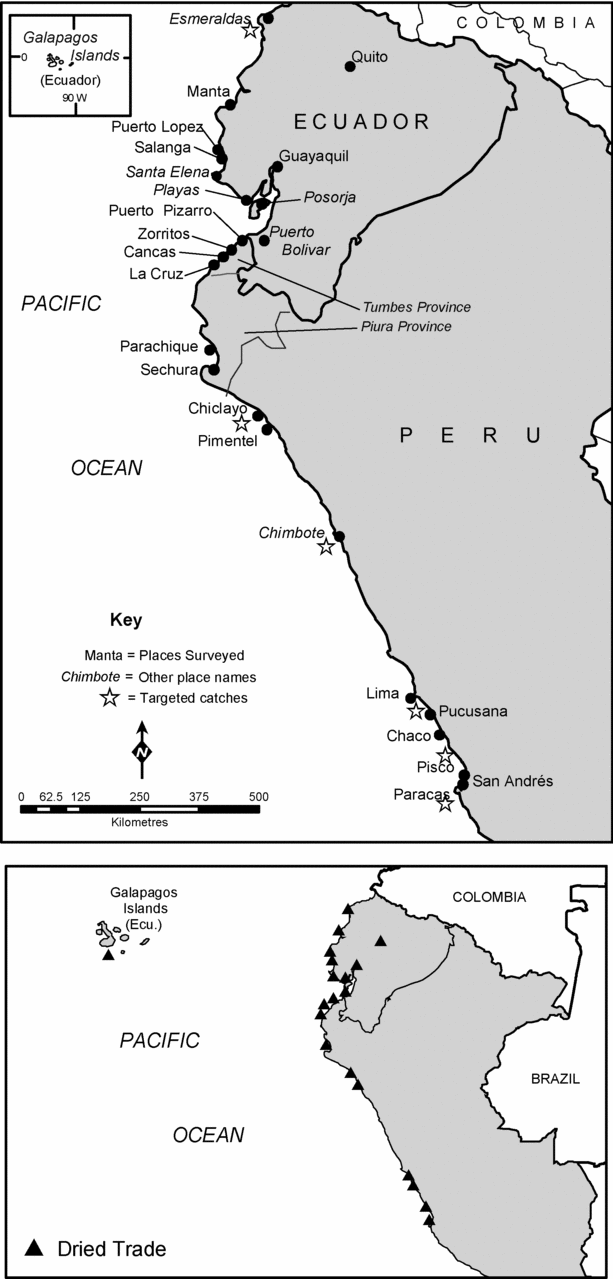
J. Baum, aided by an interpreter, conducted fieldwork in Mexico, Belize, Costa Rica, Guatemala, Honduras, Nicaragua, Panama, Ecuador and Peru between January and June 2000. We visited the capitals and other major cities, major fishing ports and fishing villages, and interviewed people connected to seahorse fisheries and/or trades in each area. In total, we visited 18 sites in Mexico, 26 sites in Central America and 19 in South America (Figs 1 and 2), and interviewed 486 people related to the seahorse trade (Table 1). Additional information on the aquarium trade was obtained through 49 brief telephone surveys of aquarium retailers in Mexico.
Number of respondents interviewed by occupation, within each country or region. Totals may not reflect the sum of columns, as some respondents were counted in two categories.

Maps of Mexico and Central America showing (a) surveyed locations, and known locations where targeted and incidental seahorse catches occurred, (b) known locations where dried seahorses were traded, and (c) known locations where live seahorses were traded.

Semi-structured interviews were conducted, usually in Spanish through the interpreter (according to the methods of Vincent Reference Vincent1996). In each interview, we sought information on the prevalence of seahorse exploitation and trade, including past and present catch levels, trade volumes (availability and demand), values and routes. In addition, we recorded information on the relative abundance of seahorses, their uses, fisheries (gear, season, areas fished) and related legislation. We cross-checked responses extensively by asking variations of the same question at different stages during an interview, and by asking the same questions of people at the same and different levels of the trade. Discussions lasted as long as respondents were willing to talk, from a few minutes to a few hours.
We refer to participants in the seahorse trade by ‘level’, where fishers, the first to handle seahorses, are Level 1, and the primary buyers are Level 2. Thereafter, levels advance through successive buyers to the exporter.
Data and calculations
For each country, we estimated the total number of seahorses caught and traded live or dried each year. We primarily relied on fishers’ and buyers’ volume estimates to calculate these totals. The validity of estimates was judged by the reliability of the respondent, based on their answers to control questions with known answers. Only some of the respondents in any given area could provide quantified estimates of volumes caught or traded, so sample sizes were lower than total numbers. We included information on changes in catch rates over time from respondents with an arbitrary minimum of eight years experience.
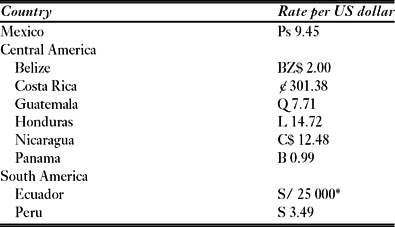
Information on trade was recorded in units used by respondents (for example seahorses per fishing trip or season), and later converted to seahorses and kilograms per year. We converted seahorse catch estimates into kilograms by using the average weight of the dried seahorse specimens obtained in each region. Annual catch rates for each fleet were estimated by multiplying fleet size (obtained from official government data in each surveyed country) by the length of the fishing season and mean catch rate estimates from fishers. Currencies were converted to US$ using the mean rate of exchange during the time of the interviews (Table 2), or the time cited by the respondent.
Mean daily exchange rate for each surveyed country during the time of the interviews in 2000. *In 2000, Ecuador adopted the US dollar at this rate. (Source: Oanda [www document] URL http://www.oanda.com/convert/fxhistory)

All trade volume estimates refer to amounts traded (throughputs) rather than amounts held (standing stocks) because only the former provides information on both the magnitude and rate of trade. Rough calculations of trade totals at any given trade level were obtained by summing throughput estimates provided by individuals at that level. We compared catch and trade estimates, and when possible compared estimates across trade levels, to provide some verification. We recognize the inherent imprecision in these methods, but a comparison of results from new surveys in Asia with previous surveys using this method, and with emerging official data in regions like Hong Kong, indicates that any bias tends to underestimate the magnitude of the trade, probably because estimates are not extrapolated beyond regions surveyed (A.C.J. Vincent, personal observation 2005).
Interview data were supplemented by examining Customs records and relevant government fisheries reports and websites, and through e-mail correspondence with people knowledgeable about the seahorse trade. Of the surveyed countries, seahorses were recorded as separate line items in Customs data only in Mexican, Ecuadorean and Peruvian records of dried exports, and in Costa Rican records of live exports. Customs data were also obtained from nations importing seahorses from Latin America. Such records were the primary source of information for Latin American countries not surveyed. We compared our trade estimates with these official records, and discuss discrepancies among sources, bearing in mind that all surveys were done before trade in seahorses was controlled (see Discussion).
RESULTS
Seahorse species, distributions and habitat
Fishers and merchants distinguished seahorses (caballito de mar) by size, rather than species. Seahorses in the live trade were also separated by colour, with large brightly-coloured individuals most valued.
On the Atlantic coast of Latin America, H. erectus and H. reidi were collected for the dried and live trades and traders did not distinguish between them. Collections of dried seahorses given to us by fishers usually included both species. We obtained 85 specimens of H. erectus weighing 0.19–12.02 g (mean = 2.39 g ± 1.87 SD [standard deviation]) and 8.1–19.4 cm in height (mean = 11.0 cm ± 1.8 SD). The 26 specimens of H. reidi weighed 0.10–4.72 g (mean = 2.45 g ± 1.47 SD) and were 5.2–14.9 cm in height (mean = 11.7 cm ± 2.7 SD). In Mexico, these seahorses were most commonly reported from areas with rocks and corals, and less frequently from seagrasses. Fishers in Central America stressed that seahorse catches occurred in areas with benthic structure, most commonly citing seagrass, sponge and algae.
On the Pacific coast of Latin America, we obtained 105 dried H. ingens specimens weighing 0.73–8.57 g (mean = 3.51 g ± 1.84 SD) and ranging in height from 8.5–23.2 cm (mean = 14.5cm ± 2.7 SD). Throughout Latin America, H. ingens were most commonly associated with algae or rocks, and were also strongly associated with soft corals and coral reefs. Fishers in Mexico reported finding seahorses at 1–55 m depth, with most caught between 20 and 35 m.
Uses of seahorses in Latin America
Seahorses were traded dried as curios in all countries surveyed except Belize. Dried seahorses were usually sold unadorned or as key chains. More rarely, seahorses were sold as ‘dragons’ with eyes and wings attached, as jewellery, or as shell craft with sea stars and shells. A few respondents believed seahorses were good luck charms, but in general people did not attach special importance to them.
Local medicinal uses of dried seahorses were limited. At least one respondent in each country mentioned the use of seahorses as folk medicine to treat asthma. In this application, seahorses were generally ground and consumed in a drink, as they are in TCM (Vincent Reference Vincent1996). Seahorses were only sold commercially as medicine by ethnic Chinese populations in the capital cities of Panama and Peru, for use as TCM.
Seahorses were traded live as aquarium fishes. In at least Costa Rica and Honduras, seahorses also had in situ commercial value; dive masters in those countries took tourists to specific sites to see these fishes.
Dried seahorse trade
Mexico's dried seahorse trade
Dried seahorses exported from Mexico, and most of those traded domestically, were caught incidentally in the country's commercial shrimp trawl fisheries. Respondents throughout Mexico repeatedly told us that shrimp trawls were the only gear that regularly caught seahorses. On both coasts, most shrimp fishers said that seahorses in bycatch were retained for sale, and no other fishers had knowledge of, or experience with, trading seahorses to exporters.
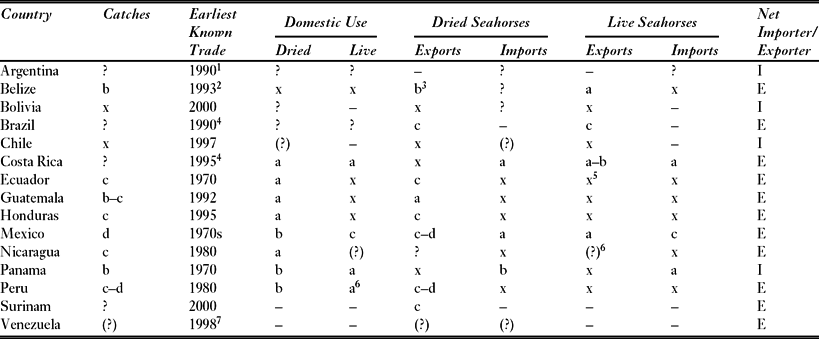
Collectively, Mexico's large shrimp trawl fleets may have caught more than a tonne of dried seahorses per year, with most entering the trade for export (Table 3). By combining reported mean seahorse catch rates with the fleet sizes and the length of the fishing season in different areas along the Atlantic coast, we estimate that a total of 125–140 kg dried seahorses may have been caught there annually (53 000–60 000 seahorses; see Supplementary material at URL http://www.ncl.ac.uk/icef/journal.htm). For the Pacific coast, we estimate that the fleet may have caught 835–1590 kg dried seahorses annually (199 000–380 000 seahorses; see Supplementary material at URL http://www.ncl.ac.uk/icef/journal.htm). The only official record of seahorse bycatch in the shrimp trawl fisheries, from Mexico's Secretariat of Environment and Natural Resources, indicated substantially greater seahorse catches than those estimated by fishers: 60 kg (∼15 000 seahorses) were reportedly caught and sold by just one boat on the Pacific coast in 1999.
Inferred roles of Latin American countries in seahorse exploitation and trade: (?) = possible, volume unknown; ? = definite, volume unknown; a = negligible: 10 kg (dried) or < 100 (live) annually; b = minor: 10s of kg (dried) or 100s (live) annually; c = medium: 100s of kg (dried) or 1000s (live) annually; d = major: tonnes (dried) or > 10 000 (live) annually; x = not occurring; – = unknown; I = importer; and E = exporter. Additional sources and notes: 1L. Magnasco, personal communication May 1999; 2D. Phillips, personal communication September 1993; 3including seahorses re-exported from Honduras; 4R. Sankey, personal communication October 1995; 5former exports (1998–1991) to Florida, J. Gomezjurado, personal communication October 1995; 6prior to 2000; and 7B. Kwan, Project Seahorse, personal communication 1998.

Within Mexico, dried seahorses were commonly traded as curios (for local sale) along both coasts from the 1990s onwards. We located 12 seahorse curio traders in three cities on the Caribbean coast and 27 in nine cities on the Pacific coast. Based on responses from 33 of them, we estimate that at least 6600–8100 seahorses (20–24 kg) were sold annually in this trade (Table 3).
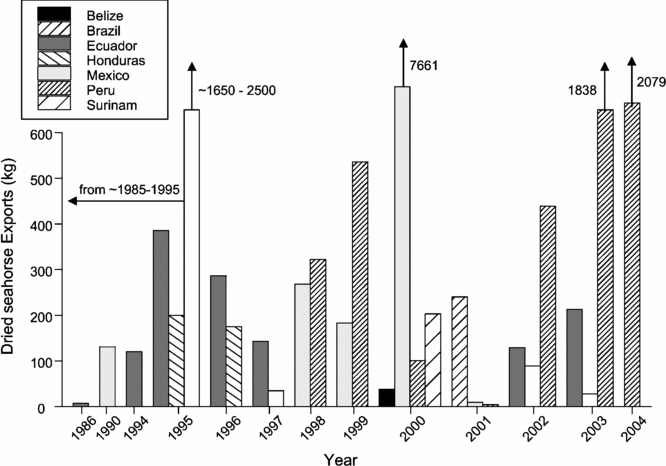
Mexico apparently began exporting dried seahorses in the mid-1980s. Nine fishers told us that large quantities of seahorses were exported from Salina Cruz and Puerto Madero (Fig. 1) to Japan (which uses a form of traditional medicine derived from TCM) between approximately 1985 and 1995. Fishers reported that catches then ranged from 180–3000 seahorses per 15-day trip (mean = 1700 month−1 boat−1, n = 7 reports), many times more than fishers reported for the year 2000. No exporters from this earlier trade could be located for interviews and no official records of it exist, but such catch estimates suggest substantial exports. Japanese exporters were said to have bought all available seahorses, and if they had accessed bycatch from even one third to half of the boats in this area, they could have exported 1650–2500 kg dried seahorses each year (400000–600000 seahorses; Fig. 3). Fishers involved in this trade said the exporters were interested only in purchasing large quantities of seahorses, and had left because of declining catches.
Seahorses continued to be exported from the Pacific coast in 2000, but primarily from the two major ports in the north, Guaymas and Mazatlán (Fig. 1), where fishers, local traders and fisheries officials were familiar with recent trade. They told us of five seahorse exporters who operated from those ports (none of whom could be interviewed), and said seahorses were exported to Asia, and to mainland China in particular.
Respondents on the Atlantic coast also knew of several seahorse exporters. Seahorses were apparently exported by shark fin traders: two Level 2 buyers in Lerma told us they had gathered seahorses from shrimp fishers for sale to shark fin buyers since 1990, and two other respondents there were familiar with this trade. Fishers in Cancún described three different Level 2 buyers believed to be exporters, two of whom had traded seahorses between 1986 and 1992, and one who had traded seahorses (and dried pipefish) since 1996. Other fishers in Ciudad del Carmen, Lerma and Cancun reported that, in 2000, buyers from elsewhere in Mexico came to their ports to buy seahorses from local boats.
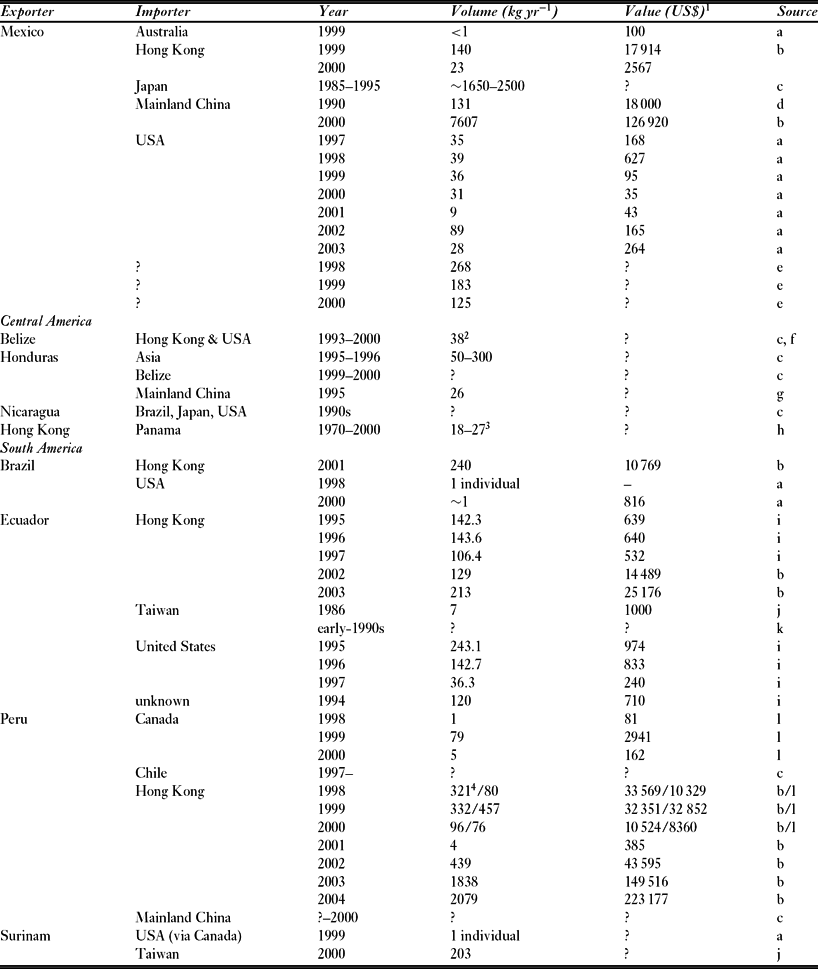
Official records from Hong Kong, mainland China and the USA all showed imports of dried seahorses purportedly originating in Mexico (Table 4). Available Customs data suggests that total dried seahorse exports from Mexico have varied greatly interannually from 9–7661 kg yr−1 (Fig. 3). The earliest official record of seahorse imports from Mexico is from 1990, when mainland China listed Mexico as its fourth largest seahorse supplier (Table 4). Although Mexico is not cited in later records from mainland China (1993–1999), Hong Kong records listed one import of 7630 kg of dried seahorses originating from Mexico in 2000, of which 7607 kg were apparently re-exported to mainland China (Table 4). This quantity exceeds our annual seahorse bycatch estimate, suggesting either that fishers greatly underestimated seahorse bycatch (by at least threefold), or that seahorses in the shipment arriving in Hong Kong had been amassed over several years. Mexico's Customs data appear to corroborate this record: between May 1999 and November 2000, the Mexican government issued three sets of permits, each to export similar quantities of seahorses (from 7054–7080 kg; see Supplementary material at URL http://www.ncl.ac.uk/icef/journal.htm). Additionally, Mexico's own Customs data list showed exports of a few hundred kg yr−1 between 1998 and 2000 to unknown destinations (Table 4), while USA Customs data showed an average of 38 kg dried seahorses being imported to the USA from Mexico each year between 1997 and 2003.
Interview estimates and official trade records of dried seahorse exports from, and imports to, Latin American countries. 1Values are rounded to nearest dollar; 2minimum; 3in 2000; 4numbers reported with a/indicate two different data sources. Sources (including years available for Customs data): a = USA Customs data (1996–2003); b = Hong Kong Census & Statistics data (1998–2004); c = interviews in listed export country; d = mainland China Customs data (1990, 1993–1999); e = Mexican Customs data (1998–2000); f = interviews in Honduras; g = Honduran government (DIGEPESCA); h = interviews in Panama; i = Ecuadorian agency data (described in Supplementary Material; 1991–2000); j = Taiwanese Customs data (1983–2002); k = J. Gomezjurado, personal communication October 1995 & September 1999; and l = Peruvian Customs data (1998–2000). See Supplementary material at URL http://www.ncl.ac.uk/icef/journal.htm

Central America's dried seahorse trade
Within Central America, the domestic seahorse trade for curios or traditional medicine occurred through only a few vendors and locations. Dried seahorses were traded as curios in each country surveyed, except Belize. In Guatemala and Panama, seahorses were also traded as folk medicine and TCM respectively. Curio and folk medicine traders (Level 2) obtained seahorses from shrimp trawl fishers, but in Costa Rica one buyer imported them from the USA, and in Panama divers on the Caribbean coast also supplied the trade. In total, based on information from nine of the 12 curio traders, we estimate that seahorse curio sales in Central America amounted to 7–11 kg (2800–4200 seahorses) per year. The largest market for dried seahorses in Central America was, however, for use as TCM: three retailers in Panama City's Chinatown imported an estimated total of 18–27 kg dried seahorses annually from Hong Kong. These included H. spinosissimus and H. trimaculatus, which are found in the Red Sea and Indian Ocean, South-east Asia and Australia, and H. ingens, which occurs only on the Pacific coast of the Americas.
Central America's main source of seahorses for export was Honduras. Seahorses there were primarily caught by Roatán's shrimp trawl fleet, which consisted of 130 boats that fished mainly off Honduras’ north-eastern coast. Seahorse bycatch was reportedly highly dependent on the specific location fished. Monthly seahorse catch estimates by 11 fishers were 0.1–3.4 kg dry weight per boat (mean = 0.99 kg); a fisher deemed the 220 seahorses (0.59 kg) he showed us from a month-long trip to be an average amount for a trip of that length. Based on these estimates, the total fleet may have caught 540–900 kg annually (see Supplementary material at URL http://www.ncl.ac.uk/icef/journal.htm).
Eight respondents in Honduras reported that seahorses had been exported to Asia for about two years, probably 1995 and 1996. During that time, buyers from Asia sent seahorses caught by Roatán's fleet to mainland China or Japan. The five Honduran shrimp fishers we interviewed who were familiar with the trade, described it as having been pervasive, with buyers purchasing seahorses from all shrimp boats. By cross-validating accounts from fishers and Level 2 buyers, we estimate that at least four groups of exporters traded a total of 100–300 kg of seahorses in one year and two exporters traded a total of 50–300 kg the following year (Fig. 3). These figures are imprecise because none of the exporters was present in 2000 to be interviewed, and fishers and buyers had little knowledge of the details of trade levels above them. The only official record of these exports was obtained in the Fisheries Department in Tegucigalpa: in 1995, a Chinese man was detained at the border attempting to export 7196 seahorses (∼26 kg) and 39 pipefish (230 g) without a permit. Thereafter, fishers and buyers perceived the trade as illegal, and the export of seahorses from Honduras direct to Asia appeared to have ceased in the late-1990s partially as a consequence. Fishers also reported that Asian traders left because of insufficient seahorse availability.
Despite no domestic trade, Belize exported dried seahorses from both its own, and Honduran, waters. Belizean exports were first reported in 1993 (D. Phillips, personal communication September 1993), and persisted in 2000, with seahorses being traded through six Chinese restaurants in Belize City, according to local fishers and fisheries managers. Three fishers in La Ceiba and Roatán (Honduras) also told us that Belizean buyers had purchased seahorses from them (0.5–3.6 kg each) in 1999 and 2000. We visited the six restaurants in Belize City, but only at one of them, where a sign advertised that they purchased seahorses for US$ 83 kg−1, did the owner admit to trading seahorses. She obtained seahorses both from local shrimp fishers and the Honduran fleet for export to Hong Kong and Miami (USA) and had sent ∼0.9 kg dried seahorses to her buyer in Miami the previous week. If representative of her average weekly shipments during the 10½ months the Belizean or Honduran fleets fished, this exporter would have traded 38 kg annually (Table 4). The other five Chinese restaurants were said to purchase similar amounts after each fishing trip. Although the three Belizean shrimp trawlers probably only caught about 41 kg of dried seahorses each year, by accessing the Honduran trawl fleet, Belizean exporters could potentially have purchased over 500 kg dried seahorses annually. Dried seahorse exports from Belize may therefore be much higher than we can currently substantiate.
Elsewhere in Central America, seahorse exports were reported only from Guatemala and Nicaragua. One fisher in Guatemala told us that, in 1992, a Mexican had purchased seahorses from local trawlers, probably amounting to 4–6 kg. In Nicaragua, although seahorse exports were reported by many sources, including a fisheries official, the variability in knowledge of the trade suggests that no trade route was well-established, and we were unable to quantify exports. In Costa Rica and Panama, although the shrimp fleets were as large as in Honduras, we found no evidence of seahorse exports sourced from them or any other fishery.
South America's dried seahorse trade
Peru had the largest known domestic seahorse trade in South America, with smaller trades occurring in at least Argentina (F. Navarro & N. Britos, personal communication April 2000; R.González, personal communication Jan 2001) and Ecuador (Table 3). Peru's domestic trade in curios and TCM was supplied by artisanal fishers and divers. The curio trade involved at least 23 Level 2 buyers in seven locations along the coast, whose combined trade estimates totalled 1300–4100 seahorses (5–15 kg) annually. In Lima's Chinatown, one TCM shop had sold unknown quantities of seahorses since 1993, while a second had sold 13 kg in the 15 months (∼10 kg or 2800 seahorses annually) since opening in 1999.
Seahorses have been exported from Peru to at least Canada, Hong Kong and mainland China. Artisanal and commercial fishers in Tumbes and Piura provinces, and divers in the Pisco area, said they had supplied seahorses to buyers, whom they believed to be intermediaries for exporters, since 1995–1997. Based on accounts and quantitative estimates from several fishers and five other respondents, we estimate that exporters had access to at least 415 kg dried seahorses annually. The two exporters we interviewed owned TCM shops in Lima's Chinatown (described above), and obtained seahorses year-round from fishers in Tumbes and Piura. The first business had exported seahorses since 1993, but was not listed in official records, probably because their exports of small quantities of seahorses (estimated at 6–9 kg yr−1) by visitors from Hong Kong and mainland China were not declared. Employees at the second business said they had exported seahorses to Hong Kong and Venezuela since 1999 and that seahorse supply did not meet demand. According to Peruvian Customs data, this was the third largest seahorse exporter, recorded as sending 94 kg dried seahorses to Hong Kong in 1999. Peruvian Customs data for 1998–2000 listed exports to Hong Kong by four other businesses, as well as to Calgary and Montreal, Canada by three other businesses (Table 4; see Supplementary material at URL http://www.ncl.ac.uk/icef/journal.htm). In southern Peru, two respondents reported that a few kilograms of seahorses also were exported for curios to Chile in the late-1990s, and a Level 2 buyer knew of exports to Bolivia in 2000. Peru's international seahorse trade continued after our surveys: Hong Kong reported importing 1838 kg and 2079 kg of dried seahorses from Peru in 2003 and 2004 respectively, the largest amounts ever recorded as traded by Peru (Table 4).
The earliest official record of Ecuador's seahorse trade was from Taiwanese Customs data for 1986 (Table 4). Although Taiwan has not recorded any other imports from Ecuador, one Ecuadorian biologist observed trade between divers and Taiwanese merchants in the Galapagos Islands from 1991–1995, and two other biologists observed seahorses being traded on the islands in 1994. Reports from another biologist working on the Galapagos Islands suggested that the seahorse trade continued in 2000, with divers there gathering seahorses upon request from Asian sea cucumber exporters.
In mainland Ecuador, seahorses were exported from at least Guayaquil and Manta, the two major fishing ports we surveyed, probably beginning in the late-1980s. Seahorses were primarily taken incidentally in the shrimp trawl fishery, and we estimate that this fleet caught a minimum of 113–271 kg dried seahorses (30 000–72 000 seahorses; see Supplementary material at URL http://www.ncl.ac.uk/icef/journal.htm). Eleven fishers at the two ports told us they sold seahorses either through intermediate buyers, or directly to various Ecuadorian or Chinese exporters (Level 2–3) who also sought shark fins. Of the two Level 2 buyers we interviewed in Manta, one knew of a Chinese exporter who purchased seahorses from 1995–1997 and several Level 2 buyers in Guayaquil purchasing seahorses in 2000, while the second had sold seahorses to a Chinese exporter over the course of a year (probably 1999). Fishers mentioned that seahorses were also traded at other major ports including Posorjas and Esmeraldas (Fig. 2).
Maps of Ecuador and Peru showing (a) surveyed locations, and known locations where targeted seahorse catches occurred, and (b) known locations where dried seahorses were traded.

Ecuador's official records listed five exporters based in Guayaquil and Manta as having sent dried seahorses to Hong Kong, Miami and New York from 1994–1997, totalling >100 kg yr−1 (Fig. 3; Table 4). These records seem comparable to our annual seahorse bycatch estimate for Ecuador's shrimp trawl fleet (but see Supplementary material at URL http://www.ncl.ac.uk/icef/journal.htm). Although official Ecuadorian records ended in 1997, fishers in Guayaquil and Manta noted that Ecuadorian trade in seahorses continued between 1998 and 2000, and Hong Kong's Census and Statistics data documented imports of a few hundred kilograms of dried seahorses from Ecuador in both 2002 and 2003 (Table 4).
Total weight of dried seahorses (>5 kg) reportedly exported from Latin American countries for the years 1986–2004.

Dried seahorse imports to Asia have also purportedly originated in Latin American countries other than those we visited: over 200 kg of dried seahorses were reportedly imported by Taiwan from Surinam in 2000 and by Hong Kong from Brazil in 2001 (Table 4).
Value of dried seahorses
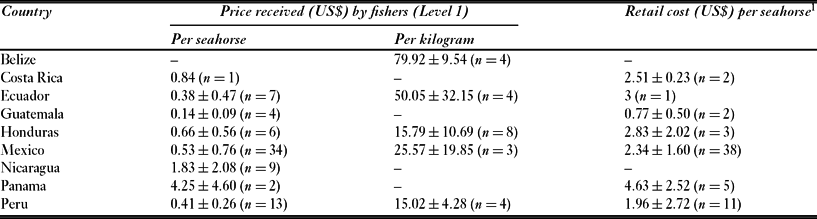
The value of dried seahorses increased substantially at each trade level. Fishers were usually paid around US$ 0.65 per individual seahorse, but occasionally more, particularly if selling directly to tourists (Table 5). Seahorses did not comprise a major portion of fishers’ and traders’ incomes in any of the countries we surveyed, except perhaps at times of steady trade with exporters. In general, fishers said the extra income made the trade worthwhile, especially if buyers purchased large quantities (for example, by the kilogram for the export market). At the retail level, seahorses sold as curios generally cost only a few dollars (Table 5), but when made into art pieces cost over US$ 10. When sold as medicine, imported seahorses in Panama cost US$ 2.75–15.00 each, and soup containing seahorses in Peru cost US$ 10 a bowl.
Comparison of the mean value of dried seahorses±one standard deviation (n = sample size) within surveyed Latin American countries. (1Unadorned, for sale as curio.)

Dried seahorses were an expensive marine commodity when exported (Table 4). Declared values for seahorses imported by Hong Kong from Latin America were US$ 45–112 kg−1 (Hong Kong Census and Statistics data). Imports by mainland China from Mexico in 1990 were valued at US$ 137 kg−1 (Chinese Customs data) and imports by Taiwan from Ecuador in 1986 were valued at US$ 143 kg−1 (Taiwanese Customs data). Seahorses were apparently undervalued in Ecuador's own Customs records (US$ 5 kg−1), considering that suppliers were reportedly paid about US$ 50 kg−1 by exporters and that seahorses from Ecuador were the most highly valued from Latin America, according to official data from Hong Kong and Taiwan. Exporters in Peru reportedly sold seahorses for over US$ 150 kg−1.
Live seahorse trade
Mexico's live seahorse trade
Live seahorses were traded in substantial numbers in Mexico. We estimate that in 2000 between 8200 and 14600 live seahorses were traded there on its domestic market. Seahorses were imported to, and captive-bred in Mexico. They were also caught in Mexico, despite the fact that it had been illegal to catch and trade wild seahorses (unless caught incidentally) since 1994. Most seahorses were routed through two wholesale aquarium markets in Mexico City that distributed ornamental fish throughout the country. We interviewed two aquarium wholesalers who began trading seahorses in the mid-1980s, and 12 others who became involved in the 1990s. We also located 54 retail aquarium shops in Mexico that reportedly sold seahorses, although only 14 had them in stock.
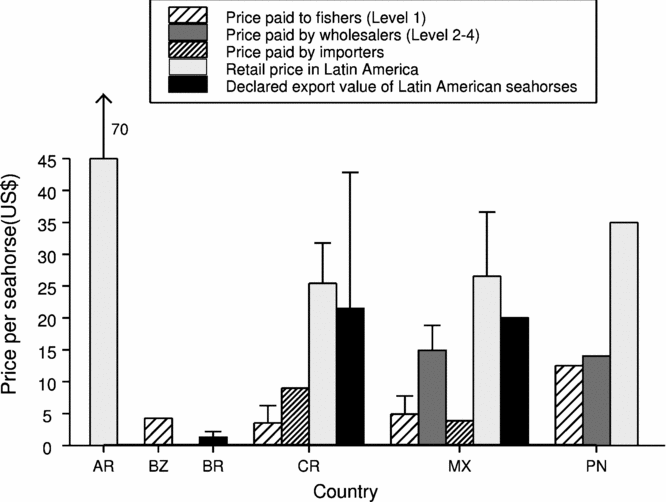
Estimates from seahorse wholesalers suggest that about half the live seahorses traded in Mexico were imported. Seahorses were reportedly imported from Brazil, Fiji, Hawaii, Indonesia, and the Philippines. Traders could apparently obtain more types and colours, and often cheaper (and legal) seahorses, by importing (Fig. 4). The only official record of this trade came from USA Customs data, which listed 44 live seahorses as being re-exported from the USA to Mexico in 1996 from unknown source countries. That this one record accounted for more than half of all the USA's documented seahorse exports in 1996 suggests that USA Customs records were incomplete. Moreover, the USA companies which Mexican importers cited as their sources of seahorses were not included in USA Customs records, and wholesalers in Mexico City reported imports of live seahorses throughout the late 1990s and 2000, not just in 1996.
Comparison of the mean value of live seahorses (± 1 SD) in US$ among Latin American countries and trade levels: amount paid to fishers (Level 1); amount paid by wholesaler (Level 2–4) for native seahorses; amount paid by buyers importing seahorses to Latin America; retail price of seahorses within Latin America; and declared price of seahorses reportedly exported from Latin America. Country codes are: Argentina (AR), Belize (BZ), Brazil (BR), Costa Rica (CR), Mexico (MX), and Panama (PN).

Wild seahorses were targeted by divers on the Pacific coast, and accounted for one-quarter to one-third of seahorses in Mexico's live trade; the remainder were captive-bred. Estimates from three divers in Acapulco suggest that collectively their dive co-operatives may have caught a minimum of 2800–4100 seahorses annually, and that buyers always purchased all available seahorses. According to buyers, a few thousand seahorses had been supplied from Acapulco to Mexico City each year since 1992. Cross-validating quantities reported by eight traders (Level 2–3) and three divers in Acapulco and Puerto Escondido provides a total estimate of 2100–5000 wild seahorses supplied to Mexico City in 2000.
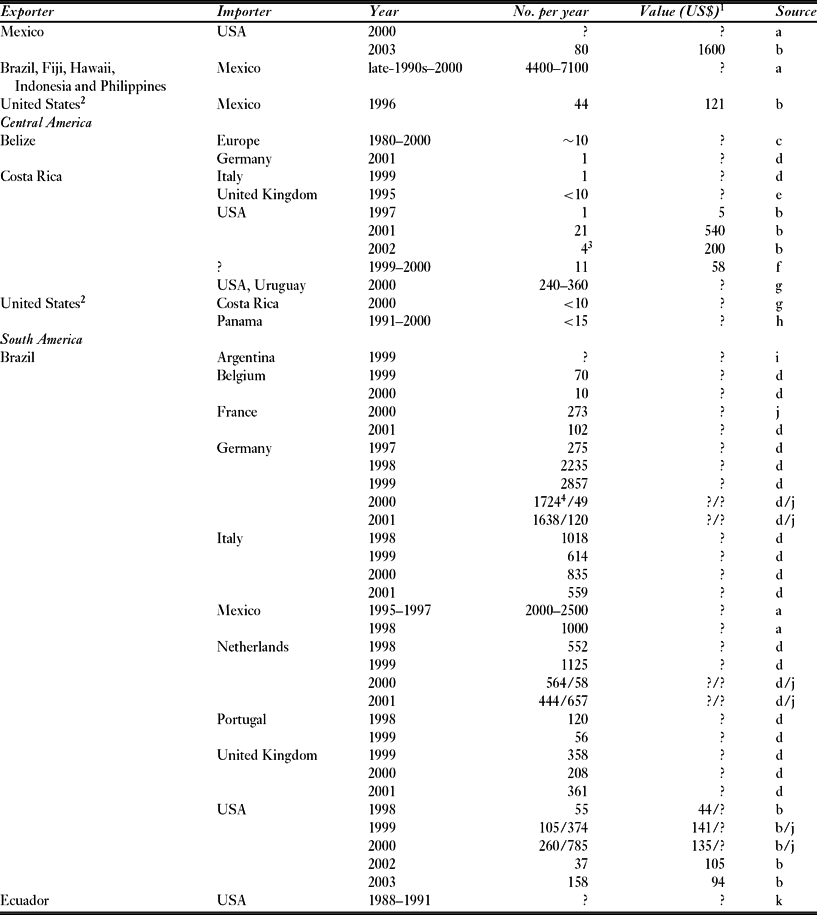
Mexico has exported live seahorses, although little is known about this trade. Seahorses were reportedly sent from Puerto Vallarta to Los Angeles in unknown quantities prior to 1994. By 2000, however, because exporting wild seahorses was prohibited, respondents were reluctant to discuss this trade. One wholesaler in Mexico City admitted to us that he typically exported about 1000 live seahorses annually. USA Customs records only document imports of 80 live seahorses from Mexico in 2003 (Table 6).
Interview estimates and official trade records of live seahorse exports from, and imports to, Latin American countries. 1Rounded to the nearest dollar; 2source country unknown; 3reported as captive-bred; and 4numbers reported with a/indicate two different data sources. Sources (including years available from Customs data): a = interviews in Mexico; b = USA Customs data (1996–2003); c = interviews in Belize; d = European Customs data (1997–2001); e = R. Sankey, personal communication October 1995; f = Costa Rican Customs data (INCOPESCA) (1997–2000); g = interviews in Costa Rica; h = interviews in Panama; i = L. Magnasco, personal communication May 1999; j = Global Marine Aquarium Database (World Conservation Monitoring Centre 2002); and k = J. Gomezjurado, personal communication October 1995.

Rest of Latin America's live seahorse trade
Apart from Mexico, the domestic trade in live seahorses was very limited. (Tables 3 and 6). Argentina (F. Navarro & N. Britos, personal communication April 2000; R. González, personal communication January 2001), Costa Rica and Panama each had small live trades (∼10 seahorses annually in each of the latter two countries) involving both wild-caught and imported seahorses. In Costa Rica, seahorses were primarily caught by divers on the Pacific coast. Although official records showed very small total catches (20–156 seahorses annually from 1996 to 1999), estimates from four respondents in Costa Rica suggest that annual catches probably totalled almost 1000 seahorses. In Panama, two divers supplied an aquarium retailer with seahorses, and the indigenous Kuna of San Blas also reportedly began targeting live seahorses in 1998, but no details of this trade could be obtained. A small domestic trade had also occurred in Peru, at least during the 1997–1998 El Niño event when seahorses were locally more abundant. We found no evidence of domestic live seahorse trades in 2000 in the remaining countries we visited.
Brazil appeared to be the only major exporter of live seahorses in Latin America (Table 3). Annual estimates of seahorses imported from Brazil totalled 3104–5185 individuals for years when both European and USA Customs data were available (1998–2001; Table 6). Of the countries known to import seahorses from Brazil, Germany and Italy have typically accounted for two-thirds of all imports (Table 6). The apparently limited imports of live seahorses from Brazil to the USA, the world's largest market for marine ornamental fishes, probably reflects under-reporting in USA Customs data. For example, the Global Marine Aquarium Database (GMAD) has recorded live seahorse imports from Brazil to the USA threefold greater than official USA records (Table 6).
Small numbers of live seahorses also have been exported at least from Belize, Costa Rica and Ecuador (Table 6). One trader in Belize had exported a few live seahorses to Europe each year since 1980, and exports from Ecuador to the USA occurred from at least 1988 to 1991 (J. Gomezjurado, personal communication October 1995). Imports from Costa Rica (to the UK) were first noted in 1995 (R. Sankey, personal communication October 1995). Officially, European and USA Customs data cite only three records of seahorse imports from Costa Rica, all since 1996, with a maximum of 21 seahorses in 2002 to the USA, and Costa Rican records showed exports of only 11 seahorses, between December 1999 and February 2000 (Table 6). Trade by the largest known seahorse exporter in Costa Rica, whom we estimate received at least 240–360 seahorses per year from divers, purportedly for export to the USA and Uruguay, was not included in any formal records. Total catch estimates, and trade by this one exporter, suggest that live seahorse exports from Costa Rica may have been much higher than official data indicated.
Value of live seahorses
The value of live seahorses varied among countries, and increased substantially with trade level within each country (Fig. 4). Divers were usually paid US$ 0.64–5.00 per seahorse (Fig. 4). At the retail level, seahorses in Latin America usually sold for US$ 25–35 each, often 10 times as much as divers were paid for them. Declared values of live seahorses exported from Latin America varied enormously, even among shipments from the same country. Seahorses imported to the USA from Brazil were valued as little as US$ 0.52 each, while wild seahorses imported from Costa Rica were valued at US$ 5–25 each (Table 6; Fig. 4).
Conservation concerns
Of the 115 experienced respondents who felt able to comment about changes in seahorse bycatch rates over time, 88 said they had decreased. Among these respondents, the proportion who reported declines was lowest in countries where seahorses had not been heavily traded: only a slight majority of respondents in Belize, Costa Rica, Nicaragua, Panama and Peru (n = 21 of 36) believed they caught fewer seahorses than in the past. In contrast, of the experienced shrimp trawl fishers in Mexico who commented on changes in seahorse catch rates, 21 of 24 on the Caribbean coast and 18 of 21 on the Pacific coast said they had diminished over time. Seven of these Pacific coast fishers specifically attributed the declines to overexploitation and the seahorse trade. Four fishers and a fishery inspector in Guatemala (n = 5 of 7), and 10 of 12 fishers in Honduras said seahorse catch rates had declined. The fishers in Honduras blamed the intense trawl pressure for the decline in seahorses and marine life in general. In Ecuador, 13 of 15 fishers who commented reported seahorse declines. Three of these fishers attributed the decline to cold waters resulting from the previous El Niño event (1997–1998), but six others cited heavy fishing pressure or the trade as the cause of the declines. All remaining respondents who commented said that seahorse catch rates had been stable over time.
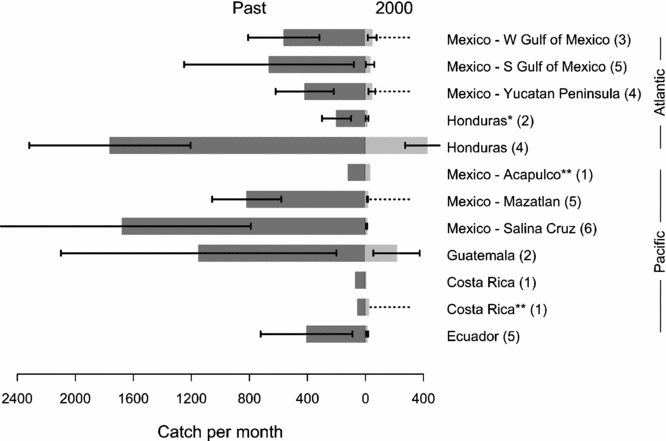
Few respondents (n = 37) were able to quantify changes in catch per unit effort (CPUE) of seahorses taken incidentally, but estimates from those who did suggest that very substantial declines had occurred. Mean estimated CPUE declines were > 75% in all regions on both the Atlantic and Pacific coasts of Latin America (Fig. 5). Indeed, shrimp trawl fishers reported declines in CPUE > 90% in of the Gulf of Mexico, on the Pacific coast of Mexico and in Ecuador (Fig. 5).
Estimated changes in average seahorse catch per month (±95% confidence interval) in different areas of Latin America according to respondents with experience catching seahorses (≥8 years) who said seahorse abundance had changed over time. For catch estimates, respondents referred to past reference points (sometime between 1970 and 1992) based on their own experience, and were asked to compare these to the same area using the same gear type in 2000. Sample sizes for each area are included in brackets. Estimates refer to *artisanal fisheries, **divers, and otherwise refer to commercial shrimp trawl fisheries.

Targeted seahorse fisheries may have contributed to localized seahorse declines. Six of seven respondents in Mexico and five of six in Costa Rica who commented on directed seahorse fisheries said that seahorse abundance or supply had declined. Estimated declines exceeded 50% in both countries (Fig. 5). The two divers we interviewed in Panama, one from each coast, also believed seahorse abundance had declined.
As in many countries, Latin American fisheries catching seahorses were unmonitored and fisheries regulations were often not enforced. There had been no catch rate monitoring of seahorses (or any other incidentally caught species) in any of the trawl fisheries we surveyed. According to fishers and fisheries officials, seasonal and area closures for trawl fisheries were often not respected, particularly in remote areas difficult to monitor, like the Caribbean coasts of Honduras and Nicaragua. In Ecuador, the trawl fishery had no spatial closures, nor had the normal seasonal closure been implemented in 1999 or 2000. Seahorses also were illegally targeted in Mexico for the live trade. Both Mexico and Guatemala had established marine reserves, but the level of enforcement within them was unknown.
Most of the seahorse trade in Latin America had gone unreported. Where permits were required for the export of dried seahorses (as in Honduras and Nicaragua) or live seahorses (as in Costa Rica), traders usually lacked them. Mexico's trade in live, native seahorses occurred almost entirely on the black market, with the consequence that no records had been kept of the fishery or trade. Few of the surveyed countries maintained Customs or any other official records of the seahorse trade.
DISCUSSION
Seahorse trade overview
Latin America's international seahorse trade developed from the late-1980s onwards, apparently in response to demand for dried seahorses from Asia, and to a lesser extent for live seahorses from Europe and the USA. By 2000, seahorse trade in Latin America was widespread, involving many different countries and trade routes. Each of the nine surveyed countries had traded seahorses internationally, and interviews and recent official data indicated that six other Latin American countries were also involved in the trade (Table 3). We here reported exports of dried seahorse from eight Latin American countries to ten different countries in Asia and the Americas (Table 4), and live seahorse exports from five Latin American countries to eleven countries in Europe, the Americas and Asia (Table 6). Three Latin American countries also imported dried or live seahorses from outside Latin America (Tables 4 and 6).
In Mexico, Central America and Ecuador, the dried seahorse trade was almost completely supplied by incidental catches in commercial shrimp trawl fisheries. Such trawl fisheries were also the source of most seahorses exported from other countries, including India and Vietnam (Marichamy et al. Reference Marichamy, Lipton, Ganapathy and Ramalingam1993; Giles et al. Reference Giles, Truong, Do and Vincent2005). Previous to this study, however, the only fisheries data on seahorses in Latin America came from investigations that had identified H. erectus in Honduras and Nicaragua, and H. ingens in Guatemala as being present in trawl bycatch (unpublished reports cited in López Reference López1998). Annual seahorse catches estimated here from shrimp fishers’ accounts were low but cumulatively substantial, ranging from several hundred kilograms in Honduras, Ecuador and Peru, to over a tonne in Mexico, and sufficient to supply the amounts reportedly traded (Table 3). Although fishers were paid little per seahorse, there was sufficient economic incentive for them to sort seahorses from their bycatch, particularly when exporters purchasing large quantities were present.
Artisanal fishers in Latin America caught few seahorses and did not participate in the dried trade, except on the Galapagos Islands and in Peru. In Mexico and Honduras for example, seahorse catches by artisanal fishers were infrequent because they fished on sandy bottom substrate, not preferred by seahorses, and used mesh sizes too large to catch seahorses. This is in contrast to eastern Africa and parts of Asia, where small-scale fishers and divers supplied a substantial proportion of the dried seahorse trade (Vincent Reference Vincent1996; McPherson & Vincent Reference McPherson and Vincent2004).
Trade in dried seahorses occurred in diverse ways, often over ephemeral routes. Dried seahorses in excess of one metric tonne were imported to Asia (mainland China, Hong Kong and Japan) from Mexico in each of several years and to Hong Kong from Peru at least twice. Hundreds of kilograms annually have also been imported (either by countries in Asia or the USA) from each of Honduras, Ecuador, Brazil and Surinam in recent years. Dried seahorse exports occurred primarily through three channels: (1) Asian buyers visiting the country to obtain large quantities from a particular region (Mexico, Honduras, Ecuador or Peru); (2) trade together with other products going to Asia, such as shark fins (Mexico, Ecuador and Peru) or sea cucumbers (Ecuador); and (3) trade through Asian communities within Latin America (Belize, Panama and Peru). Seahorses apparently were in sufficient demand and of sufficient value in Asia for traders to travel to Latin America to purchase them. In Peru the retail value of seahorses was reportedly comparable to that of shark fins, one of the most valuable fisheries products in the world (Rose Reference Rose1996). However, because Asian traders usually sought seahorses in large quantities and possibly exhausted local supplies within a few years, many trade routes were short-lived (particularly in Central America), producing a trade that was highly variable over time and geographically dispersed.
Relative to the dried trade, the live seahorse trade in Latin America was much smaller and more localized. In the countries surveyed, live seahorses were caught opportunistically by fishers and divers targeting a variety of marine ornamental and/or food fishes. Apart from the size of a country's coastline, the prevalence of the live trade appeared to depend largely on how established the marine aquarium trade was in a country because traders required seahorse husbandry knowledge and facilities, as well as trade routes and connections with foreign buyers. Live seahorses were sold as aquarium fishes in several locations in Mexico, and occasionally Costa Rica and Panama, despite being expensive and difficult to keep relative to other ornamental fishes (Wood Reference Wood2001).
The live trade appeared to be dominated by Brazil, with several thousand live seahorses exported each year. Hippocampus erectus was cited as the third most commonly traded ornamental fish in north-east Brazil, with over 12 500 exports recorded between 1995 and 2000 (Monteiro-Neto et al. Reference Monteiro-Neto, Cunha, Nottingham, Araujo, Rosa and Barros2003). Very small numbers of live seahorses were exported by Belize and Costa Rica, and imported by Costa Rica and Panama. Mexico had also exported unknown quantities.
Demand for dried and live seahorses within Latin America was low (∼100 kg annually) compared to the international trade (Table 3). Similar numbers of seahorses were traded as curios, for TCM, and live as aquarium fishes within Latin America overall, but with regional differences. Dried seahorses were most commonly traded as curios in Mexico and Peru, with smaller numbers traded in Central American countries. Central America's largest use of seahorses was in Panama for TCM. Several kilograms were also traded for this purpose within Peru each year. Thousands of live seahorses were sold each year in Mexico (slightly more than the number sold as curios in Mexico); only a handful were sold annually in the other surveyed countries.
Seahorse trade impacts and management
Seahorse populations may have declined substantially throughout many regions of Latin America over the past two to three decades. In countries where incidentally caught seahorses have been heavily traded (including Mexico, Honduras and Ecuador) declines were reported by almost all who commented and were estimated to have exceeded 75%. However, because fishers only paid close attention to seahorses when they traded them, we cannot determine if the seahorse trade had contributed significantly to their declines, or merely enabled us to infer changes in seahorse abundance arising from trawling. Commercial trawling will probably negatively affect seahorse populations, through displacement or mortality of incidentally caught individuals (Baum et al. Reference Baum, Meeuwig and Vincent2003), and through habitat damage (Watling & Norse Reference Watling and Norse1998). Thus, it is probable that similar declines have occurred at least in Costa Rica and Panama, where trawling was prevalent. Direct seahorse exploitation appeared to have caused localized declines in Costa Rica and Mexico, and possibly also in Panama and Peru, while the impact of seahorse exploitation in the Galapagos Islands (Ecuador) was unknown.
Seahorse conservation and management recommendations
Reported seahorse declines in Latin America merit further conservation assessment and consideration of remedial action. The lack of permits and record keeping, and the discrepancy between Customs records from Latin America and Asia or USA, and between Customs records and our trade estimates, is evidence that much of the seahorse trade was unreported. Mexico, Honduras and Ecuador should be considered priority areas for seahorse conservation, given the volumes traded by these countries and their reported seahorse population declines. Peru's large seahorse trade also warrants attention.
The information contained herein contributed to H. erectus and H. ingens being listed as Vulnerable on the IUCN (World Conservation Union) Red List (IUCN 2004), and to a listing of the entire seahorse genus Hippocampus on Appendix II of the Convention on International Trade in Endangered Species on Wild Fauna and Flora (CITES) in 2002 (URL http://www.cites.org/eng/app/appendices.shtml). This listing requires that Parties to the Convention (169 nations including all countries in Latin America and all countries known to import seahorses from Latin America) both control their seahorse trade through export permits and demonstrate that the trade is not detrimental to the persistence of their wild populations of these species (URL http://www.cites.org/eng/disc/text.shtml#IV). CITES also requires that all exported seahorses be obtained legally, which is not currently the case in Latin America (URL http://www.cites.org/eng/disc/text.shtml#IV).
In the Latin American context, turning these calls for action into conservation success may largely depend on finding ways to regulate indiscriminate or non-selective fishing gear. CITES Parties will probably only secure sustainable exports of seahorses obtained from trawls by implementing and enforcing spatial and temporal closures, including no-take reserves, to reduce incidental catch and habitat damage (as recommended at the CITES technical workshop on managing seahorse fisheries; Bruckner et al. Reference Bruckner, Field and Daves2005). Contraction of shrimp trawl fleets, underway in several Latin American countries (for example, because many old boats were not being replaced), will also help achieve reduction of seahorse bycatch.
This research on seahorse exploitation contributes to the growing recognition that populations of marine fishes can be threatened by overfishing alone or as part of an array of pressures (see Dulvy et al. Reference Dulvy, Sadovy and Reynolds2003). The CITES seahorse listing, the first for any fully marine fish of commercial value, is one response to such excessive removal. Through this decision, the Convention implicitly acknowledged that commercially valuable marine fishes in trade can be regarded as wildlife in the same sense as elephants or crocodiles, and will need to be managed accordingly. This has set a precedent for international cooperation in monitoring and management of threatened marine fish species. For example, following the seahorse listing, two previously rejected Appendix II proposals, for basking shark (Cetorhinus maximus) and whale shark (Rhincodon typus), were accepted. More study is urgently needed to quantify the ecological impacts of other little understood fisheries, lest those exploited species need similar international conservation support.
ACKNOWLEDGEMENTS
This is a contribution from Project Seahorse. We sincerely thank all of the fishers, seahorse traders, government employees and academics who generously shared their knowledge of seahorses, fisheries and trade with us in order to produce the detailed country reports from which this manuscript is derived. JKB would also like to thank her assistants, Julieta Rodriguez, Luis Castelleños, Calina Zepeda, Adrian Ortiz, Roberto Baca, Gerardo Abada and Arturo Mora, her colleagues Dr V.H. Reynoso (UNAM, Mexico) Dr J. Christy (STRI, Panama), and the representatives of TRAFFIC South America. We also sincerely thank I.L. Rosa for her dedication to investigating the seahorse trade in Brazil and her comments on the manuscript. This research was supported by Columbus Zoo (Ohio, USA), by a National Science and Engineering Research Council of Canada scholarship to JKB, and by operational support from our partners in conservation at the John G. Shedd Aquarium (Chicago, USA). We thank J. Smith and J. Boxall for preparing the maps, and M.-A. Moreau for comments on the manuscript.