Since 1980, the prevalence of overweight and obesity has risen dramatically worldwide, to the point where one-third of people are recognised as overweight or obese(Reference Chooi, Ding and Magkos1). Extra weight is associated with higher morbidity and mortality rate, which places a noticeable burden on affected individuals and healthcare systems(Reference Bell, Edwards and Grieger2). However, among 10–25 % of overweight/obese individuals have recognised as having ‘metabolically healthy’ status, these complications are not directly linked to their weight(Reference Blüher3). On the other hand, previous research suggested that some normal-weight individuals, referred as having metabolically unhealthy (MU) status, have an increased risk of developing non-communicable diseases compared with those with a healthy metabolic profile(Reference Stefan, Schick and Häring4). Metabolic health is a better predictor of disease risk than obesity. Metabolically healthy status is unstable and can switch into MU profile. Therefore, maintaining metabolically healthy profile by dietary and lifestyle modifications is critical.
MU is a multifactorial condition that genetic- and lifestyle-related factors such as sedentary life and unhealthy diet are involved in it(Reference Elder, Lichtenstein and Pittas5). The focal point of previous surveys on the association of MU diet has been dietary intakes(Reference Vilela, Fonseca and Pinto6,Reference Feeney, O’sullivan and Nugent7) , although examining dietary habits in this context has advantages. Implementing dietary habits into practice is believed to be more feasible than dietary plans to manage metabolic complications(Reference Saneei, Esmaillzadeh and Keshteli8). Thus, identifying the optimal patterns of dietary habits may lead to development of preventive measures to manage metabolic complications. Evidence has revealed the involvement of brain-derived neurotrophic factor (BDNF) and adropin in the development of MU status. Previous research has shown that BDNF and adropin serve their metabolic roles through impact on body energy haemostasis, nutrient metabolism and insulin response(Reference Yosaee, Khodadost and Esteghamati9,Reference Li, Lang and Cheng10) . Reduced serum levels of these biomarkers have also been reported in patients with metabolic abnormalities(Reference Yosaee, Khodadost and Esteghamati9,Reference Lommatzsch, Zingler and Schuhbaeck11) . In addition, it seems that behavioural aspects like food consumption can impact the plasma concentration of these biomarkers(Reference Gravesteijn, Mensink and Plat12,Reference Ganesh Kumar, Zhang and Gao13) . Nevertheless, up to now, there has been no research investigating the link between dietary behaviours and BDNF and adropin levels.
A few prior studies have examined the link between dietary habits and metabolic issues. A cross-sectional study on 2896 Iranian adults found that eating breakfast was negatively linked with metabolic syndrome (MetS) risk(Reference Lorzadeh, Sangsefidi and Mirzaei14). Another cross-sectional study on 7081 Korean men aged ≥ 30 years revealed that higher intakes of oily foods and fast eating rate increase the chance of MetS(Reference Shin, Lim and Sung15). In a longitudinal study by Yoshida et al., positive associations were observed between ‘eating dinner immediately before bed’ and ‘eating snacks after dinner’ with components of MetS in both males and females. These night eating habits were positively related with odds of MetS in females, but not in males(Reference Yoshida, Eguchi and Nagaoka16). Additionally, a recent cross-sectional study on 403 female nurses aged 20–45 years found a positive association between intake of ≥ 50 percent of daily calorie after 19.00 and likelihood of MetS(Reference Jung, Dan and Pang17). Based on our literature review, there has been no research on the link between dietary habits, metabolic health and levels of BDNF and adropin. Therefore, we examined these relations in Iranian adults. In this study, we proposed that the impact of dietary habits on metabolic health outcomes could be mediated by BDNF and adropin levels.
Methods and materials
Study design and population
In 2021, this population-based cross-sectional study was conducted on a representative sample of Iranian adults between the ages of 20 and 65 years living in Isfahan, Iran. Complete descriptions of the study details were previously described in the study protocol(Reference Poursalehi, Shahdadian and Hajhashemy18). Twenty schools from various educational zones in Isfahan were selected using a multistage cluster random sampling method. Considering a 49·4 % prevalence of MU among Iranian adults(Reference Rahmanian, Shojaei and Sotoodeh Jahromi19), with a precision of 4·5 %, power of 80 % and a CI of 0·95 (type I error of 0·05), the current study required a minimum sample size of 474 participants. Given the significant effects of the COVID-19 pandemic at the time of participant recruitment, 600 individuals were invited to join this study. To ensure a representative sample of adults from various socio-economic statuses, this study included individuals employed in the chosen schools as employees, teachers, assistants, school managers and crews. Nevertheless, individuals who: (1) had a history of type I diabetes mellitus, stroke, CVD and cancer, (2) followed a special diet whether for weight loss or gain and (3) were pregnant or lactating did not include in the investigation. In total, 543 individuals agreed to participate in our study, leading to an overall response rate of 90·5 %. Individuals were excluded from the study if they: (1) had insufficient data on biochemical indices or metabolic health components (n 9) and (2) did not complete questionnaires of dietary habits (n 7). A total of 527 subjects were included in the analysis. Before enrolling, all participants were provided with an informed written consent. The research protocol was granted ethical approval by the Ethics Committee of Isfahan University of Medical Sciences located in Isfahan, Iran (IR.MUI.RESEARCH.REC.1399.613). This study was conducted in line with the Declaration of Helsinki(Reference Shephard20) and was provided in accordance with the guidelines of Strengthening the Reporting of Observational Studies in Epidemiology(Reference Von Elm, Altman and Egger21).
Assessment of dietary habits
Dietary habits were evaluated using a pre-tested self-reported questionnaire across five specific domains (eating rate, meal patterns, meal-to-sleep interval, intra-meal fluid intake and fatty food intake)(Reference Galhardo, Hunt and Lightman22–Reference Brewer, Kolotkin and Baird24). Additional information regarding the inquiries in each domain and the classifications of answers for each inquiry are provided in Table 1. Participants were questioned about chewing efficiency and how long it takes them to eat lunch and dinner to determine their eating rate. Meal patterns were assessed by inquiring about how often individuals typically consumed their main meals (breakfast, lunch and dinner) and snacks each day, as well as the consistency of their meal times. With regard to meal-to-sleep interval, subjects were questioned about the time between eating lunch and dinner and preparing to sleep or rest. Participants were asked if they drank fluid or water, as well as whether they drank it right before or after eating to assess intra-meal fluid intake. In terms of fatty food intake, participants were instructed to indicate the frequency with which they consumed fried foods each week. Moreover, they were asked to indicate the amount of fat in their primary meals (low fatty meals, moderate fatty meals or high fatty meals).
Patterns of diet-related practices among adults *

Table 1. Long description
The table presents data on diet-related practices among adults, evaluated using a self-reported questionnaire across five specific domains: eating rate, meal patterns, meal-to-sleep interval, intra-meal fluid intake, and fatty food intake. The table has 45 rows and 4 columns. The columns are labeled with the type of diet-related practice, the specific question asked, the response pattern of participants, and the percentage of participants. The rows detail various questions and responses related to eating rate, meal patterns, meal-to-sleep interval, intra-meal fluid intake, and fatty food intake. For example, the table includes questions about chewing efficiency, the time taken to eat lunch and dinner, the frequency of consuming main meals and snacks, the consistency of meal times, the interval between eating and sleeping, fluid intake before or after eating, and the frequency of consuming fried foods and the fat content in primary meals.
Numbers in the table represent the percent of participants. For the class size row, the numbers have been calculated as the row percentage of study participants located in each category. For example, in terms of eating rate categories, 73 % of participants had moderate eating rate, however 15 % had fast and 12 % had slow eating rate. The names of patterns (for example, moderate, fast and slow eating rate) were chosen based on the percentage of individuals responded to the questions mentioned beneath each pattern. For instance, 72 % of participants in the moderate eating rate (which were totally 73 % of the whole study participants) chewed their food moderately; 90 % of them have reported that it took them 10–20 min to eat lunch and 73 % of them reported that it took them 10–20 min to eat dinner.
* Obtained from latent class analysis (LCA).
Assessment of biochemical indices
Each participant had a blood sample taken after fasting overnight for 12 h. To isolate serum, it was promptly centrifuged at 3500 rpm for a duration of 10 min. Serum concentrations of TAG, fasting blood glucose (FBG) and HDL-cholesterol were assessed using the Biosystem A15 autoanalyzer with multiple colorimetric techniques. Subsequently, the leftover serum sample was kept at −80°C for further examinations. The commercial ELISA kits were utilised for testing insulin (Monobined Inc.), fasting blood glucose (turbidimetry kit, latex enhanced turbidimetric method, Delta.DP), adropin (Zellbio) and BDNF (Zellbio). The assay range of adropin was 30–960 pg/ml with a sensitivity of 4 pg/ml, and for BDNF, it was 0·4–12·8 ng/ml with a sensitivity of 0·05 ng/ml; in both assays, intra-assay and inter-assay CV were < 10 % and < 12 %, respectively. The recommended method proposed by Matthews et al. (Reference Matthews, Hosker and Rudenski25) was applied for evaluating insulin resistance (IR): Homeostasis model assessment of insulin resistance (HOMA-IR) = (FBG (mmol/l) × fasting insulin (mU/l))/22·5.
Assessment of metabolic health status
The suggested criterion by Wildman et al. (Reference Wildman, Muntner and Reynolds26) was used to evaluate the metabolic health status of participants. Accordingly, individuals who were within the normal weight range (18·5 ≤ BMI < 25 kg/m2) or who were classified as overweight/obese (BMI ≥ 25 kg/m2) and had at least two out of six specified risk factors according to the criteria were categorised as having metabolically unhealthy normal-weight or metabolically unhealthy overweight/obese profiles, respectively: (1) Females with HDL-cholesterol levels below 50 mg/dl and males below 40 mg/dl; (2) FBG levels equal to or greater than 100 mg/dl; (3) blood pressure equal to or greater than 130/85 mmHg; (4) TAG levels equal to or greater than 150 mg/dl; (5) HOMA-IR above the 90th percentile or above 3·99 and (6) high-sensitivity C-reactive protein concentrations above the 90th percentile or above 6·14 mg/l. On the other hand, normal-weight or overweight/obese individuals who met at most one of the aforementioned criteria were respectively grouped into the metabolically healthy normal-weight and metabolically healthy overweight/obese groups. Of these six items, the four first ones were predefined (as defined by Wildman et al.), whereas the last two ones were determined based on the features of the present population (the 90th percentile or above for the items).
Anthropometric and blood pressure measurement
With a precision of 0·01 kg, body weight was measured using a Tanita MC-780MA body composition analyser (Tokyo, Japan). To the closest 0·1 cm, height was measured using a non-stretched tape measure that was fixed to the wall. Following a normal exhale, the waist circumference was measured while standing, to the closest 0·1 cm between the iliac crest and the lower rib margin. By dividing weight in kilograms by height squared in metres (kg/m2), the BMI was calculated. After a 5-minute rest period in a seated position, blood pressure was recorded twice with an accuracy of 0·5 mmHg using a digital sphygmomanometer (OMRON, M3, HEM-7154-E). The final blood pressure reading was determined by averaging these observations.
Assessment of covariates
Additional data about age, gender, education, approximate income per month, marital status and smoking were gathered through a self-administered questionnaire. The International Physical Activity Questionnaire-short form was also implemented for assessing physical activity (PA)(Reference Moghaddam, Aghdam and Jafarabadi27). Accordingly, the score of each PA level was calculated by metabolic equivalents task (3·3 for walking, 4·0 for moderate-intensity activities and 8·0 for vigorous-intensity activities) × minutes/day × days/week. The total PA score was then obtained by summing up the scores of the mentioned three levels of PA. A validated 168-item semi-quantitative FFQ was utilised to evaluate the dietary intakes of participants over the past year(Reference Mirmiran, Esfahani and Mehrabi28). They were asked to provide information on the quantity and frequency of each food item they had consumed throughout the previous year. All food items were inputted into the Nutritionist IV software (Version 7; First Databank, Hearst Corp), for the purpose of calculating total energy and nutritional intakes.
Statistical analysis
Latent class analysis (LCA) was conducted in order to discover different categories of dietary habits(Reference Jamahj and Mccutcheon29). From thirty-one questions constituted LCA variables, twenty-five were used to identify diet-related classes, which are presented in Table 1. Because dietary habits were considered as latent constructs, it was not possible to examine them directly. Thus, LCA was used as an advanced statistical modelling method to quantify diet-related practices indirectly based on a set of dietary habit indicators. The study assessed major dieting habits using LCA by analysing the pattern of relationships between observed indicators of dietary habits and grouping individuals with similar profiles (i.e. latent classes). In this way, each class that was formed represented a specific dietary habit level. Five major domains of diet-related practices with their associated indicators that previously mentioned were assessed in this analysis. Initially, a single-class model was utilised for each domain. Then, to identify the most parsimonious model, the number of latent classes was gradually raised, while taking into account the interpretability of the classes obtained. For example, when most individuals reported that ‘they moderately chew their food’ and ‘it takes them 10–20 min to eat their lunch or dinner’, such a dietary habit pattern was regarded as interpretable, and it was termed as a ‘moderate eating rate’. Questions that did not significantly contribute to the construction of exclusive classes were eliminated during the use of LCA. Eventually, the class membership of participants was determined based on the classes constructed for each dietary habit (i.e. five new binary or multivariable variables). These variables were considered as predictors of MU for further analyses.
The independent sample t test, one-way ANOVA and χ 2 test were applied to investigate the disparities in general characteristics of participants across classes of dietary habits. Also, multivariable logistic regression was used to evaluate relations between dietary habits and MU status. In the first model, age, gender and energy intake were adjusted. Then, additional adjustments for PA, education, marital status and approximate income per month were done. In the third model, mutually adjustments for other clusters of die-related habits were additionally done. In the last model, BMI was also taken into account. These confounders were determined based on conducted literature review(Reference Saneei, Esmaillzadeh and Keshteli8,Reference Fabiani, Naldini and Chiavarini30) . Mediterranean diet score was additionally calculated and considered in a sensitivity analysis. Adjusted mean of adropin and BDNF values were calculated across different classes of diet-related behaviours through ANCOVA, while controlling of age, sex, energy intake, PA and BMI for adropin and age, sex, PA, high blood pressure, high TAG and high FBG for BDNF levels. Low levels of BDNF (first decile in the present population or < 0·47 ng/ml) across various classes of dietary habits were obtained through multivariable logistic regression while accounting for age, sex, PA, high blood pressure, high TG and high FBG. Mediation analysis was performed through PROCESS macro (version 5) for SPSS(Reference Hayes31) to examine whether the association between dietary habit classes and MU is mediated by BDNF and adropin. Eating rate was coded as dummy variable as PROCESS macro cannot compute effect for exposures more than two categories. Mediators (BDNF and adropin) were considered continuous while MU was binary. Indirect effects were estimated using nonparametric bootstrapping with 5000 iterations, following the regression-based framework described by Hayes(Reference Hayes31). The model was constructed, and the confounders were the same as the original binary regression model. LCA was conducted using R statistical software version 2.15.1 (R Foundation for Statistical Computing). Additional analyses were conducted using SPSS software version 26 (IBM). P values below 0·05 were deemed to be statistically significant.
Results
This investigation performed on 527 middle-aged Iranian adults (42·66 ± 11·19 years) (286 males and 241 females) with a mean BMI of 26·91 ± 4·43 kg/m2. The prevalence of metabolically unhealthy normal-weight and metabolically unhealthy overweight/obese among participants was 8·7 % and 33·8 %, respectively. Table 1 displays five diet-related practices patterns identified by LCA. We recognised three distinct eating rate classes: ‘moderate’, ‘fast’ and ‘slow’; two major meal pattern classes: ‘regular’ and ‘irregular’; two main meal-to-sleep interval classes: ‘short’ and ‘long’; two intra-meal fluid intake classes: ‘moderate’ and ‘more’ and two major fatty food intake classes: ‘high’ and ‘low’. Numbers in this table represents the percentage of subjects. For example, in terms of eating rate categories, 73 % of participants had moderate eating rate; however, 15 % had fast and 12 % had slow eating rate. Pattern names (e.g. moderate, fast and slow eating rate) were selected according to the percentage of people who answered the questions related to each pattern. For instance, 72 % of participants in the moderate eating rate (which were totally 73 % of the whole study participants) chewed their food moderately; 90 % of them have reported that it took them 10–20 min to eat lunch and 73 % of them reported that it took them 10–20 min to eat dinner.
Table 2 displays the overall characteristics of study participants in various categories of diet-related behaviours. A significant difference was observed across ‘eating rate’ clusters regarding participants’ age, approximate income per month, weight, BMI, hypertension and HDL-cholesterol levels (P for all cases < 0·05). Regarding ‘intra-meal fluid intake’, participants with moderate fluid intake in comparison with more fluid intake during a meal were more likely to be female and older. In addition, individuals with ‘moderate fluid intake’ had significantly lower weight, waist circumference and TAG levels (P < 0·05). Participants with ‘high fatty food intake’ in comparison with ‘low fatty food intake’ were more likely to be female and have higher education level (P for all cases < 0·05). No significant difference was observed regarding general features across clusters of ‘meal-to-sleep interval’ and ‘meal pattern’. Additionally, there was no significant difference regarding adropin and BDNF mean values across different classes of diet-related habits.
General characteristics of adults across different classes of diet-related practices *

Table 2. Long description
The table presents a comparison of general characteristics of adults across various diet-related practices, including eating rate, meal pattern, meal-to-sleep interval, intra-meal fluid intake, and fatty food intake. It includes data on age, sex, marital status, education level, income, weight, BMI, waist circumference, physical activity, and various health markers such as adropin, hypertension, hyperglycaemia, hypertriglyceridaemia, HDL cholesterol, hs-CRP, and HOMA-IR. The table highlights significant differences in age, income, weight, BMI, hypertension, and HDL cholesterol levels across different eating rates. It also notes differences in sex, age, weight, waist circumference, and TAG levels based on intra-meal fluid intake, and differences in sex and education level based on fatty food intake. No significant differences were observed for meal pattern and meal-to-sleep interval clusters.
y, year; n, number; HOMA-IR, homeostasis model assessment of insulin resistance.
* Values are Mean (sd); unless indicated.
† Obtained from independent sample t test for continuous variables (except P value of eating rate which obtained by one-way analysis of variance) and χ 2 test for categorical variables.
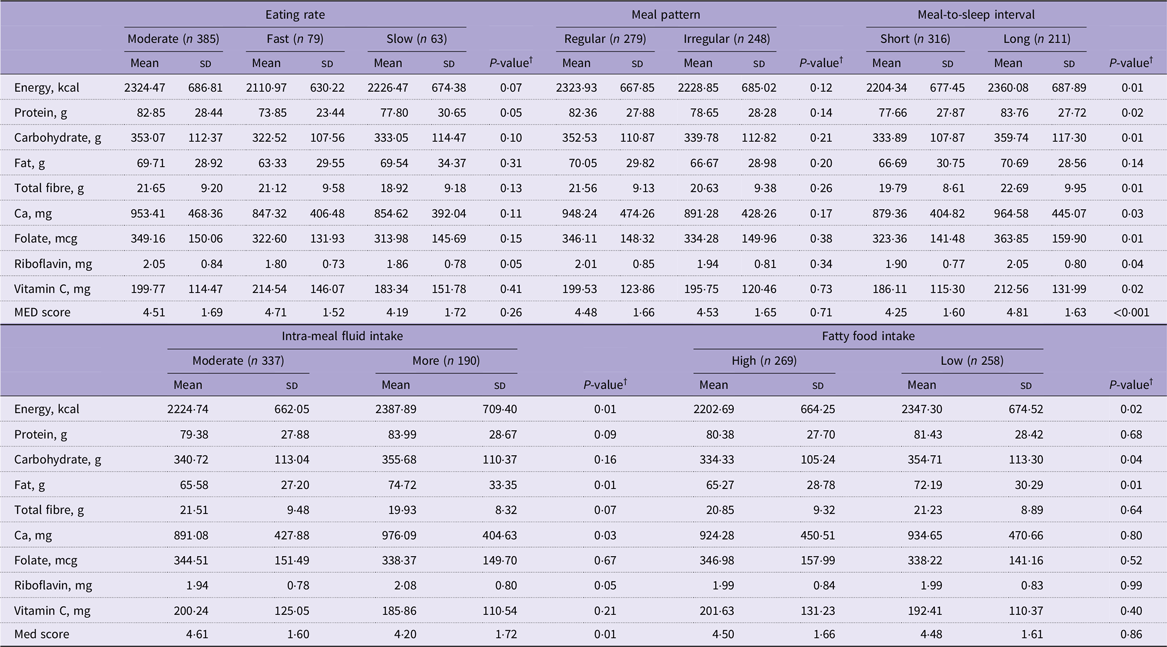
Table 3 shows the dietary intakes of participants across different categories of diet-related behaviours. In terms of ‘meal-to-sleep interval’, participants with long interval than those with short interval had significantly higher intakes of energy, protein, carbohydrate, total fibre, Ca, folate, riboflavin, vitamin C and Mediterranean diet score (P values for all cases < 0·05). Individuals with more fluid intake compared with those with moderate intake had higher intakes of energy, fat and Ca (P values < 0·05). Regarding fatty food intake, subjects with higher consumption of fatty foods (than those with lower consumption) had higher intakes of energy, carbohydrate, fat and Mediterranean diet score (P values < 0·05). There was no significant difference regarding dietary intake across clusters of ‘eating rate’ and ‘meal pattern’.
Dietary intakes of adults across different classes of diet-related practices *

Table 3. Long description
The table presents dietary intakes of adults categorized by eating rate, meal pattern, meal-to-sleep interval, intra-meal fluid intake, and fatty food intake. It includes data on energy, protein, carbohydrate, fat, total fiber, calcium, folate, riboflavin, vitamin C, and Mediterranean diet score. The table has 17 rows and 10 columns, with columns for different dietary intakes and rows for various categories of diet-related behaviors. Notable trends include higher intakes of energy, protein, and other nutrients in participants with longer meal-to-sleep intervals and higher fluid intake. Individuals with higher fatty food consumption also show increased intakes of energy, carbohydrate, fat, and Mediterranean diet score.
Med, Mediterranean diet.
* All values are Mean (sd).
† Obtained by the use of independent sample t test (except P value of eating rate which obtained by one-way analysis of variance).
The prevalence of MU status in normal-weight and overweight/obesity individuals across different classes of diet-related practices is shown in Figure 1. The prevalence of metabolically unhealthy normal-weight (5·7 v. 8·4 %; P = 0·01) and metabolically unhealthy overweight/obese (18·9 v. 37·4 %; P = 0·01) were significantly lower in individuals with ‘slow eating rate’ than those with ‘moderate eating rate’. Overweight/obese participants with ‘more intra-meal fluid intake’ were more likely to have MU status than those with ‘moderate intra-meal fluid intake’ (42·1 v. 29·7 %; P = 0·03). No significant difference was observed for the prevalence of MU status among normal-weight and overweight/obese individuals across different classes of ‘meal pattern’, ‘meal-to-sleep interval’ and ‘fatty food intake’.
Prevalence of normal weight healthy, normal weight unhealthy, overweight/obese healthy and overweight/obese unhealthy across different classes of diet-related practices in the adults.

Figure 1. Long description
The image contains five bar graphs comparing the prevalence percentages of different diet-related practices among adults. Each graph represents a specific practice: eating rate, meal patterns, meal-to-sleep interval, intra-meal fluid intake, and fatty food intake. The y-axis of each graph indicates the prevalence percentage, ranging from 0 to 120. The x-axis categorizes the practices into moderate, fast, slow, regular, irregular, short, long, moderate, more, high, and low. Each bar is segmented into four categories: normal weight healthy, normal weight unhealthy, overweight/obese healthy, and overweight/obese unhealthy, with different shades representing each category. The graphs show variations in prevalence across these categories for each diet-related practice. The p-values at the top of each graph indicate the statistical significance of the differences observed. All values are approximated.
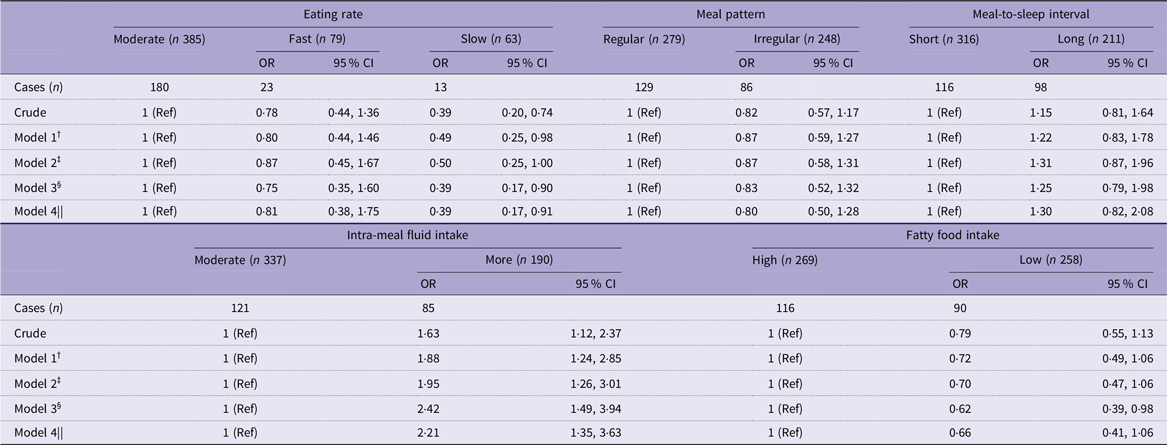
Table 4 presents the crude and multivariable-adjusted OR and 95 % CI for MU profile among different classes of diet-related practices. Subjects with ‘slow eating rate’ in comparison with those with ‘moderate eating rate’ in both crude (OR = 0·39, 95 % CI: 0·20, 0·74) and fully-adjusted model (OR = 0·39, 95 % CI: 0·17, 0·91) had 61 % lower odds of MU profile. Individuals with ‘more intra-meal fluid intake’ than those with ‘moderate intra-meal fluid intake’ had higher chance of having MU profile (OR = 1·63, 95 % CI: 1·12, 2·37). This association also persisted after controlling for confounders (OR = 2·21, 95 % CI: 1·35, 3·63). In terms of ‘meal pattern’, ‘meal-to-sleep interval’ and ‘fatty food intake’ there was no significant link with MU status, in both crude and adjusted models. As shown in online Supplementary Table 1, further adjustment for a total healthy dietary quality score (Mediterranean diet) did not substantially change the associations of dietary habits and MU status. Additionally, we applied generalised linear models to check the possible interaction between eating speed and intra-meal fluid intake; no significant interaction was seen between eating speed rate and intra-meal fluid intake in this analysis.
Multivariable-adjusted odds ratio (OR) and 95 % confidence interval (CI) for MU profile across different classes of diet-related practices among adults *

Table 4. Long description
The table presents data on the odds ratios and 95% confidence intervals for metabolic unhealthy profile across various diet-related practices among adults. It includes categories such as eating rate, meal pattern, meal-to-sleep interval, intra-meal fluid intake, and fatty food intake. The table has 13 rows and 10 columns, with headers for cases, crude odds ratios, and multivariable-adjusted models. Notable trends include lower odds of metabolic unhealthy profile for those with a slow eating rate compared to a moderate eating rate, and higher odds for those with more intra-meal fluid intake. No significant links were found for meal pattern, meal-to-sleep interval, and fatty food intake with metabolic unhealthy status.
MU, metabolically unhealthy; n, number.
* All values are OR and 95 % CI. R2 value for the fully adjusted model in all dietary habits was 0·21.
† Model 1: Adjusted for age, sex and energy intake.
‡ Model 2: Additionally adjusted for marital status, education, approximate income per month and physical activity.
§ Model 3: Additionally adjusted for other clusters of dietary habits.
|| Model 4: More adjustments for BMI.
Multivariable-adjusted OR and 95 % CI for MU components across different classes of diet-related practices are provided in Table 5. Individuals with ‘fast eating rate’ than those with ‘moderate eating rate’ had higher chance of hyperglycaemia (OR = 1·91, 95 % CI: 1·04, 3·51). This association persisted after controlling for potential confounders (OR = 3·55, 95 % CI: 1·48, 8·51). Additionally, participants with ‘slow eating rate’ in comparison with ‘moderate eating rate’ had lower likelihood of having hypertension (OR = 0·47, 95 % CI: 0·25, 0·86); however, after taking confounders into account, this relationship disappeared (OR = 0·53, 95 % CI: 0·25, 1·15). After controlling for potential confounders, individuals with ‘more intra-meal fluid intake’ than those with ‘moderate intra-meal fluid intake’ had higher chance of having high HOMA-IR (OR = 2·20, 95 % CI: 1·06, 4·58), hypertriglyceridaemia (OR = 2·23, 95 % CI: 1·36, 3·65) and hypertension (OR = 1·66, 95 % CI: 1·03, 2·69).
Multivariable-adjusted odds ratio (OR) and 95 % confidence interval (CI) for MU components across different classes of diet-related practices among adults *

Table 5. Long description
The table presents multivariable-adjusted odds ratios (OR) and 95% confidence intervals (CI) for metabolic unhealthy components across various diet-related practices among adults. It includes data on eating rate, meal pattern, meal-to-sleep interval, intra-meal fluid intake, and fatty food intake. The table has 13 rows and 10 columns, with columns for different eating rates, meal patterns, meal-to-sleep intervals, intra-meal fluid intakes, and fatty food intakes, and rows for high CRP levels, high HOMA-IR, high FBG levels, low HDL-cholesterol levels, high TAG levels, and hypertension. Notable trends include higher odds of hyperglycemia for fast eaters and higher odds of high HOMA-IR, hypertriglyceridaemia, and hypertension for those with more intra-meal fluid intake.
MU, metabolically unhealthy; HOMA-IR, homeostasis model assessment of insulin resistance; n, number.
* All values are OR and 95 % CI.
† Adjusted for age, sex, energy intake, marital status, education, approximate income per month, physical activity, mutually adjusted for other clusters of dietary habits BMI.
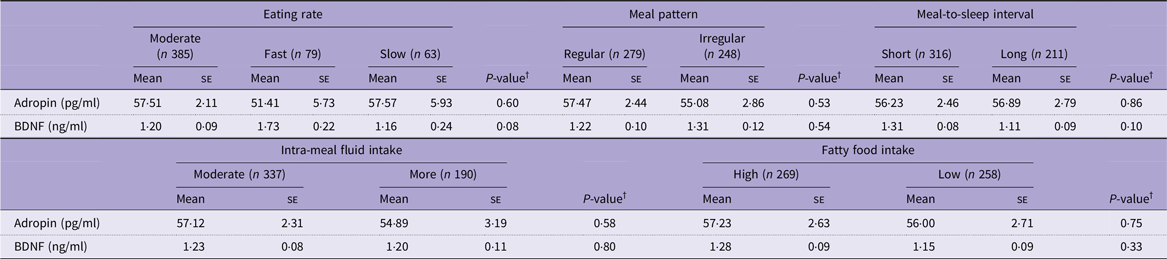
Multivariable-adjusted means of adropin and BDNF levels across different classes of diet-related practices are represented in Table 6. After adjusting for confounders, there was no noticeable difference in average levels of adropin or BDNF across different classes of diet-related habits.
Multivariable-adjusted means of adropin and BDNF levels across different classes of diet-related practices among adults *

Table 6. Long description
The table presents multivariable-adjusted means of adropin and BDNF levels across various diet-related practices among adults. It includes data for different eating rates (moderate, fast, slow), meal patterns (regular, irregular), meal-to-sleep intervals (short, long), intra-meal fluid intake (moderate, more), and fatty food intake (high, low). Each category lists the mean and standard error for adropin and BDNF levels. The table shows no significant differences in adropin and BDNF levels across these diet-related habits after adjusting for confounders.
* Values are mean (se); unless indicated.
† Obtained from ANCOVA. BDNF values were adjusted for age, sex, PA (MET.min/week), high FBS, high TAG and high BP. Adropin values were adjusted for age, sex, energy intake, PA (MET.min/week) and BMI.
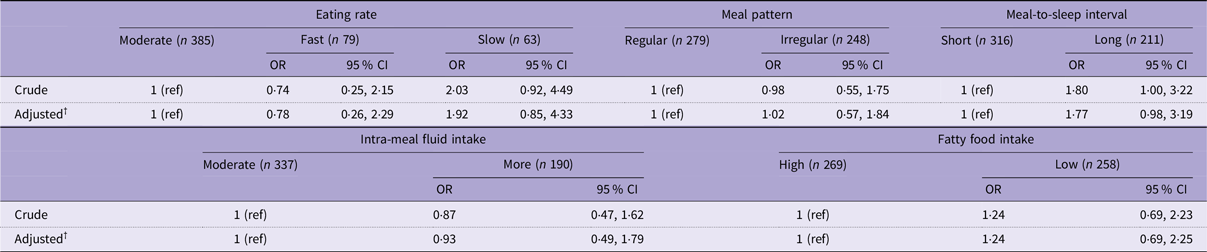
Table 7 presents the adjusted OR and 95 % CI for low BDNF levels across different classes of diet-related practices. There was no notable association found regarding low BDNF levels across different classes of diet-related habits.
Multivariable-adjusted odds ratio (OR) and 95 % confidence interval (CI) for low BDNF levels across different classes of diet-related practices among adults *

Table 7. Long description
The table presents data on the odds ratios (OR) and 95% confidence intervals (CI) for low brain-derived neurotrophic factor (BDNF) levels across different diet-related practices among adults. The table is divided into several sections: eating rate, meal pattern, meal-to-sleep interval, intra-meal fluid intake, and fatty food intake. Each section includes categories such as moderate, fast, slow, regular, irregular, short, long, moderate, more, high, and low. The table shows crude and adjusted OR values for each category. For example, under eating rate, the moderate category is the reference with an OR of 1, while the fast category has an OR of 0.74 with a 95% CI of 0.25 to 2.15. The slow category has an OR of 2.03 with a 95% CI of 0.92 to 4.49. Similar data is presented for other sections, indicating no notable association between low BDNF levels and different diet-related habits.
* All values are OR and 95 % CI.
† Adjusted for age, sex, physical activity, high FBS, high TAG and high BP.
Figures 2 and 3 illustrate direct and indirect effects for the association between dietary habit classes and MU considering BDNF and adropin as mediators. No significant indirect association was found, suggesting that these biomarkers would not mediate the association between dietary habit classes and MU.
Direct and indirect regression coefficients for the association between dietary habit classes and MU, considering BDNF as mediator. Superscript asterisk indicates P < 0·05.

Figure 2. Long description
The image contains six separate diagrams, each illustrating the relationship between different dietary habits, brain-derived neurotrophic factor (BDNF), and metabolically unhealthy (MU) status. Each diagram includes three main components: a dietary habit factor, BDNF, and MU, with arrows indicating the direction and strength of their relationships. The values on the arrows represent the regression coefficients, showing the direct and indirect effects. The first diagram compares fast versus moderate eating rates, showing an indirect effect of negative 0.030. The second diagram compares slow versus moderate eating rates, showing an indirect effect of 0.013. The third diagram compares irregular versus regular meal patterns, showing an indirect effect of negative 0.007. The fourth diagram compares long versus short meal to sleep intervals, showing an indirect effect of 0.019. The fifth diagram compares more versus moderate intra-meal fluid intake, showing an indirect effect of negative 0.013. The sixth diagram compares low versus high fatty food intake, showing an indirect effect of 0.005. Each diagram includes specific regression coefficients for the paths between dietary habits, BDNF, and MU, with some paths marked with an asterisk indicating statistical significance at P less than 0.05. All values are approximated.
Direct and indirect regression coefficients for the association between dietary habit classes and MU, considering adropin as mediator. Superscript asterisk indicates P < 0·05.

Figure 3. Long description
The image contains six separate diagrams, each illustrating the relationship between different dietary habits, adropin levels, and metabolically unhealthy (MU) status. Each diagram features three main components: a dietary habit factor, adropin levels, and MU status, connected by arrows indicating direct and indirect regression coefficients. The diagrams compare fast versus moderate eating rates, slow versus moderate eating rates, irregular versus regular meal patterns, long versus short meal-sleep intervals, more versus moderate intra-meal fluid intake, and low versus high fatty food consumption. Each diagram includes numerical values representing the strength of the relationships between these factors. The arrows indicate the direction and magnitude of the effects, with some paths marked as significant (indicated by an asterisk). The overall concept highlights how different dietary habits influence adropin levels and subsequently affect metabolically unhealthy status.
Discussion
In this study, we examined the association between patterns of dietary habits and metabolic health status in Iranian adults. We found that ‘slow eating rate’ was associated with lower odds of having MU profile. Moreover, a higher likelihood of having hyperglycaemia was observed in participants with ‘fast eating rate’. ‘More intra-meal fluid intake’ was positively related to MU status, insulin resistance, hypertriglyceridaemia and hypertension. The association between ‘fatty food intake’ and MU status disappeared after controlling BMI, which means that fatty foods through increasing BMI led to elevated odds of MU profile. There was no noticeable association between ‘meal pattern’ and ‘meal-to-sleep interval’ with MU profile or its components. Classes of diet-related habits were not associated with serum BDNF and adropin levels.
The epidemic of MU profile is correlated with increased risk of NCDs mortality and a significant economic burden(Reference Eckel, Li and Kuxhaus32). Thus, preventing the transition from metabolically healthy to MU status by dietary and lifestyle habits could be of great importance to reduce the incidence of NCDs and correlated complications. Our findings revealed that modifications in eating habits besides dietary intakes as previously suggested(Reference Vilela, Fonseca and Pinto6,Reference Feeney, O’sullivan and Nugent7) could assist general public to decrease the odds of MU status. Despite the valuable insights provided in the present study, some important gaps remain. First, the causal link underlying these changes remains poorly understood. Second, there is a lack of intervention studies assessing the effectiveness of dietary habit modifications on metabolic health status. Moreover, this association should be investigated across different socio-demographic groups and populations to affirm the findings. Addressing these gaps is essential for developing effective prevention strategies.
The findings of current investigation revealed that odds of MU profile could be reduced by ‘slow eating rate’, whereas chance of hyperglycaemia could be increased by ‘fast eating rate’. Similar to our findings, a previous prospective study on 8941 adults aged 40–75 years found positive association between fast eating speed and risk of MetS(Reference Zhu, Haruyama and Muto33). However, they found no significant association between fast eating and components of MetS(Reference Zhu, Haruyama and Muto33). Moreover, a previous cross-sectional study on 7081 Korean adult men found a positive association between fast eating rate and chance of MetS(Reference Shin, Lim and Sung15). Additionally, Sakurai et al. indicated that fast eating was associated with higher risk of diabetes mellitus in middle-aged Japanese men(Reference Sakurai, Nakamura and Miura34). There are some hypotheses to clarify why eating rate can have an impact on MU status. First, since the brain receives satiety signals from the consumption of nutrients, distension of the stomach and release of gut hormones such as cholecystokinin, fast eating is linked to a delayed onset of satiation and higher risk of unfavourable metabolic profile(Reference Morton, Cummings and Baskin35). Second, decreased mastication in fast eaters and subsequent inactivation of histamine neurons might be correlated to MU profile. Histamine neurons could be activated by mastication and then could reduce physiological food intake via H1-receptors in the satiety centres of the hypothalamus paraventricular nucleus and the ventromedial hypothalamic nucleus(Reference Sakata, Yoshimatsu and Masaki36). Third, eating fast could raise HbA1c levels by elevating postprandial plasma glucose levels. In addition, the effects of eating fast on blunted postprandial glucagon-like peptide-1 responses(Reference Kokkinos, le Roux and Alexiadou37) and insulin resistance(Reference Otsuka, Tamakoshi and Yatsuya38) may not counterbalance the raised post-meal glucose levels caused by eating quickly. These lend more credence to the idea that fast eating could be a strong behavioural indicator of the maladaptive eating habits that could result in unfavourable metabolic status. Further large-scale studies are warranted to confirm these findings.
In the present study, a fast eating rate was significantly associated with hyperglycaemia, but not with the overall MU status. This apparent inconsistency may be due to the multifactorial definition of metabolic health, which encompasses several components, including blood pressure, lipid profile and waist circumference, in addition to glucose levels. Individuals who eat quickly might exhibit elevated blood glucose but still maintain normal values for other metabolic factors, resulting in no significant association with the composite MU status. This suggests that eating behaviour may influence specific metabolic components rather than overall metabolic health.
The current investigation revealed that ‘more intra-meal fluid intake’ was positively related to higher odds of MU status and its components including high HOMA-IR, hypertriglyceridaemia and hypertension. A previous cross-sectional study (on 14 968 adults in China) found that intra-meal water drinking was associated with higher chance of cardiometabolic disorders(Reference Zheng, Zhou and Wu39). In addition, evidence supported the idea that high intra-meal fluid intake was related to higher likelihood of overweight/obesity among Iranian adults(Reference Saneei, Esmaillzadeh and Keshteli8,Reference Salari-Moghaddam, Aslani and Saneei40) , which could be a precursor for MU profile. The mechanism in which more intra-meal fluid intake may affect MU status is unknown. Researchers believe that fluid intake with meal may affect MU status by increasing energy intake(Reference Saneei, Esmaillzadeh and Keshteli8), but it fails to explain the associations reported here as the reported associations had been adjusted for energy intake. Moreover, some piece of evidences claim that all beverages (especially water) could negatively affect the digestion and/or absorption of nutrients through dilution of stomach acids and digestive enzymes which could be related to an unfavourable metabolic profile(Reference Khil, Chen and Lee41). However, it should be mentioned that participants in the current study did not inquire about the type of beverages they drank along with their meals. Evidence suggested that water could be the most popular beverage that Iranians have with their meals(Reference Salari-Moghaddam, Aslani and Saneei40). Nonetheless, some people pair their meals with colas and yogurt drinks(Reference Salari-Moghaddam, Aslani and Saneei40). Therefore, future studies, particularly prospective and longitudinal ones, should be performed to clarify this issue.
Decreased concentrations of BDNF and adropin among individuals with metabolic abnormalities have been suggested in previous researches(Reference Li, Lang and Cheng10,Reference Zang, Jiang and Cheng42) . A limited number of studies have investigated the effect of diet on these biomarkers(Reference Gravesteijn, Mensink and Plat12,Reference Ganesh Kumar, Zhang and Gao13) . In this study, we investigated the association between diet-related behaviours with BDNF and adropin levels for the first time to find out whether these biomarkers facilitate the role of dietary habits on metabolic health status. We found no significant association between diet-related behaviours and serum levels of adropin and BDNF. It should be noted that the sample size was determined based on the study’s primary outcome that is metabolic health. Consequently, the statistical power may have been insufficient to detect associations for these secondary biomarkers. It is possible that a larger sample size would be required to identify associations with BDNF and adropin.
In the present study, we identified patterns of dietary habits using latent class analysis (LCA). As a person-centered approach, LCA offers the advantage of estimating distinct profiles of conditional probabilities that define mutually exclusive latent classes. Similar to cluster analysis (CA), LCA classifies individuals into groups that maximise between-class variation in dietary behaviours while ensuring relative homogeneity within each class. However, LCA provides several methodological strengths beyond those of CA, including the ability to incorporate covariates directly into the model, quantify the uncertainty of class membership and apply robust indices to assess model fit. Although cluster analysis is often considered a variant of LCA, it is generally more appropriate for continuous variables, whereas LCA is specifically designed for categorical indicators. Given the categorical nature of the dietary habit variables in the current study, LCA was deemed the more suitable analytic approach. Likewise, while dietary patterns can be explored using principal component analysis or related scoring techniques, these methods focus on reducing variable dimensionality rather than classifying individuals, and are most appropriate for continuous data. Therefore, LCA provided a conceptually and statistically appropriate framework for identifying meaningful patterns of eating habits in our dataset.
To the best of our knowledge, this research was among the initial ones to investigate the relationship between dietary habits and metabolic health status in a reasonably representative sample of Iranian adults. Additionally, several confounders including socio-demographic variables, diet-related behaviours as well as energy intake were taken into account to reach independent relations. Moreover, IR and chronic inflammation were considered in the definition used for metabolic health status. Last but not least, in this study, LCA was applied to identify clusters of dietary habits. However, some limitations should be considered. First, the cross-sectional design of the current study prevents the establishment of a causal relationship. Additional prospective research is needed to confirm causality. Furthermore, eating habits were evaluated through a self-reported questionnaire that could have led to misclassification. Nonetheless, an earlier survey suggested that self-reported dietary habits might align with those described by a peer(Reference Sasaki, Katagiri and Tsuji43). Additionally, this questionnaire was not validated in the populations as compared with a gold standard tool, because no gold standard method has been available to investigate the accuracy of dietary habits. However, evaluating the association between classes of dietary habits obtained from the present questionnaire, and other diseases could be considered as an approach to validate this tool, suggesting that the present questionnaire can predict the risk of diseases in different populations. Previous investigations have reported that dietary habits obtained from the present questionnaire were related to obesity, gastrointestinal disorders and irritable bowel syndrome(Reference Saneei, Esmaillzadeh and Keshteli8,Reference Saneei, Esmaillzadeh and Keshteli44,Reference Hajishafiee, Keshteli and Saneei45) . Another limitation of this study is the lack of detailed information regarding the types of beverages consumed during meals. The metabolic effects of intra-meal fluids likely vary by beverage composition; for instance, plain water, sugar-sweetened beverages, caffeinated drinks or milk could exert different physiological responses. Future investigations should distinguish between beverage categories to elucidate their specific impacts on metabolic regulation. Last but not least, despite the fact that our study group could be a representative sample of Iranians adults, most of them were highly educated, and we cannot apply our results to other populations. Consequently, additional research in various nations is necessary.
Conclusion
The current investigation highlighted that slow eating rate was linked to lower likelihood of having MU profile among Iranian adults. However, fast eating rate was related to higher chance of hyperglycaemia. More intra-meal fluid intake was positively related to higher likelihood of MU profile, high HOMA-IR, hypertriglyceridaemia and hypertension. No significant association was observed between meal pattern, meal-to-sleep interval and fatty food intake with MU status. Serum BDNF or adropin was not associated with classes of diet-related habits. Accordingly, dietary habit modification could be a good strategy to improve metabolic health status among adults. However, future extensive prospective researches are needed to confirm these results.
Supplementary material
For supplementary material/s referred to in this article, please visit https://doi.org/10.1017/S0007114526106722
Acknowledgements
The authors have no acknowledgments to declare.
The financial support for conception, design, data analysis and manuscript drafting come from the Nutrition and Food Security Research Center, Isfahan University of Medical Sciences, Isfahan, Iran (no.299249).
A. B., D. P., Z. H., P. R., F. S., Z. H., S. M., E. M. and P. S. contributed to the conception, design, data collection, data interpretation, manuscript drafting and approval of the final version of the manuscript and agreed on all aspects of the work.
The authors declare no conflicts of interest in relation to the current manuscript.