Glossary

I. Introduction
1. Efforts to strengthen the quality of capital for banks and insurers through Basel III and Solvency II are well advanced. On the one hand, the Basel Committee on Banking Supervision (BCBS), the organization responsible for developing international standards for banking supervision, adopted the Basel II framework in 2004Footnote 1 and, in response to the financial crisis, has taken steps to strengthen it in an incremental fashion to form what is now known the Basel III framework (BCBS 2009, 2011a, 2011b, and 2011c). On the other hand, the European Commission (EC) is leading the Solvency II project, in close cooperation with the European Insurance and Occupational Pensions Authority (EIOPA), to develop harmonized standards for insurance supervision within the European Union. A directive was adopted in 2009, and work—which included a series of quantitative impact studiesFootnote 2—has been underway to develop supporting rules.Footnote 3
2. The regional scope of application of the two accords varies. Basel is an “accord”/agreement with no legal force but potentially global applicability, whereas Solvency II is a legal instrument that will be binding in 30 European Economic Area (EEA) countriesFootnote 4 (27 European Union (EU) states plus Iceland, Liechtenstein, and Norway). However, Solvency II has also implications beyond Europe through, for example, its influence on the international standards being developed by the International Association of Insurance Supervisors (IAIS), and because external insurance groups will be more easily able to operate in the EU if their home supervisory regimes are considered equivalent.
3. Although these standards have much in common, differences do exist. Both take a risk-based approach to minimum capital requirements and supervision and promote the integrated use of models by institutions in managing risks and assessing solvency. However, their objectives overlap only partially. In particular, Basel III attempts to increase the overall quantum of capital and its quality as a means of protecting against bank failures, including improved quantification of risks that were poorly catered for under Basel II. However, Solvency II attempts to strengthen the quality of capital and tailor the quantity of capital required more closely to the risks of each insurer, without necessarily increasing the quantity within the sector as a whole. Finally, the two accords have been tailored to the business characteristics of the respective sectors, often as a result of bilateral negotiations, and shaped by the views of those involved in their development in a piecemeal manner. Accordingly, they have generated long and complex documents which define the same concepts in different ways and often deal differently with the same or similar issues.
4. This paper has two key objectives: (i) to present similarities and differences among Pillar 1 requirements of the two accords; and (ii) to discuss possible unintended consequences of their implementation. In order to ensure focus in the analysis, this paper is intentionally limited to aspects related to Pillar 1 (minimum capital requirement) in the two capital accords. The paper acknowledges that there can be significant overlap in the business activities of banks and insurers. For example, consumers save with banks through deposits and with life insurers through annuity with savings products. In addition, banks and insurers invest in many of the same types of assets and they compete with one another in raising capital, both in the capital markets and within the financial conglomerates of which many are members. Due to this overlap, differences in the two accords can generate unintended consequences in the area of cost of capital, funding patterns, and interconnectedness, and promote risk/product migration across or away from the two sectors. These unintended consequences are summarized in the conclusions together with policy considerations. Finally, the paper acknowledges that other sources of arbitrage not analyzed in this paper, like differences in Pillar 2 (supervisory approach) and Pillar 3 (market discipline), as well as differences in accounting (partially discussed here) and tax treatments, could reinforce or offset the impact of differences in the capital regulatory frameworks.
5. The remainder of the paper is structured as follows: Section II discusses differences and similarities between the insurance and banking business models, the valuation and accounting of assets and liabilities, as well as the ability of the two types of financial intermediaries to change the risk profiles of their balance sheets. Section III provides a succinct overview of the two accords. Section IV discusses differences and similarities in the capital components provided for under the two accords. Section V discusses differences and similarities in the required capital under the two accords. The possible implications of these differences are discussed within each section, while Section VI reflects on the overall picture. Finally, Section VII concludes and draws policy considerations.
II. Banks and Insurers Assets and Liabilities
6. While different, business activities of banks and insurers often overlap. The business differences affect the nature of their assets and liabilities, the manner in which these entities are funded, and the overall structure of their balance sheets. Accounting rules, which affect the valuation of assets and liabilities—and the resulting level of capital—also differ in some respects by sector. At the same time, banks and insurers compete on both investment and protection products. In summary, while the banking and insurance businesses are fundamentally different, substantial overlap exists in key areas. This section discusses similarities and differences in business models, accounting standards, ability to modify the risk profile of assets and liabilities, and product competition between the two sectors.
A. Differences in Business Model
7. Banks’ business is asset-driven and often supported by leveraged balance sheets. Banks provide a large set of fee-based services, such as payment and settlement processing, and financial services. Commercial/retail banks provide mainly loans to borrowers, typically funded by pooling the savings of depositors; i.e., the business is based on maturity transformation and the loan books represent the largest component of their assets while deposits represent the largest components of their liabilities. However, if deposits are insufficient to support the growth of the loan book, banks leverage their balance sheet by seeking additional funding by issuing commercial paper or bonds, borrowing from other banks or the central bank, or engaging in securities repurchase transactions (repos). Investment banks provide a large set of financial services to clients and engage in securities trading activity for both their customers’ accounts and their own account. The funding needed to support trading activities and their associated risks typically comes from shareholders or wholesale sources. Finally, universal banks combine both commercial and investment banking activities. Accordingly, their assets, liabilities, and funding sources share characteristics with both commercial and investment banks.
8. Different activities subject banks to different risks. The loan book subjects a bank to credit risk, should borrowers default on the obligation to repay their loans, but such credit risk is capped by the value of the loans. The loan book (in combination with short term funding) also subjects a bank to liquidity risk. Indeed, the duration of deposit liabilities is typically shorter than the duration of loan assets. This maturity transformation usually serves to enhance the spread, but it can subject a bank to significant liquidity risk which, in turn, contributes to the need to protect depositors with safety nets. In addition, since there is no direct link between the liabilities and the assets,Footnote 5 if there is a run on the bank, where customers withdraw their deposits and other banks refuse to provide interbank loans, the loan assets might not be readily realizable. Investment, and universal and commercial banks are also exposed to market, counterparty, and operational risk through their trading books. Finally, fee-based services subject banks to operational risk and, in some cases, to counterparty credit risk.
9. Banks’ profits arise from the spread between the income earned on assets and the cost of liabilities. Fee-based services generate fee income. The loan book produces interest income and the trading book produces investment income. On the liability side, costs of funding are represented by the interest paid on deposits and/or the costs of alternative sources of funding.
10. Insurers typically provide a narrower range of services that are mainly liability driven (Geneva Association,2010). The core activity of nonlife insurers is limited to risk-pooling arrangements to protect policyholders from adverse future events. The life business includes products that can serve as investment vehicles for policyholders. Such products often combine the investment aspect with insurance protection—against mortality or longevity risk—and can be very long in duration.
11. Insurance activities generate mainly underwriting, credit, and market risk. The policyholder protection activity exposes both life and nonlife companies to underwriting risk, market risk, and perhaps (depending on the guarantees provided by the policy) credit risk. Life products (especially when combined with savings components) can also create liquidity risk, although many include restrictions or penalties intended to mitigate this risk. For some classes of nonlife insurance business, such as credit insurance and financial surety, the underwriting risk is similar to the credit risk borne by a bank. Finally, insurers typically seek to invest the premiums in assets that are suitable to the nature of the corresponding insurance liabilities. Mostly, there is a close and direct link between the value of the insurance liability and the value of the related assets. However, when adequate assets are not available, the duration of an insurer's liabilities is often longer than the duration of its assets. Any interest rate duration mismatch creates market risk for the insurer in the form of interest rate risk, but some investment types (i.e., asset-backed securities) can also create credit spread duration risk.
12. Insurers are less leveraged and therefore, less exposed to liquidity risk than banks. Insurers are largely funded by policyholders with technical provisionsFootnote 6 representing the largest component of insurers’ balance sheets and they are less reliant on debt and other external funding than are banks (Figure 1).Footnote 7 However, some life insurance products generate losses (under current methods of calculating liability values) during the first years of the policyFootnote 8 and insurers sometimes purchase reinsurance or use own capital to help meet this new business strain. Insurers are less exposed to the risk of mass lapses of policies than are banks to runs on deposits because of the locked-in nature of much of their funding. The ability of insurers to anticipate future profits under Solvency II could increase the exposure to mass lapses, because it means that some might not have sufficient readily-available capital to repay all policyholders in the event of a run. However, the mass lapse stress component in the solvency capital requirement (SCR) helps to mitigate this risk.Footnote 9
Funding Structure of European Insurers and Banks Source: Staff calculations on CEA data. Notes: As percentage of total liabilities (excluding equity).
13. Insurance profits arise from the difference between income earned and the costs of providing insurance benefits. The relative importance of the different income and expense items varies by business line, but, in general, the largest source of income is typically represented by policyholders’ premiums followed by the investment income that accumulated premiums generate prior to the payment of insurance benefits. The largest component of expenses is typically constituted by claims payments to which underwriting, reinsurance, investment, and administrative expenses need to be added.
14. Insurance liabilities have more loss-absorption capacity than bank liabilities. Insurance liabilities, particularly those in respect of life insurance policies with profit participation, provide some risk-absorption capacity. If experience is adverse and there is profit participation in place, some of the adverse impact would reduce policyholder liabilities, thereby mitigating the impact on capital. Although the same partial pass-through can also arise in banking (for example, with a derivative contract, if defined in an appropriate manner), such contract terms are much less common than in insurance.
15. These differences in business models translate into differences in both levels and quality of capital (Figure 2). The largest 50 European banks have on average 6 percent total capital over total assets, of which only 67 percent is represented by high-quality Core Tier 1 capital. Large insurers world-wide have on average 8 percent of total capital over total assets, of which 84 percent is represented by high-quality equity capital. Finally, large global reinsurersFootnote 10 have on average more capital (with total capital amounting to 15 percent of total assets) but are also more leveraged (with high quality equity capital amounting to 73 percent of total capital).Footnote 11
Levels and Quality of Capital for Select Banks and Insurers Source: SNL and Staff estimates. Notes: For Banks: Total Capital for banks is calculated as Regulatory Capital, Core Capital is calculated as Core Tier 1 capital. For Insurers: Total Capital is calculated as Total Equity plus Subordinated Debt, Core Capital is calculated as Total Equity.
B. Key Differences in Accounting Standards
16. Banks and insurers use different accounting standards.Footnote 12 In many jurisdictions, the financial statements of banks are prepared in accordance with International Financial Reporting Standards (IFRS) or similar accounting rules. The rules are a mixture of fair-value accounting (for trading activities and available-for-sale banking assets) and historical cost accounting (for other banking assets). The accounting standard was not designed specifically for banking regulatory purposes, so various adjustments and deductions are made in moving from the financial statements to the determination of capital adequacy. Solvency II uses instead a “total-balance-sheet approach” based on the fair values of both assets and liabilities. The Solvency II balance sheet must be prepared independently of any general-purpose financial reporting requirements. Although some assets and liabilities will be valued in the same manner as under IFRS, others will be valued differently.Footnote 13 Given the different underlying accounting bases, it is unsurprising that the prudential adjustments under Solvency II differ from those under Basel III (as we will see in Section IV.B).
17. Bank assets are typically valued at amortized book value or fair value. Bank loans, under IFRS, fall under financial instruments and are accounted for by using IAS 39. Under IAS 39, financial assets are categorized as either (i) loans and receivables; (ii) financial assets at fair value through profit or loss; (iii) available for sale; or (iv) held to maturity. Other financial assets are initially measured at fair value plus, if not valued at fair value through profit or loss, transaction costs that are directly attributable to the acquisition. Financial assets at fair value and assets available for sale are subsequently carried at fair value, while loans and receivables and held-to-maturity assets are carried at amortized cost. All derivatives, whether held for trading or for hedging, are carried at fair value. IFRS 9, which will apply from January 2013, proposes that all financial assets will either be measured at amortized cost or fair value.
18. In addition, loan provisions are only “retrospective.” Banks are not permitted to make provisions for expected future loan losses, no matter how likely they are to arise.Footnote 14 IAS 36 “Impairment of Assets” requires a case-by-case assessment of the facts and circumstances surrounding the recoverability and timing of future cash flows relating to a credit exposure. Should there be an expectation that all contractual cash flows would not be recovered (or recovered without full future interest payments), an exposure would be classified as impaired. The extent of impairment would be measured on a present-value basis using the effective interest rate of the exposure as the discount rate. For groups of loans that share homogenous characteristics (such as mortgage and credit card receivables), impairment can be assessed on a collective basis. The aim of an individual or collective assessment is to capture the incurred loss for a specified portfolio. General provisions are permissible only to the extent that they relate to a specified risk that can be measured reliably and for incurred losses. For investments, a similar analysis is conducted, the key difference being that the fair value of the investment is also considered as an input.
19. However, the assets of insurers are valued at fair value under Solvency II and provisions are prospective. IFRS is used as a proxy for fair value, except for some specific instances when IFRS is not equivalent to fair value. Provisions for expected losses on the assets of insurers would thus be inherently reflected in the valuation.
20. Bank liabilities are also valued at amortized book value or fair value. Bank deposits are typically valued at book value or amortized book value. A retrospective methodology is used, reflecting the amount that would be paid upon exit. Other financial liabilities of banks are initially measured at fair value plus, if not valued at fair value through profit or loss, transaction costs that are directly attributable to the acquisition. After initial recognition, financial liabilities can be carried either at amortized cost using the effective interest method or at fair value through profit or loss. A new accounting standard, IFRS 9, will apply from January 2013 and will require companies choosing to measure a liability at fair value to present the portion of the change in its fair value due to changes in the entity's own credit risk in the other comprehensive income section of the income statement, rather than within the profit and loss.
21. However, insurance liabilities under Solvency II are valued at the amount for which they could be transferred or settled between knowledgeable willing parties in an arm's-length transaction. The values can be calculated using one of two methods: best estimate plus risk margin; or as a whole. The first methodology involves projecting the probability-weighted future cash flows and required capital associated with the insurer's obligations and discounting the results back to the valuation date. The risk margin is included to ensure that the value is equivalent to the amount that another insurer would likely require in order to take over the insurance obligations. The cost-of-capital rate most recently tested was 6 percent. The best estimate liability may be negative. The second methodology uses the market value of a portfolio of replicating assets, which implicitly results in a prospective valuation. This method is appropriate if the future cash flows associated with the insurance obligations can be replicated reliably, using financial instruments for which a reliable market value is observable, such as the obligations in respect of unit-linked products.
22. Another difference relates to the effect of an entity's own credit standing in the valuation of its liabilities. Under IAS 39, a bank's financial liabilities can be adjusted for changes in its own credit standing. This allows a bank, the position of which is weakening, to book profits based on its theoretical ability to buy back debt at a reduced cost. Insurers will not have this option under Solvency II, which does not permit any adjustment to take account of the own credit standing of the insurer. However, this accounting difference does not provide an advantage to banks in the calculation of regulatory capital, because Basel III requires that common equity Tier 1 capital (CET) be adjusted by cumulative gains and losses due to changes in own credit risk on fair-valued financial liabilities.
23. These differences in accounting standards for banks and insurers suggest the following:
• Banks have greater flexibility than insurers regarding the valuation of financial liabilities. Banks can value liabilities using either amortized cost or at fair value through the profit and loss—although a bank cannot freely switch valuation bases, while insurers will be required to value them at fair value under Solvency II. The reported values of financial liabilities that are valued at amortized cost are more stable than those valued at fair value, which will move in response to changes in interest rates.
• The retrospective valuation of bank balance sheet items generates greater stability in the reported values. Banks have the ability to classify financial assets as loans or held to maturity, which enables them to value the assets using amortized cost. The assets of insurers change in value as interest rates move or credit spreads change, whereas bank assets that are valued using amortized cost will not. Even the new approach proposed by the International Accounting Standards Board (IASB) would still differ from a fair-value approach because, for example, movements in credit spreads will not automatically result in any change to the valuation of the asset. It is not until a loss event occurs that the bank would move the asset from the good book to the bad book and recognize the likely cost of default.
• The relative prudence of the different valuation methods in provisioning of banks and insurers depends upon the profitability of the business written. If a contract is expected to have positive future profitability, then the retrospective approach is more prudent, because the liability will be valued at book value and will not recognize the future profit that the company expects to earn on the contract. Under Solvency II, the insurer will be able to recognize this expected future profit upon writing the contract. However, if a contract is expected to produce future losses, then the prospective approach is more prudent, because those losses would be recognized upfront rather than spread over the remaining life of the contract as with the retrospective approach.Footnote 15 Another factor that affects the level of prudence is that insurers are required to include a margin in the liabilities in respect of the cost of capital, whereas banks do not include such a margin in their retrospective valuation of liabilities or in its loan provisioning.
24. Finally, important changes are underway at the IASB, which will affect the accounting of banks and insurers. In addition to the aforementioned IFRS 9, they include changes regarding the definition (IAS 32) and classification of financial instruments (IAS 39), and the recently-issued Exposure Draft on Insurance Contracts (IFRS 4). In addition, the IASB is currently consulting on a requirement for balance sheet loans to bear an expected loss provision throughout their life. In November 2009, the Board issued an exposure draft proposing the adoption of an expected loss model for recognizing credit losses. The IASB has also agreed to incorporate an incurred loss model on top of the expected loss model, often referred to as a good book (expected loss model)/bad book (incurred loss model) approach. The BCBS supports the use of more forward-looking provisions. The effects of these changes are unclear.
C. Differences in the Ability to Change Assets and Liabilities
25. Banks and insurers manage differently the risk profile of their assets and liabilities. They typically do so to reduce overexposure to particular risks or to free up capacity to take on more business. The ways in which this is accomplished can differ significantly by sector.
26. Banks commonly securitize loan assets and sell them into the capital markets. Securitization can reduce exposure to a particular type of loan, type of borrower, or geographic area. By removing assets from the balance sheet, it may also release regulatory capital, which can then be used to support additional loans. However, a securitization must be of sufficient size to make the transaction economically viable. Sometimes, as in collateralized debt obligations (CDOs), securitizations are repackaged into another securitization.Footnote 16
27. Insurers commonly use reinsurance and, less frequently, capital market instruments to transfer risk. Reinsurance can be used to cover individual risks (i) to share the underwriting risk on a particular portfolio; (ii) to prevent the absolute scale of any loss exceeding a particular amount; (iii) to stabilize experience; (iv) to provide capital support; (v) to release future profits; and (vi) to protect against catastrophes. It offers significant flexibility to insurers to alter the nature of the risk that they hold on their balance sheet and allows them to tailor the exact form of underwriting risk that they wish to take, and it can also be structured to transfer credit risk or market risk. Many types of reinsurance enable an insurer to reduce the insurance liabilities held on its balance sheet. However, because an insurer remains liable to its policyholders in respect of the benefits that have been reinsured, reinsurance essentially transforms underwriting risk into counterparty credit risk. This counterparty risk can be protected against using methods such as depositing assets back with the insurer or providing collateral. Much less frequently, insurers limit their exposure to extreme nonfinancial underwriting risks to others through the capital markets, using insurance-linked securities (ILSs). Similarly to reinsurance, ILSs limit the risk exposure, but they do not take the liability off an insurer's balance sheet. For many insurance liabilities there is simply no secondary market, which impacts on an insurer's ability to offload risk and also on the ability to value insurance liabilities.
28. Finally, both banks and insurers use derivatives to manage risks, but generally with different purposes. Banks use derivatives mainly to hedge exposures arising from their trading activities, as well as credit default swaps (CDSs) to limit risks associated with their lending activities.Footnote 17 Life insurers use derivatives to hedge exposures to market risk as part of their asset-liability management (ALM) programs.Footnote 18
D. Different Treatment of Similar Products
29. Banks and insurers compete both on products that are predominantly investments in nature and those that predominantly provide protection. Examples of investment products that are written by both banks and insurers include investment bonds, term deposits offered by banks, and term-certain annuities offered by insurers. Examples of protection products include: (i) investment guarantees and options written by investment banks and variable annuities with investment guarantees written by insurers; (ii) CDSs written by both banks and insurers; and (iii) trade finance offered by banks and surety bonds offered by nonlife insurers.Footnote 19
30. Different tax and capital treatments of such products can generate opportunities for product and capital arbitrages. Although these products offer similar economic benefits to customers and expose financial institutions to similar economic risks, differences in the manner in which they are taxed—with respect to either the financial institution or the consumer—can affect the related assets or liabilities. For example, in some jurisdictions savings products offered by life insurers provide for the deferral of tax on related investment income until the policy benefits are paid, while the income on bank deposits is taxed annually. This may discourage withdrawals from the insurance policies, subjecting an insurer to less liquidity risk than a bank that offers a similar savings product (unless the tax regime changes in a way that creates an incentive for the insurance policyholder to withdraw). In addition, differences in their capital treatment under the two accords can generate opportunity for arbitrage across sectors as discussed in Section VI.
E. Implications
31. The aforementioned differences between banks and insurers reflect the fundamentally different roles played by these intermediaries in the financial system. Banks are a reflection of money serving as a means of payment in exchange. Their comparative advantage is to screen projects and finance them over the short term. This short-term maturity transformation calls for the existence of safety nets to protect depositors against liquidity shocks. Insurers, instead, (especially life insurers), are a reflection of money serving as a store of value, permitting deferred consumption and smoothing. Their comparative advantage (strictly as investors) is to invest in long-term securities and benefit from their illiquidity premium. The different types of intermediation of banks and insurers already suggests capital needs to protect entities against unexpected shocks should be different across sectors.
32. The aforementioned differences can have a range of implications. For instance, the assets and liabilities of insurers are more often linked to one another (due to the liability-driven business model of insurers and strict matching requirements of ALM programs) than are those of banks (where links exist mainly through a network of financial exposures). This reduces their liquidity risk and need for external funding. Also, due to liquidity risk, the need for funding, and the effects on loan defaults, banks have more short-term exposure to changing economic conditions than insurers. For banks, the credit risk can be transferred through securitization, but the liquidity and funding risks are more difficult to deal with.Footnote 20
For insurers, reinsurance represents an additional tool—unavailable to banks—that can alter the nature of their balance sheet. This, as discussed in Section VI, could provide insurers with additional degrees of freedom to reduce their cost of capital. Furthermore, there is a much greater degree of interconnectivity among banks, especially through the interbank market, than there is among insurers. Therefore, there is generally a much greater risk that the failure of a single bank could have systemic implications (Geneva Association, 2010). However, if an insurer is significantly involved in activities—such as providing protection against credit exposures—which are closely linked to the broader financial sector—then its failure could likewise have systemic implications. Finally, insurers—especially life insurers—have more long-term exposure to changing economic and other conditions than banks because of the nature of their liabilities. ALM can be used to help deal with the economic risks. However, without effective ALM, the prospective nature of liability valuation can accentuate the effects of economic changes on the balance sheet.
33. More importantly, the aforementioned differences justify many but not all the differences in the respective capital accords. In particular, Basel III reflects the general realization that capital has failed (because deemed ex post insufficient and of poor quality) during the recent crisis to protect banks and tax payers from unexpected losses. This issue does not primarily guide Solvency II, as insurers have proved to be more resilient to the same shocks. Notwithstanding this observation, several differences in the two accords (as we will see in the next sections) are not supported by differences in the nature of capital needed in the two sectors, potentially generating unintended consequences.
III. Overview of the Two Accords
34. Basel III and Solvency II aim to ensure sufficient regulatory capital is held by banks and insurers. Basel III aims to increase the quality and level of capital (and to reinforce banks’ liquidity risk management) in an incremental fashion to the existing regime. Solvency II does not have the same objective: it aims to increase the protection of policyholders by creating incentives for good risk management and ensuring that the quantity/quality of capital required is calibrated to risks that insurers’ are exposed to.
35. Basel III and Solvency II have had completely different and independent development processes. These two international accords have different histories: Basel III has been developed over the last two years in reaction to the recent financial crisis, while Solvency II is the first attempt to develop a fully risk-based solvency standard for the European insurance industry, and has had a much longer gestation. The differences in the nature of the respective standard setters, their objectives, and their largely independent development processes have affected the accords and their scope of application. Finally, at the time of writing, the two accords are yet to be finalized.
A. Key Elements of Basel III
36. Basel III has been developed by the BCBS in reaction to the recent financial crisis. The BCBS consists of senior representatives of bank supervisory authorities and central banks from and central banks from the major financial centers, including all G20 jurisdictions.Footnote 21 It is intended to apply to internationally-active banks, on a fully-consolidated basis. Basel III evolved from the Basel II framework, and now includes liquidity requirements and gives increased attention to dealing with system-wide issues, such as the interaction of prudential requirements and economic conditions.
37. In order to implement Basel III in a particular jurisdiction, its requirements generally must be transposed into local legislation. For example, in the EU this requires a directive as well as, possibly, regulations, which need in turn to be transposed into legislation in the member countries. Many jurisdictions that are not members of the BCBS also seek to implement the Basel accords because of the international character of the banking business. Furthermore, some jurisdictions apply the Basel accord, although sometimes with simplifications, even to banks that are not internationally active.
38. Although the basic framework of Basel II has been retained in Basel III, many of its elements have been strengthened, including the following:Footnote 22
• Early reforms to Basel II were agreed in July 2009, which will raise capital requirements for the trading book, complex securitization exposures, and securitizations in both the banking and the trading books. The reforms immediately raised the standards of the Pillar 2 supervisory review process, and the capital requirements and related disclosures are to be implemented by the end of 2011.
• Basel III requires that Tier 1 capital must be of higher quality—focusing on common equity; harmonizes Tier 2 capital instruments; and eliminates Tier 3 capital instruments, which had been available to cover market risks. All elements of capital will be required to be disclosed, along with a detailed reconciliation to the reported accounts. A leverage ratio will also be applied to provide an extra layer of protection against model risk and measurement error.
• It includes measures to strengthen the capital requirements for counterparty credit exposures arising from derivatives, repo, and securities financing activities. The changes were designed not only to increase capital requirements, but also to reduce procyclicality and to provide incentives to move derivative contracts to central counterparties.
• It introduces a framework designed to promote the conservation of capital and the build-up of buffers that can be drawn down in periods of stress. The capital buffer range can be adjusted in response to signs that credit has grown to an excessive level.
39. Basel III also introduces internationally-harmonized liquidity standards.Footnote 23 The Liquidity Coverage Ratio (LCR) is designed to measure whether a bank has sufficient high-quality liquid resources to survive an acute stress scenario lasting for one month, while the Net Stable Funding Ratio (NSFR) has a time horizon of one year and helps to determine whether there is a sustainable maturity structure of assets and liabilities.
40. A long transition period is foreseen for the implementation of Basel III. Although Basel III is effective from January 1, 2013, some items are subject to phase-in arrangements; for example:
• The Leverage Ratio must be disclosed beginning in 2015 and becomes a Pillar 1 requirement in 2018;
• The Minimum Common Equity Capital Ratio reaches its ultimate level in 2015;
• Various deductions from common equity are phased in between 2014 and 2018;
• The Minimum Tier 1 Capital requirement reaches its maximum in 2015;
• The Capital Conservation Buffer is introduced in 2016 and reaches its ultimate level in 2019;
• Capital instruments that no longer qualify as noncore Tier 1 or Tier 2 capital are phased out over a 10-year horizon beginning in 2013; and
• Minimum standards will be introduced for the LCR in 2015 and the NSFR in 2018.
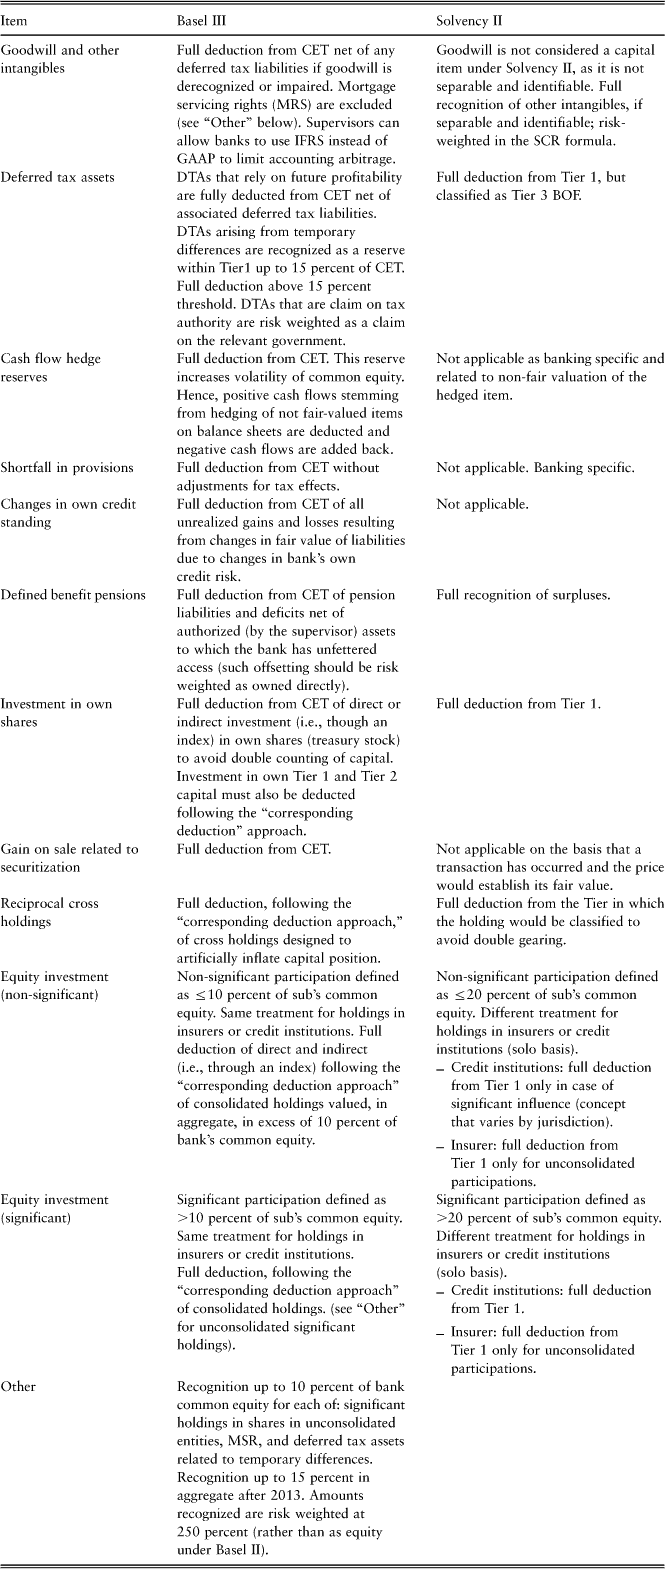
41. Finally, additional reforms are also being considered. Looking to the future, the BCBS is promoting stronger provisioning practices by advocating a change in the accounting standards toward an expected loss approach, updating supervisory guidance, and providing incentives in the regulatory capital framework. It is also conducting fundamental reviews of the trading book and the securitization framework.Footnote 24
B. Key Elements of Solvency II
42. By contrast, Solvency II originated from the European Commission and not from the IAIS, the insurance equivalent of the BCBS. Solvency II applies to almost all insurers operating in the European Community. This includes small, local insurers, except for those with gross premium income below EUR 5 million. Its requirements are also relevant to reinsurers or groups based outside the European Community but operating therein, which can be treated more like local insurers with respect to reinsurance, group solvency, and group supervision if their home supervisory regimes are assessed as equivalent by EIOPA.
43. Solvency II is broader in scope than Basel III. It attempts to create a comprehensive, principles-based system of regulation and supervision. In addition to establishing risk-based capital adequacy requirements, it consolidates 14 existing insurance directives and deals with such topics as the valuation of assets and liabilities, group supervision, and the winding up of insurers.Footnote 25
44. Several levels of legislation must be in place for Solvency II before it takes effect on January 1, 2013. The Level 1 directive was approved by the Council of Ministers and the European Parliament in 2009. Various consultations and quantitative impact studies have since taken place, including the recent QIS5. A proposed revision to the Level 1 directive was published by the Council of the European Union on June 7, 2011 and is not expected to be finalized until early 2012. Level 2 implementing measures are currently expected to be published in Quarter 1 2012. EIOPA is expected to submit draft binding technical standards to the European Commission in Quarter 2 of 2012 and to publish Level 3 guidelines in Quarter 3 of 2012.
45. Finally, there is a wide range of issues on which decisions remain to be taken in arriving at the final requirements and guidelines, including the following:
• Assessment of the adequacy of the calibration of quantitative requirements;
• Determination of the risk-free interest rate curve used for discounting technical provisions and the use of transitional measures;
• Development of actuarial guidelines for the calculation of the best estimate;
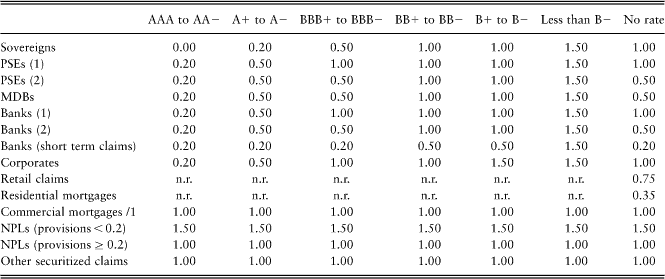
• Assessment of the consistency between IFRS valuation and Solvency II valuation approaches;
• Assessment of the complexity of the Solvency Capital Requirement (SCR) standard formula and the need for simplifying the standard formula;
• Calculation of the group SCR (including group-specific risks);
• Based on the data gathered during QIS5, considering the grandfathering of existing capital items;
• Development of guidelines to allow insurers to apply for the use of an internal model;
• Transitional periods for a number of items;
• Development of guidelines on own-risk and solvency assessment (ORSA); and
• Development of guidelines on the supervisory review process.
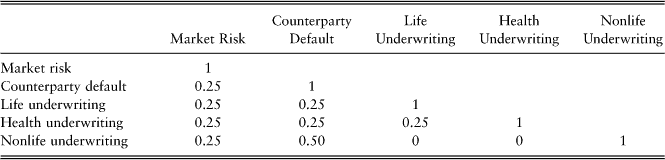
C. Implications
46. The implications of the different situations described above are somewhat uncertain. In general, since Solvency II does not have the same explicit objective to increase capital as Basel III, capital costs for the two sectors could rise asymmetrically, possibly promoting inappropriate risk migration from banks to insurers. However, under both accords, there are still aspects of the requirements that are yet to be finalized and which could result in additional unintended consequences. Some of these, such as the calibration of quantitative requirements, could affect the opportunities for cross-sectoral arbitrage. Within the European Community, the overall legal and regulatory framework should produce relatively consistent implementation of both Basel III and Solvency II from one jurisdiction to another. However, among other jurisdictions, only peer pressure will limit the variations in Basel III implementation. The influence of Solvency II outside the European Community will be even less certain, depending on such factors as the results of the equivalence assessments, IAIS deliberations, and the outcome of its implementation within the European Community. In particular, the confined geographical application of the Solvency II framework could generate opportunities for insurers to reduce the cost of capital through the use of reinsurance in non-equivalent jurisdictions with weaker solvency and supervisory standards, if the capital charges required against the credit risks introduced by such reinsurance contracts are not set appropriately.
IV. Pillar 1: Components of Capital
47. Pillar 1 requirements of both Basel III and Solvency II deal with two fundamental issues: the amount of capital that is needed to support an entity's business and its components (or types of resources) that are considered to be capital available to meet those needs. The former is discussed in Section V of this paper, while this section deals with the components of capital.
48. In both accords, the primary role of capital is to absorb unexpected losses and thus enable an entity to meet its obligations. Under both accords, an entity should have enough capital to absorb losses and support its continuation as a going concern. But at the very least, an entity should have sufficient capital to meet its existing obligations if it were to cease carrying on business. Consequently, there are two general types of capital on the balance sheet: (i) capital that absorbs losses on a going-concern basis; and (ii) subordinated liabilities that absorb losses on a gone-concern basis. Subordinated liabilities help to ensure that depositors, policyholders, and senior creditors can be repaid in the event an entity is wound up. Solvency II also recognizes certain off-balance sheet instruments as Ancillary Own Funds (AOF): capital that can be used to meet the going-concern Solvency Capital Requirement (SCR), but not the gone-concern Minimum Capital Requirement (MCR). In both sectors, supervisors seek to ensure that capital will be sufficient, even under stressful conditions, on both going-concern and gone-concern bases.
49. Both accords follow a similar process to determine capital. General-purpose financial statements report the assets and liabilities of an entity on a going-concern basis, with capital being simply the excess of assets over liabilities. However, some assets might be subject to restrictions that would limit their ability to absorb losses or might lose considerable value under stressful conditions. Accordingly, not all capital is of equal quality. In both sectors, the determination of required capital is based on a three-step process: calculating the amount of required capital; classifying the capital into various categories; and assessing the eligibility of instruments for each category.
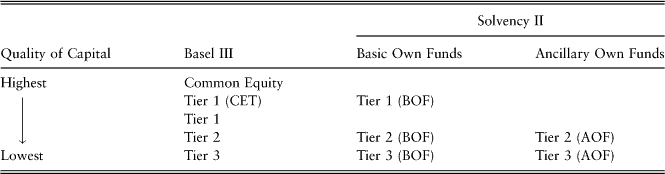
50. Also, both accords provide for a system of capital tiers that, however, are quite different from one another. The use of explicit capital-tiering rules has not been as prevalent or long-standing in the insurance sector as in banking. Insurers have traditionally had simpler, equity-focused capital structures. They have also been able to use reinsurance to strengthen their capital positions rather than having to issue lower-quality capital instruments. Nonetheless, although both accords define various categories of capital, they are not consistent with one another in terms of the categories, the terminology used to describe the categories, or the criteria applied to determine what goes into a similar category. The categories are shown in Table 1.
Quality of Capital under Basel III and Solvency II
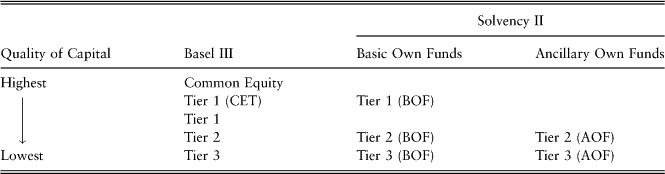
51. Some of the inconsistencies in the tiers can be explained by differences in the business models. All capital recognized under Basel III is on the balance sheet, while the AOF under Solvency II are not. The inclusion of such instruments, which can be called upon to absorb losses in the capital available to meet the Solvency Capital Requirement (SCR)—but not the Minimum Capital Requirement (MCR)—may be economically justified because the insurance business is less subject to the risk of runs.
52. However, some of the inconsistencies have no basis in business or valuation differences. Examples include differences related to regulatory adjustments to capital, such as intangibles other than goodwill, deferred tax assets, and excess assets related to employee pension benefits. For instance, the tightened requirements under Basel III to avoid double-gearing stemming from equity participation in subsidiaries still allow for exceptions that provide some scope for double-gearing, even if more stringent risk weighting is used to compensate in such situations.Footnote 26
53. Basel III has reformed the treatment of market risk and eliminated Tier 3 capital. Although Basel II provided for three tiers of capital, the classification structure under Basel III has been simplified into two tiers: Tier 1 is going-concern capital; and Tier 2 is gone-concern capital. Basel III includes a series of classification criteria, which relate to permanence, loss absorbency, and flexibility of payments. Within Tier 1, the common equity component (CET) has been specifically identified because a minimum portion of the required capital must be met using common equity. Tier 3 instruments, which can be used under Basel II to cover market risk, large exposures in the trading book, and fixed overhead requirements, are not eligible capital under Basel III.
54. Finally, Basel III is also considering bail-in capital proposals, the discussion of which is less advanced in the context of Solvency II. The recent financial crisis has created a concern that governments were bailing out not only consumers but also investors, as they assisted banks financially in order to avoid systemic failure. The use of contingent capital and other hybrid instruments has been suggested as one way to help deal with such situations in the future (Box 1). They can take a variety of forms, but are essentially debt instruments that convert to capital under stressful conditions. They do not provide new funds in a stress situation but only change the nature of the financial claim and its regulatory treatment. Their complexity could undermine the comparability of capital across sectors and potentially impact risk taking by the entities, while their acceptance by investors is still uncertain. Discussions regarding the possible use of contingent capital under Solvency II are less developed, perhaps as a consequence of the absence of agreement on the systemic relevance of insurance entities (Geneva Association 2010 and CEA 2010) or perhaps because reinsurance arrangements achieve already similar effects.
Basel III Bail-in Capital Proposals
Bail-in refers to a scenario where non-equity claims are converted into equity to facilitate resolution of institutions. Upon a trigger event (which need not be the point of non-viability), senior creditors’ and regulatory capital providers’ claims are reduced to create equity and allow a bank to continue as a going concern. Bail-in instruments can be contractual when the trigger is pre-determined in the contractual provisions between the issuer and the investor (as in the case of convertible bonds and contingent capital), or statutory when the trigger is determined by the relevant authority.27
The key objectives of bail-in features are to increase the loss-absorption capacity of capital while containing the costs of raising it. In addition, they are thought to reduce the funding advantage (moral hazard) of systemically-important institutions by providing an additional statutory mechanism to the relevant supervisory authority to impose losses on unsecured creditors before the point of non-viability and, hence, to stem financial contagion. As such, they aim at eliminating one of the market imperfections invalidating the Modigliani-Miller theorem that artificially reduces banks’ cost of funding and capital relative to insurers.
Key feasibility issues still need to be resolved if these objectives are to be achieved. To name a few: (i) the bail-in regime could apply to only capital instruments or all non-equity liabilities, depending on the tradeoffs between market discipline and cost of capital; (ii) the design of the conversion trigger is crucial in many respects, since too high (low) a level trigger increases (reduces) market discipline but increases (reduces) cost of capital; (iii) so far, it is unclear whether a sufficiently high trigger would actually prevent contagion, especially given the difficulty of accounting for cross-border problems and mobility of capital within a financial group; (iv) the investor base for bail-in instruments is undetermined, as it needs to be ex post fit and proper and able to absorb the risk transfer without further fiscal or financial spillovers; (v) the pricing of these instruments is difficult, especially in the neighborhood of the statutory non-viability determination, where an obvious discontinuity is introduced; (vi) statutory bail-in features raise legal concerns regarding rights of claimants28 as well as their hierarchy after the trigger is hit; (vii) accounting and tax treatment of bail-in instruments needs to be defined; and (viii) finally, even if feasibility concerns are overcome, it is unclear that bail-in instruments under Basel III would constitute any meaningful, practical advancement relative to the unsuccessful experience of subordinated debt under Basel II.
Bail-in proposals for banks could have an ambiguous impact on potential regulatory arbitrage with insurers. Their successful design and adoption are likely to, everything else being equal, strengthen market discipline, improve resolvability and, hence, eliminate the capital and funding advantage of systemically-important banks relative to insurers. In other words, bail-in instruments would increase the average cost of capital for banks and encourage risk to migrate from banks to insurers. Alternatively, if they prove as successful as subordinated debt in imposing losses on unsecured creditors, then the cost of capital for banks could actually decrease relative to insurers (see Section VI on unintended consequences).
A. Loss-Absorption Capacity
55. Under both accords, different tiers have different loss-absorption capacities. For both Basel III and Solvency II, Tier 1 consists of capital that is fully loss-absorbent on a going-concern basis and Tier 2 is capital that absorbs losses on a winding-up basis. However, Solvency II also provides for a Tier 3, which consists of own funds other than Tier 1 and Tier 2. The classification criteria under Solvency II include subordination, loss-absorbency, permanence, perpetuity, and absence of servicing costs. Ancillary items that would convert to Tier 1 capital, when called, are classified as Tier 2 AOF, while those that would convert to Tier 2 capital are classified as Tier 3 AOF.
Common Equity Tier 1
56. In both sectors, items of highest quality are eligible without limit toward meeting the capital requirements. Basel III specifically identifies common equity as the highest-quality subset of Tier 1 capital. Although the Solvency II Directive does not make a distinction within Tier 1, the QIS5 technical specifications provide a list of items that can count without limit in Tier 1. Basel III sets out 14 criteria that must be met in order for an instrument to be included in CET, while Solvency II sets out only 5. The Basel III criteria are more detailed than, but do not contradict, either the Solvency II Directive or the QIS5 technical specifications.
Additional Tier 1 Capital
57. Under Basel III, additional Tier 1 capital refers to instruments that combine both equity and debt characteristics. They can be included in Tier 1 in a certain proportion and under certain conditions. Basel III sets out another 14 criteria that must be met in order for an instrument to be included in additional Tier 1 capital. For instance, instruments must be sufficiently loss-absorbent on a going-concern basis, which means that, among other things, they need to be subordinated, have fully discretionary noncumulative dividends or coupons, and have neither a maturity date nor an incentive to redeem. The innovative and dated hybrid instruments that were allowed under Basel II, are not allowed under Basel III.
58. Under Solvency II, similar provisions apply. Under QIS5 technical specifications, up to 20 percent of total Tier 1 capital can consist of paid-in capital instruments other than common equity. These instruments include preference shares, subordinated liabilities, and subordinated mutual member accounts that meet specific criteria.
59. Beyond these broad similarities, there are many differences in the detailed criteria applied under the two accords. Some of the most significant differences relate to permanence, flexibility of payment, and loss absorption, as follows:
• Basel III does not allow dated instruments in Tier 1, while Solvency II allows 10-year dated instruments. This difference could be justified by the matching of assets and liabilities in the insurance sector. Solvency II requires that the duration of the item be compared to the duration of the insurance and reinsurance obligations; and that any redemption or repayment be subject to supervisory approval and be automatically suspended when there is a breach of the SCR.
• Basel III prohibits a bank from exercising a call unless it either: replaces the instrument with capital of the same or better quality at conditions that are sustainable for the income capacity of the bank; or demonstrates that its capital position is well above the minimum after the call is exercised. Solvency II does not impose a similar requirement.
• The Alternative Coupon Settlement Mechanism (ACSM, whereby a coupon is paid in shares if it cannot be paid in cash) is no longer allowed under Basel III, but is still allowed under Solvency II.
• Solvency II requires that coupons must be cancelled when there is a breach of the SCR. Basel III does not explicitly require such cancellation.
• Basel III requires that instruments accounted for as liabilities must have a loss-absorption mechanism, such as a write-down or conversion of principal, but Solvency II does not.
• Solvency II is more explicit than Basel III with respect to the mechanics of conversion, for example, requiring that an item must convert automatically into ordinary shares.
• Solvency II specifies the trigger point as a significant breach of the SCR, while Basel III does not specify the level of the trigger.
60. Also, several insurance-specific items are included in Tier 1 capital under Solvency II, but are not recognized as capital under Basel III. In certain jurisdictions, either law or an insurer's by-laws may require that reserves be established, which can only be used for prescribed purposes. Reserves of this nature are only eligible for inclusion in capital in relation to the risks they cover. Also, surplus funds are deemed to be accumulated profits which have not been made available for distribution to policyholders and beneficiaries. Unless otherwise provided by law, surplus funds are not to be considered as insurance liabilities and they would therefore be classified as Tier 1 capital.
61. The most significant insurance-related item is the expected profits included in future insurance premiums under in-force insurance policies. Under Solvency II, available capital reflects the difference between the market value of the assets and the market value of the liabilities. The value of liabilities takes into account expected future insurance premiums,Footnote 29 even if the policyholder is not contractually committed to making the premium payments, and therefore includes the future profits inherent in those premiums. This portion of the liabilities provides some loss-absorption capacity, which might be recognized as capital.
62. However, expected profits included in future insurance premiums are not always fully recognized as capital. For example, both Solvency I and some individual jurisdictions, such as the United Kingdom, currently limit the extent to which future profits on insurance policies that have guaranteed surrender values can offset losses on insurance policies. The treatment of expected profits included in future insurance premiums under Solvency II remains uncertain. EIOPA has expressed the view that expected profits included in future premiums should be classified in Tier 3, because this item does not possess the characteristics necessary to be considered as Tier 1 or Tier 2 capital. However, the EC decided to classify this item as Tier 1 for QIS5 purposes. The amount of expected profits included in future premiums has been tested under QIS5 and the classification is expected to be revised.
63. Banks also recognize the expected profits included in future cash flows as capital, but only if such cash flows are contractually committed. The treatment of expected profits for insurance policies in force is similar to, but goes beyond, the manner in which contracts with expected future cash flows are dealt with under Basel II and Basel III. For example, trading in market instruments such as interest rate swaps is accounted for at fair value, thus recognizing the future profits inherent in such contracts. However, in the banking sector, all such future cash flows are contractually committed.
64. Finally, the bases used to calculate the limits on additional Tier 1 capital differ by sector. Under Basel III, limits are based on the amount of CET, which means that if CET decreases when losses occur, the eligible amount of additional Tier 1 capital also decreases. Under Solvency II, limits are based on the amount of the SCR. However, in both cases any capital in excess of the limits is not counted within any part of regulatory capital.
Tier 2 and Tier 3 Capital
65. The main differences with respect to Tier 2 capital are in the criteria related to permanence. Basel III does not allow any incentives to redeem, such as step-ups, while Solvency II allows incentives to redeem after five years. However, Solvency II would deem a step-up associated with a call to be equivalent to a maturity date. Under Basel III, recognition in eligible Tier 2 will be “amortized” on a straight-line basis during the final five years to maturity, while Solvency II does not require amortization. However, under Solvency II the lock-in clause would prevent repayment if this would lead to breach of the SCR.
66. Again, many insurance-specific capital items are not recognized under Basel III. As is the case for Tier 1, several items that are included in Tier 2 or Tier 3 capital under Solvency II, are not recognized as capital under Basel III. They consist of the following items:
• Called-up but unpaid capital is included in Tier 2 basic own funds (BOF), which is justified by the long time horizon of the insurance business;
• Unpaid capital and not called-up share capital are included as part of AOF;
• Any future claims that mutual or mutual-type associations with variable contributions may have against their members, by way of a call for supplementary contributions within the following 12 months, are included in Tier 2 AOF;
• Any future claims that mutual or mutual-type associations of ship owners with variable contributions solely insuring risks to ships (sea, lake, and river and canal vessels), liability for ships (sea, lake, and river and canal vessels), and the legal expenses and costs of litigation may have against their members, by way of a call for supplementary contributions within the next 12 months, are included in Tier 2 AOF; and
• Letters of credit (LOC) and guarantees that are provided by authorized credit institutions and held in trust for the benefit of insurance creditors by an independent trustee, and are currently being used to meet solvency requirements under Solvency I, and included in Tier 2. Other LOC that generate capital once called up can be included subject to prior supervisory approval.
• The treatment of the provisions included by Basel II in Tier 2 under the standardized and internal ratings-based approaches to credit risk, including the treatment of the cap (in other words, the 1.25 percent and 0.6 percent of credit risk-weighted assets under the SA and IRB approaches, respectively) is still to be considered.
B. Regulatory Adjustments to Capital
67. Substantial differences exist in the regulatory adjustments to capital allowed under both accords (Table 2). Basel III strengthens the standards for regulatory adjustments relative to Basel II. Under Basel III, deductions and prudential filters (“regulatory adjustments” or “capital deductions”) are mainly applied at the level of CET or sometimes at the level of other tiers. Solvency II also considers regulatory adjustments to Tier 1 or Tier 2 depending on the instrument.
68. Some of the differences arise from differences in the underlying valuation principles rather than real differences in what is considered capital (Table 2). If an item is given no value under the fair-value approach required by Solvency II, it has the same effect as deducting its value under Basel III. For instance, investments in own shares are not deducted under Solvency II because common equity is only included on a net basis to begin with. Also, it is not necessary to deduct goodwill under Solvency II, because it is not considered an identifiable and separable asset, so it is assigned no value. Finally, own credit risk is not considered when valuing financial liabilities under Solvency II, so changes in own credit risk do not create gains or losses.
69. However, seemingly inconsistent differences do exist in the treatment of several items (Table 2).Footnote 30 For instance, the deduction of intangible assets other than goodwill, such as software, under Basel III recognizes that in periods of stress those assets are likely to have little value. Under Solvency II, although this risk should be recognized by a risk surcharge when calculating the SCR, there is no requirement that this portion of the SCR be covered by a specific type of capital. Similarly, under Basel III, deferred tax assets resulting from tax loss carried forward are fully deducted, while DTA resulting from timing differences are deducted above a certain threshold. Under the Solvency II QIS5 technical specifications, no such differentiation is made and the net DTA are deducted from Tier 1, but classified as Tier 3 BOF. Also, employee-defined benefit pension fund assets and liabilities are excluded when calculating capital under Basel III, but not under Solvency II. Solvency II in effect assumes that an excess of assets over liabilities would be available to meet other obligations, while Basel III in effect assumes that the rights of employees might prevent this.Footnote 31 In addition, Basel III requires that the premium attached to any shares excluded from CET also be excluded from CET, and instead be included in the same Tier as the shares to which they relate. Solvency II does not indicate such treatment. Finally, the treatment of equity investment in financial entities and the methods used to apply regulatory adjustments are different under the two accords.Footnote 32
70. Finally, Basel III and Solvency II use different methods to apply regulatory adjustments to capital at a group level. In the banking sector, deductions are applied following the “corresponding deduction approach.” In other words, a deduction would be applied to the same component of capital for which the capital would qualify if it was issued by the bank itself. In the insurance sector, deductions are applied following the “deduction and aggregation” method. In other words, after the participation is deducted from the participating entity's own funds, capital requirements and own funds of the participated entity are added proportionally to the ones of the participating entity. The method used in the banking results in a smaller transfer of resources from the participated to the participating entity. Hence, it is more prudent when the participated entity is in surplus, but it is less prudent when the participated entity is in deficit.
C. Implications
71. The difference in criteria used to determine capital eligibility of instruments impacts on the relative cost of capital. Both sectors have access to the same capital markets for raising funds, so differences in the criteria used to determine the eligibility of an instrument as regulatory capital might lead to differences in the cost of capital and regulatory arbitrage across sectors. In addition, the treatment of various types of claims, such as those of consumers and providers of various forms of capital—including reinsurers, under winding-up legislation—could affect the availability and cost of capital.
71. Also, the differences in regulatory adjustments to capital and their methods of application impact on the relative cost of capital. The higher threshold for defining significant participations (20 percent under Solvency II and 10 percent under Basel III) appears to suggest a larger scope for double gearing under Solvency II than Basel III.Footnote 33 In addition, the method used under Solvency II can result in a higher variance of the solvency position of the participating entity. If this translates into a higher risk-adjusted expected profitability, then the cost of capital should be lower than for the banking sector (other things being equal).
V. Pillar 1: Required Capital
73. Both Basel III and Solvency II prescribe risk-based approaches for determining the amount of capital that is needed to support an entity's business. The details of each accord are complex and include various alternatives, such as the use of standardized approaches or internal models. This section examines key aspects of the determination of required capital, focusing on differences between the standardized approaches of the two accords.
A. Overall Methodology
Basel III
74. Basel III continues the same overall methodology as Basel II for determining required capital. The aggregate level of risk of a bank is expressed in terms of an equivalent amount of risk-weighted assets, with required capital being expressed as a percentage of the total risk-weighted assets. The calculations of risk-weighted assets are performed separately for each of the three main areas of risk: credit risk, market risk, and operational risk. The results are added together, without adjustment for possible correlations, to arrive at the total requirement.
75. Standards for defining minimum capital requirements are also maintained, but considerably strengthened. Basel III continues not to explicitly specify a supervisory control level of capital in probabilistic terms like Solvency II. However, as mentioned in Section IV, it does establish requirements for the minimum levels of both CET and total capital, and it introduces a capital conservation buffer. These requirements serve similar purposes to the “probability of ruin” for insurers in differentiating the level of capital required of a going concern from that of a gone concern and providing a basis for early supervisory intervention. Important modifications include a more stringent minimum common equity capital ratio and the introduction of a capital conservation buffer, a countercyclical buffer, a nonrisk-based leverage ratio, and additional requirements for systematically-important banks:
• The required ratio of CET to risk-weighted assets will increase from 2 percent to 4.5 percent by January 1, 2015, and will also incorporate stricter regulatory adjustments.
• The required Tier 1 capital ratio, which includes common equity and other qualifying financial instruments, will increase from 4 percent to 6 percent over the same period. The minimum ratio of total Tier 1 and Tier 2 capital to risk-weighted assets will remain at 8 percent.
• A capital conservation buffer of 2.5 percent, which will be phased in between 2016 and 2019, is to be met with common equity.
• A counter-cyclical capital buffer, within a range of zero percent to 2.5 percent of common equity or other fully-absorbing capital, will also be required if national circumstances show excess credit growth and system-wide risk.
76. Banks can use either standardized approaches or internal models for determining minimum required capital. The standardized approachFootnote 34 produces risk-weighted assets in a standardized and predefined manner, supported by external credit assessments.Footnote 35 The internal ratings-based approach (IRB) can be used with prior supervisory authorization and it is based on either only internal models or partially internal models and supervisory-provided risk factors. For market risk, banks must compute exposures based on the value at risk (VaR) model with a 99 percent (one tailed) confidence interval over a 10-day holding period on the basis of historical observations of a minimum one year. For credit risk, computation of exposures (both systematic and idiosyncratic) is based on the asymptotic single-risk factor (ASRF) model with a 99.9 percent confident interval and expected losses forecasted over a one-year horizon. For operational risk, the advanced measurement approachFootnote 36 (AMA) sets the regulatory capital in line with the results of the bank's own operational risk-measurement system on the basis of a VaR model with a 99.9 percent confidence interval over a one-year horizon.Footnote 37
77. While discretion exists to require higher risk weights, the IRB approach has resulted in lower risk weights. Supervisors can require higher risk weights under Pillar 2 than those provided for by the standard setter under Pillar 1, but this has seldom been done. Instead, the fundamental choice of Basel II was to promote the adoption of the IRB approach, which was designed to provide, on average, lower risk weights than those provided for under the standardized approach, as a way to promote risk-management capacity among banks.
78. Basel III also introduces new requirements to contain leverage and liquidity risk. The leverage ratio compares capital to non risk-weighted assets.Footnote 38 It was set at 3 percent in July 2010 and the BCBS agreed to test that minimum during a parallel-run period starting in 2013. Based on the results, any final adjustments will be carried out in the first half of 2017, with a view to moving to full Pillar 1 treatment on January 1, 2018. The net stable funding ratio (NSFR) measures how much stable funding a bank has to endure during a year long liquidity crisis. It complements the shorter-term liquidity coverage ratio (LCR).
79. Basel III strengthens the computations of market risk for extreme value events. For extreme value events, banks will now have to calculate a stressed VaR based on a 10-day, one sided 99 percent confidence interval. The stressed VaR needs to be calibrated to a period of significant and relevant financial stress that entails many degrees of freedom in calibration for the bank. The maximum of the stressed VaR and its average of the preceding 60 days (multiplied by 3) is to be added to the general capital charge. Additionally, the current specific risk charge (which will be subject to updates) continues to be required.
80. Finally, Basel III requires additional charges for systemically important financial institutions (SIFIs). In June 2011, the BCBS, together with the G20 and the FSB, agreed that larger banks would be subject to a capital surcharge ranging from 1 percent to 2.5 percent to be met through common equity and not through hybrid instruments. Such a requirement will be complemented with enhanced supervision. The purpose of introducing these additional measures would be to mitigate the risk that SIFIs pose to the local and global financial systems.
Solvency II
81. Solvency II uses both absolute and risk-based minimum capital requirements. As a start, there are different minimum absolute capital requirements depending on the nature of an insurer's business: EUR 1 million for a captive insurer; EUR 2.2 million to EUR 3.2 million for a nonlife insurer, depending on the classes of business written; and EUR 3.2 million for a life insurer or a reinsurer. There are then two risk-based levels of capital requirements: the MCR, representing the level of capital below which an insurer would be considered a gone concern, and the SRC, the level of capital required of an insurer to be considered a viable going concern, both introduced in Section IV.
82. The MCR and SCR are closely related and calibrated over a one-year horizon. The risk measure used under Solvency II to calibrate these requirements is value at risk (VaR) with the MCR calibrated at 85 percent VaR over one year, while the SCR is calibrated at 99.5 percent VaR over one year. Further work will be done on the calibration of risk parameters in areas such as nonlife underwriting risk and catastrophe risk in response to the results of QIS5. The SCR should always be higher than the MCR, but because they are calculated differently, this might not be the result. To deal with this possibility and to allow the SCR to serve as a control capital requirement, Solvency II caps the MCR at 45 percent of the SCR; it also establishes a floor for the MCR of 25 percent of the SCR. However, the MCR is subject to the aforementioned minimum absolute amounts, which, for a small insurer, might even be higher than 45 percent (or even 100 percent) of the SCR, thus overriding the cap. Finally, the MCR must be met by the eligible BOF of the insurer, while the SCR can be met by all eligible capital, including AOF.
83. Insurers can use either a standardized approach or internal models to calculate the SCR. The use of internal models follows a principles-based approach. Full internal models can be used or partial internal models can be used in combination with the standard formula. In either case, their use is subject to supervisory approval. Supervisors can impose capital add-ons to the SCR if they consider the risk profile of an insurer to be higher than that contemplated in the standard formula or if the internal model is not fully adequate.
84. Also, calculation methodologies vary by type of capital requirement. On the one hand, MCR calculations are not done on a per-risk basis, although such capital is intended to cover all risks to which an insurer is subject. Instead, risk factors are applied to various components of an insurer's premiums and liabilities. The calculations are linear and therefore do not take account of diversification effects or risk interdependencies. On the other hand, the SCR is calculated on a per-risk basis covering nonlife underwriting risk, life underwriting risk, health underwriting risk, market risk, counterparty default risk, and operational risk.Footnote 39 Scenarios are mostly used under the standard formula (for which they are required) and the internal models (for which, however, they are not required) to determine the required capital by assessing the effects that adverse future experience would have on the financial position of the insurer. In addition, calculations are prospective, as they include not only the existing portfolio of business, but also the new business an insurer expects to write during the next 12 months (although there is some uncertainty about how the new business requirement is to be applied). Finally, calculations are not linear, as they also take account of diversification and interdependencies.
85. Finally, capital requirements are recalculated frequently and insurers are subject to stress tests to ensure solvency. The MCR must be calculated quarterly. The SCR must be calculated yearly, although recalculation is also required whenever the risk profile of an insurer changes significantly. The period of historical data required to support the calculations is not specified, but the models should be recalibrated when Own Risk and Solvency Assessments (ORSAs) are performed. ORSAs serve several purposes, such as assessing overall solvency needs, comparing the risk profile to that underlying the SCR standard formula, and testing the ability to meet the SCR. However, the results of ORSAs are not themselves used to calculate the SCR.Footnote 40
B. Risk Aggregation and Dependencies
86. Despite the modifications to the Basel accord, risk weights under Pillar 1 still depend on portfolio invariance. This does not reflect the importance of diversification as an influence on portfolio risk, nor does it adequately penalize concentrations in the portfolio by requiring additional capital, which can instead be imposed by the supervisor under Pillar 2.
87. However, credit risk mitigation (CRM) techniques are recognized when determining required capital under Basel III. They include the use of (i) collateral; (ii) guarantees; (iii) credit derivatives; and (iv) claims netting.Footnote 41
88. Collateral posted by a counterparty or by a third party can hedge credit exposures, either fully or partially. Banks can choose between two approaches: the simple approach or the comprehensive approach. Under the simple approach, banks can substitute the risk weight of the collateral for the risk weight of the counterparty, subject to a 20 percent floor. Under the comprehensive approach, they can reduce the risk weight of the counterpart by the risk weight ascribed to the collateral. In doing so, they are required to adjust both the amount of the exposure to the counterparty and the value of any collateral, using haircuts, and to take account of future fluctuations in either.
89. Third-party guarantees or credit derivatives can be used to reduce credit exposure when they are direct, explicit, irrevocable, and unconditional. Supervisors must also be satisfied that banks fulfill certain minimum operational conditions relating to risk-management processes and the guarantors must be recognized by the supervisor. In such cases, the hedged portion of the exposure is assigned the risk weight of the guarantor or protection provider.
90. Credit risk mitigation (CRM) techniques can give rise to maturity mismatches. Where there is a maturity mismatch and the CRM has an original maturity of less than one year, the CRM is not recognized for capital purposes. In other cases, where there is a maturity mismatch, partial recognition is given to the CRM for regulatory capital purposes.
91. On-balance sheet netting can be allowed if risk-management processes meet certain operational conditions. In particular, a bank needs to be able at any time to determine those assets and liabilities with the same counterparty that is subject to the netting agreement. In such cases, assets (loans) are treated as exposure and liabilities (deposits) as collateral. The haircuts will be zero except when a currency mismatch exists.
92. Under Solvency II, diversification effects and risk interdependencies are reflected in the standard formula for SCR using correlation matrices. Adjustments are applied at various levels: within the same risk class and business line; within a risk class and across business lines; across risk classes; and at a group level. For example, the correlations across risk classes are based on the matrix shown in Table 3. The application of correlations can reduce the requirements significantly, compared to a linear combination.
Solvency II Correlations among Risk Classes
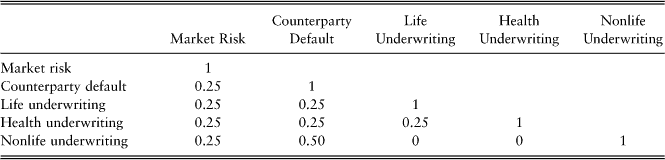
Source: QIS5 Technical Specifications.
93. Concentrations affect the calculation of required capital in several risk modules or sub-modules. Underwriting risk concentrations are recognized in the nonlife catastrophe risk and life catastrophe risk sub-modules. Additional risks to an insurer stemming either from lack of diversification in the asset portfolio or from large exposure to default risk by a single issuer of securities or a group of related issuers are recognized in the market risk concentrations sub-module. The counterparty default-risk module takes account of the overall counterparty risk exposure of the insurer to that counterparty, irrespective of the legal form of its contractual obligations to the insurer.
94. All types of risk-mitigation contracts are recognized under Solvency II. They include reinsurance, securitizations, and derivatives. The counterparty default risk module takes account of the related risk that arises from such contracts.
C. Scope for Consolidation
95. Basel III is applied to either the solo entity or the consolidated group up to the holding company. The scope of application has not changed from Basel II and includes: (i) any holding company on a fully consolidated basis within a banking, or a predominantly banking, group; (ii) all internationally-active banks at every tier within a banking group, also on a fully-consolidated basis. For bank conglomerates (i.e., groups with prevalently a banking activity but also containing other financial entities), the holding company bears the full entrepreneurial risk of the subsidiary, which is recognized at the group level and supervisors assess the appropriateness of recognizing the participation. In general, when not consolidated, full deduction is required.Footnote 42 Finally, the same methodology to calculate capital requirements is applied to either the solo or group level.
96. Group-level calculations of required capital under Solvency II focus on the group SCR. Although an approximation of “group MCR” is calculated by summing up the MCRs of the separate legal entities; the purpose of this calculation is just to establish a floor for the group SCR. Solvency II describes two basic methods for calculating the group SCR. Method 1, which is the default, is accounting consolidation. The standard formula for calculating the SCR is applied to the consolidated assets and liabilities of the group. Method 2, which is an alternative, is deduction and aggregation. The solo SCR and solo capital for the insurers in the group are combined, using a proportional basis for insurers that are not wholly owned. Where the exclusive application of Method 1 would not be appropriate, groups can apply a combination of Methods 1 and 2. Internal models can also be used to calculate group SCR. Diversification of risks across entities within a group is reflected in the calculations, except under Method 2.
97. Generally, Solvency II rules must be applied when making calculations in respect of insurers that are based outside the EEA. However, if the solvency regime of a non-EEA jurisdiction is assessed as equivalent to Solvency II, then the solo SCR and solo capital of insurers based in such jurisdictions, determined under local rules, can be used in the group calculations when method 2 is used.
98. Where members of a group are other types of regulated financial institutions, the relevant sectoral requirements are applied under either Method 1 or Method 2.
D. Supervisory Responses to Breaches of the Capital Requirements
99. An important role of capital requirements is to serve as a trigger for supervisory action.Footnote 43 The imposition of minimum required capital and other control measures by the international standard setters and national authorities raises the need for supervisors to adopt structured systems for responding to breaches of such requirements.
100. In the banking sector, such systems take various names. They include Prompt Corrective Action (PCA, used in the United States) and Structured Early Intervention and Resolution (SEIR, used in some Asian and European countries). In general, these systems seek recovery or orderly resolution of institutions and to minimize deposit insurance losses in respect of those that do fail. For example, the PCA classifies banks under five categories and identifies appropriate supervisory responses for each. The five categories are: well capitalized, adequately capitalized, undercapitalized, significantly undercapitalized, and critically undercapitalized. The last category includes those banks with tangible equity capital below 2 percent of total assets. Under PCA, supervisory actions can be summarized as follows:
• Undercapitalized banks must have permission from the supervisory authority in order to pay dividends or make stock repurchases.
• Undercapitalized banks must submit a capital restoration plan, which must be approved by the bank's supervisor.
• Significantly undercapitalized banks must limit bonuses and salary increases to the management.
• Critically undercapitalized banks must be placed in receivership within 90 days if no other option is available.
• Supervisors can also take additional actions to help prevent further losses, such as changing management.
101. Basel III and the European Capital Requirements Directive (CRD) both emphasize the need for timely supervisory intervention when banks fail to meet capital requirements. Both require a review and examination of banks’ risk profiles and management systems and demand prompt application of prudential measures. However, supervisory intervention is not detailed as under the PCA of the United States. Also, supervisory powers and compliance differ from country to country. For instance, limited information and limited legal powers to intervene may hinder supervisors in some countries.
102. Under Solvency II, breaches or expected breaches of the capital requirements must be notified to supervisors. An insurer must notify its supervisor as soon as it observes that the SCR has been breached. Within the next two months, the insurer must submit a plan for achieving compliance within a period of six months. The period for achieving compliance can be extended by three months—or longer in the event of a significant fall in the financial markets. Similarly, an insurer must notify its supervisor as soon as it observes that the MCR has been breached or where a breach is likely within the next three months. In this case, however, the timeline for remediation is shorter. The insurer has one month to submit a plan and three months in which to achieve compliance, either by obtaining additional capital or reducing its risk profile. During the period of noncompliance, the insurer may be restricted in or prohibited from disposing of assets.
103. Finally, insurers are required to disclose breaches of the capital requirements. Information on SCR coverage is required to be publicly disclosed by insurers and that they announce publicly if their SCR coverage falls below 100 percent, along with the reasons why this happened and any remedial actions taken. Furthermore, for capital instruments to qualify as Tier 2 or better under Solvency II, they must permit deferral of payments if SCR coverage falls below 100 percent. It is therefore likely that insurers will seek to maintain sufficient capital to minimize the risk of breaching the SCR.
E. Implications
104. It is very difficult to compare capital requirements under the two accords. The methodologies and risk categories differ, so comparisons made at the level of a transaction or business portfolio might not be valid in the context of the entity as a whole. For example, the requirements under Solvency II reflect correlations among the main risk areas while the requirements under Basel III treat each main risk area separately. As another example, a bank and an insurer might each hold the same type of loan asset in support of their respective liabilities. Therefore, the capital required in respect of the credit risk associated with that asset can be compared. If the bank is holding the loan in its banking book, no additional capital is required in respect of the related deposit liability. However, an insurer would also be required to hold capital in respect of the insurance risk on the related policies.
105. It is very likely that some similar risks have different capital charges under the two accords. The different natures of the basic approaches to calculate capital requirements, the differences in credit-mitigation techniques (aggregation and dependencies), as well as the inherently ad hoc nature with which capital standards have been negotiated, are likelyFootnote 44 to result in different capital requirements for similar risks.
106. Finally, the promotion of internal models under Solvency II requires careful considerations. Similarly to Basel II, the promotion of internal models under Solvency II aims at strengthening risk-management capacity among insurers. However, with Basel II, the IRB approach was calibrated to produce on average lower risk charges than those provided for by the standard approach. International experience has shown that the ratio of RWA over total assets has, on average, decreased for a large set of European banks (Yogarajah, Reference Yogarajah2011). In other words, either banks have progressively found innovative ways to inflate their capital adequacy ratios or supervisors have progressively relaxed, maybe unintentionally, validation standards. The experience with internal models under Basel II should provide important lessons for insurance supervisors and promote close collaboration in this area between regulators in both sectors.Footnote 45
VI. Unintended Consequences of the Two Accords
107. The joint implementation of the two accords could lead to unintended consequences. The largely independent development processes of the two accords and differences in their content could lead to unintended consequences. In this section, we focus on (i) cost of capital; (ii) funding patterns and interconnectedness; (iii) product and/or risk migration; and (iv) other potential sources of arbitrage.Footnote 46
A. Cost of Capital
108. It is unclear whether, and if so, to what extent the cost of capital for banks is going to increase compared to the cost of capital for insurers.Footnote 47 The natural framework to conceptually assess the impact of the new accords on total cost of capital is the Modigliani-Miller theorem. However, not in terms of its overall validity but in terms of the market imperfections which invalidate it, especially in the short run. These are debt interest deductibility, moral hazard, asymmetric information, safety nets, bankruptcy costs, and debt overhang (Jaffee and Walden, Reference Jaffee and Walden2010). Since these imperfections are not necessarily equally important for banks as they are for insurers (as explained later), Basel III and Solvency II will have a different impact on the relative costs of capital. In addition, there are accord- and sector- specific arguments (many reviewed in the previous sections) for why the total cost of capital could increase more for one set of intermediaries than for the other more than what is required by their different risk profiles.
109. A first set of arguments in support of higher costs for banks relates to the Modigliani-Miller theorem. For instance, banks benefit more from debt interest deductibility to reduce their total cost of capital simply because they are more leveraged. Hence, the debt-equity swap (i.e., deleveraging of banks) that Basel III tries to achieve, will raise the marginal cost of capital for banks more than for insurers. Regarding moral hazard, the same difference in leverage suggests that a debt-equity swap will increase the total cost of capital for banks more than for insurers as there is now less debt that can be used as a monitoring device for bank managers.Footnote 48 Along the same lines, a reduction of the too-big-to-fail (TBTF) funding benefit enjoyed on average more by banks than by insurers could lead to higher average cost of capital for banks. Regarding information asymmetries, Solvency II and Basel III are different information events. The former possibly signals insufficient capital levels (in addition to quality) in relation to the recent shocks, while the latter signals only inadequate quality (rather than levels, and not necessarily in relation to recent shocks). Hence, higher total capital costs could result for banks than for insurers.Footnote 49 Finally, regarding safety nets, these are often subsidized guarantees, the value of which depends on the likelihood of bankruptcies. To the extent that Basel III reduces the relative likelihood of bankruptcy for banks (i.e., more than what Solvency II does for insurers)Footnote 50 the relative benefit from these subsidized guarantees is also reduced more for banks.Footnote 51
110. A second set of arguments in support of higher costs for banks relates to specific differences in the two accords or sectors.
• For instance, the larger scope for risk-mitigation techniques allowed for under Solvency II (including the use of reinsurance) could result (other things being equal) in a lower cost of capital for insurers than for banks.
• Similarly, the retrospective valuation methodology of banks could decrease (increase) the cost of capital for banks in the high (low) part of the cycle relative to insurers, which use a more prospective (and potentially volatile) methodology.
• In addition, capital deductions appear more stringent under Basel III than Solvency II. A case in point are intangible assets (other than goodwill), which are deducted under Basel III, but not under Solvency II. In particular, investments in software, which are meant to comply with regulations and gain efficiency.
• Also, banks’ capital costs for hedging since insurance companies will be encouraged to take long-dated swaps contract to hedge their risks under Solvency II, but Basel III will require banks to hold more capital (and collateral) against these positions. This suggests that hedging will become more expensive for banks and they will be less willing to hold long-term interest rate swaps that insurance companies find so useful.
• The more restricted geographical application of Solvency II could result in serious leakage problems, with insurers “lowering” their capital charges by using reinsurers in jurisdictions with solvency standards deemed equivalent by the EC but that de facto are non-equivalent (more lenient).Footnote 52
• And again, bank regulators are likely to agree on additional step-up capital surcharges for systemically-important banks, as a function of their size, interconnectedness, and substitutability, which would conceptually be difficult to apply to large insurers. Indeed, given the nature of the insurance business, size is associated with increased risk diversification and a priori not warranting higher capital charges.
• Along similar lines, insurance liabilities are more loss absorbing than banks and this could reduce, other things being equal, insurers’ cost to raise additional capital.
• Solvency II is explicitly promoting the use of internal models, which are expected to provide 30–40 percent capital requirement reductions relative to the standardized model.Footnote 53 This provides the sector with ample scope to reduce cost of capital relative to banks in a period when regulators are instead discovering that bank RWA have been progressively eroded relative to total assets (Yogarajah, Reference Yogarajah2011).
• Finally, there is great uncertainty on the impact of capital levels for insurers stemming from the yet-to-be-defined treatment of the illiquidity premium in valuing liabilities.Footnote 54
111. On the other hand, there are arguments in support of a higher cost of capital for insurers.
• In general, the move to a more risk-based approach is likely to increase the cost of capital for the riskier insurers, as investors use the additional information to seek out higher quality insurers.
• Regarding information asymmetries, the adoption of Solvency II (relative to Solvency I) could be perceived by the markets as a more fundamental change than the adoption of the Basel III proposals (which are merely incremental, relative to the Basel II accord).Footnote 55
• In addition, if insurers also try to achieve higher capital levels by reducing liabilities,Footnote 56 they are likely to do so at higher costs than for banks. Indeed, and contrary to banks, there are no markets for many insurance liabilities (think of the difficulty of hedging longevity risk, for instance) making the Modigliani-Miller theorem less applicable to insurers than to banks.
• Along the same lines, deleveraging of banks as a consequence of Basel III would reduce bankruptcy costs more than for insurers and, therefore, reduce their cost of capital.
• Regarding debt overhang, deleveraging will reduce the amount of investment returns that accrue to debt holders and, therefore, reduce the total cost of capital (as the sum of the remuneration of debt and equity holders).
• Finally, contingent capital and other bail-in instruments proposed under Basel III may not succeed in eliminating the TBTF advantage enjoyed by banks. In this case, they would translate in an additional cheap source of capital for banks but not for insurers, for which discussions about such instruments are less advanced.
112. But, in general, we have seen how Pillar 1 requirements across the two sectors are too different to argue conclusively in either direction. In particular, the two accords may have the impact of increasing the incentive to issue equity by insurers and banks at similar times. The joint implementation of the two accords may thus result in higher cost of new equity for both sectors relative to a staggered implementation. It is therefore possible that the joint implementation of the two accords will generate relatively stronger incentives for risk to migrate away from the two sectorsFootnote 57 than from one sector to the other. The key policy question then becomes which part of the financial system (a priori less supervised and regulated) is likely to attract such risk.
B. Funding Patterns and Interconnectedness
113. Basel III and Solvency II could have unintended consequences on funding patterns of banks. There is concern among policy makers and market participants alike that the two accords could jointly reduce the demand for banks’ long-term instruments when banks most need to issue them.
114. On the one hand, the demand for debt instruments is likely to change under Solvency II. In general, insurers using the standardized approach for the SCR will be charged capital requirements through the credit spread risk module proportional to the rating and duration of instruments held on balance sheet.Footnote 58 This automatically makes longer-dated and or lower-rated private sector instruments (relatively) less attractive. In addition, EEA sovereign bonds, bonds guaranteed by EEA states and supra-national agency and development bank bonds—as it stands now—carry a zero risk weight in the standardized approach, irrespective of rating. Also, distortions exist between banks and real sector corporate, since bank-covered bonds receive preferential treatment with lower charges.Footnote 59, Footnote 60 Finally, the increased issuance of covered bonds could have a negative impact on banks’ ability to issue unsecured debt. This is because, with covered bonds, the amount of unencumbered quality assets available in case of bank resolution for unsecured creditors decreases. In summary, the duration multiplier penalizes long-term maturities in general, potentially increasing the likelihood that insurance companies be mismatched and bear reinvestment risk, and result in a preference for sovereign debt and short-dated and higher-rated bank debt (especially covered bonds), relative to other corporates, and could reduce the ability of banks to issue unsecured debt.
115. On the other hand, Basel III will affect the banks’ demand for and supply of certain types of debt. Under Basel III, banks’ senior unsecured bonds do not qualify for the LCR while they qualify for the NSFR.Footnote 61 Covered bonds and sovereign debt qualify for both the LCR and NSFR.Footnote 62 Hence, it is likely that banks’ demand for unsecured debt will decrease while the demand for covered bonds and sovereign debt will increase. For similar reasons, it is likely that banks’ supply of covered bonds will generally increase while the supply of unsecured debt will increase only at longer maturities to meet the NSFR requirements. In other words, Basel III liquidity provisions could promote a partial swap on banks’ balance sheets between senior unsecured and covered bonds for funding purposes, as well as an increase in issuance of senior debt toward longer maturities (5 to 10 years).
116. However, there are also arguments that could make unintended consequences on funding patterns less of a concern.
• For instance, it is unclear if and to what extent the demand from insurers for long-term maturity instruments will actually decrease. The tradeoff between maturity mismatches, capital charges, and the impact of the duration multiplier will likely be different across entities with different structures of liabilities.
• In addition, the preferential treatment of banks’ covered bonds under the standardized approach of Solvency II suggests that rather than a decrease in demand for banks’ funding instruments we might instead see only a change in the funding patterns of banks (less senior debt and more covered bonds).
• Also, the “long term” for banks is different from the “long term” for insurers. A decrease in the demand of insurers for long-term instruments (if this takes place at all) is likely to occur in very long-term maturitiesFootnote 63 that banks do not have incentives to issue (20 plus years versus the 5–10 year range needed for banks to satisfy the LCR and NSFR requirements).
• In any case, any decrease in the demand from insurers for banks’ funding instruments is only likely if the demand for insurance products supported by such assets decreases.Footnote 64 Again, the insurance business is liability driven and the demand for assets depends on the liability structure of the balance sheet. In the end, whether Solvency II really represents a funding risk for banks is an empirical issue: it will depend on the elasticities of demand and supply across various insurance business lines, as an increased cost of capital will be passed through to margins where the demand is least-sensitive to prices.Footnote 65
• Finally, senior unsecured and covered bonds are not placed mainly with insurers. The largest purchaser of senior unsecured bank bonds is the real money funds sector while the largest purchaser of bank-covered bonds is the same banking sector. Insurers represent only 10 percent of total demand for the two instruments (Figure 3).Footnote 66
Figure 3Banks’ Debt Funding Sources by Type of Investor Source: Adapted from Bhimalingam and Burns (Reference Bhimalingam and Burns2011).

117. More of a concern could be the increased interconnectedness between banks and insurers. Solvency II and Basel III could indeed result in increased demand for sovereign debt by both sectors. In other words, exposure to sovereign risk could increase and the type of interconnectedness between the two sectors could change and could be strengthened through the balance sheet of the sovereign. In principle, this concern could be diffused by the use of insurance internal models (which would capture the heterogeneity in credit risk across EU sovereigns), but their standards are yet to be defined.Footnote 67 Clearly, strong collaboration between the regulators of the two sectors would be required to minimize risks of arbitrage between the use of internal models so that for both banks and insurers appropriate risk weighted capital is held and that the risk is properly recognized and accounted for.
C. Risk/Product Transfers
118. Risk/product transfer across the two sectors could take place in business lines in which banks and insurers compete directly. For instance, in some jurisdictions, the treatment of certain life insurers’ savings products, like term certain annuities, attracts higher capital requirements than (say) term deposit.Footnote 68 The new liquidity requirements proposed under Basel III should decrease the extent of regulatory arbitrage in the commercialization of these similar products. In other jurisdictions, equity investment attracts higher capital requirements for banks than for nonlife insurers, and the strengthening of capital treatment of market risk under Basel III could further increase incentives for conglomerates to carry equity investments in a nonlife insurer subsidiary versus a bank subsidiary. Potential for risk transfer exists in products providing credit default protection, such as CDSs, which can be issued by both banks and insurers, between mortgage lenders and mortgage insurance, and in trade finance.Footnote 69 However, establishing clear patterns is difficult, as these will depend on the treatment of specific risk exposures in the internal models under Solvency II. Close collaboration between the regulators of banks and insurers will be required in the definition of such standards so as to minimize the opportunity of model arbitrage and, consequently, the likelihood that risk migrates inappropriatelyFootnote 70 between the two sectors.
119. Risk could also be passed onto customers through risk sharing products in a non-socially optimal manner. Increased cost of funding and capital could result in different product mixes offered by banks and insurers. For example, unit-linked life insurers offer products where most or all of the market risk is borne by the policyholder, many pension annuity products now provide for periodical re-pricing as a function of mortality experience as a way to share longevity risk between the provider and the annuitant, and other risk pass through mechanisms are in principle feasible in other insurance and banking fields. There is already a strong debate whether consumers are exposed to excessive risk in pension products. Basel III and Solvency II may exacerbate the problem in Europe as many pension products are offered by insurers and because of the possibility (being discussed) to extend the Solvency II framework to pension funds.Footnote 71
120. Risk could finally migrate away from both sectors through the use of securitization, reinsurance and shadow banking. The joint implementation of Basel III and Solvency II could lead to increased use of securitization by banks and insurers alike.Footnote 72
When the NSFR requirements become binding, securitization has the benefit of removing long-term assets (like mortgages) from the bank's balance sheet and thus relieving banks from any related Basel III requirement.Footnote 73 For insurers, an option for offsetting the cost of capital under Solvency II, is to use reinsurance and ILS. As witnessed under Basel II, the tendency to move exposure off balance sheets because it reduced regulatory requirements ultimately led to utilization of the origination and transfer business model, widespread use of conduits and overconcentration of exposures in less regulated areas of the financial system. An increased use of these risk-transfer mechanisms could result in more interconnected financial systems with opaque distribution of risks, possibly migrating toward less-regulated and supervised areas of the financial system. Hence, it is safe to say that the two new accords: (i) increase the need for regulators/supervisors to improve transparency and strengthen the oversight of these contagion channels; and (ii) call for a careful definition of equivalent jurisdictions under Solvency II.
D. Other Potential Sources of Distortion
121. For instance, tax considerations are likely to be a more important source of arbitrage than current regulatory reforms. Heterogeneous tax treatment of capital items and similar products/instruments might well dwarf the aforementioned Pillar 1 considerations. In other words, tax-minimization strategies are likely to dominate cost of capital minimization strategies for both banks and insurers. For instance, current regulatory reforms do nothing to reduce the tax incentive to fund financial institutions through debt and therefore, to discourage leverage. Interest deductibility is perhaps the most important tax-related distortion, which promotes the design of opaque financial products that add little economic value but creates leverage and complexity, increasing vulnerabilities in the financial system and making them more difficult to monitor.
122. Heterogeneity in supervisory approaches could also be a source, albeit less important, of arbitrage. The insurance market has traditionally (with due exceptions) been less intrusively supervised than the banking sector. Similarly, due to the only partial transferability of insurance products, market discipline is likely to be less effective in this sector than in the banking sector. In other words, Pillar 2 (supervisory approach) and Pillar 3 (market discipline) requirements should be considered when assessing potential unintended consequences of the joint implementation of the new banking and insurance capital accords. However, we do not think that heterogeneity in supervisory approaches and market discipline would represent a more important source of arbitrage than the regulatory capital requirements discussed in this paper, at least in Europe.
123. Finally, the two accords have not been finalized. There are still too many moving parts, so potential sources of arbitrage can only be more clearly identified once the details of the two accords have been finalized.
VII. Conclusions
124. The nature of capital needed by banks and insurers is naturally different. Banks and insurers have different business models. Banks are asset driven, leveraged, with a large range of activities only partially overlapping with those of insurers. They have liabilities providing little (if any) loss absorption and, therefore, are exposed to different risks, especially liquidity risk. Insurers are liability driven, much less leveraged than banks, funded mainly through policyholder premiums, with liabilities providing more loss absorption and, therefore, less exposed to liquidity risk than banks. Also, banks’ asset and liability valuation and accounting are in part retrospective while both will be more prospective for insurers under Solvency II, suggesting greater stability in the reported values for banks than for insurers. Finally, entities in the two sectors have different ways to change the risk profile of their balance sheets, with reinsurance not being directly available to banks. Given these fundamental differences, we expect that the composition, level, and quality of capital will be different across the two sectors.
125. Basel III and Solvency II both attempt to increase the quality of capital in their respective sectors, but often have different provisions for similar issues. Their objectives only partially overlap: Basel III attempts to strengthen the quantity and quality of capital in an incremental fashion after the recent crisis while Solvency II attempts to strengthen policyholders’ protection by tailoring the quantity and quality of regulatory capital required more closely to the risks of each insurer, without necessarily increasing the quantity within the sector as a whole.Footnote 74 Indeed, Solvency II represents a complete overhaul of the Solvency I framework by adopting a market consistent approach to create a realistic balance sheet from which capital requirements are derived. In addition, both accords have had a largely independent development process subject to inevitable piecemeal negotiations with different stakeholders. Indeed, while some of the Pillar 1 differences discussed in this paper can be attributed to the different natures of the capital in the two sectors, many cannot be explained.
126. Provisions that cannot be related to the intrinsic differences between the two sectors can result in unintended consequences. For instance, it is unclear whether and, if so, to what extent the cost of capital for banks is going to increase compared to the cost of capital for insurers. On the one hand (i) the lack of an explicit objective to increase capital levels under Solvency II; (ii) the more restricted geographical application of Solvency II; (iii) the less persuasive need for capital systemic risk surcharges for insurers; and (iv) the yet to be defined standards for internal models for insurers suggest that cost of capital may increase more for banks than for insurers. On the other hand, arguments in support of higher cost of capital for insurers can also be made. But in general, Pillar 1 requirements across the two sectors are too different to argue conclusively in either direction. In addition, the new liquidity standards for banks and the new credit risk charges for insurers could affect the funding patterns of banks and increase the interconnectedness of the two sectors through the sovereign balance sheet. Finally, the two accords may result in an increased use of securitization for funding purposes by both banks and insurers. Hence, these unintended consequences could translate into risk migration between or away from the two sectors.
127. Several policy considerations stem from the aforementioned analysis:
• Basel III and Solvency II suggest a need for insurance regulators to communicate with their banking counterparts to understand the combined implications of the behavioral incentives that the two regimes may provide. This could significantly reduce the risk of unintended consequences associated with seemingly inconsistent treatment of same risks under the respective accords. This would also avoid unintentional arbitrage between internal models and the standardized approach under Solvency II, as has happened under Basel II.
• In addition, while group supervision has been strengthened, concerns about leakages still remain. This is especially a concern under Solvency II, due to its restricted geographical application and the potential use of non-equivalent jurisdictions for reinsurance. A key challenge for all groups remains what will be the approach by the EC to equivalence.
• Also, the adequacy of safety nets may need to be reviewed in the future. The likely increased use of covered bonds by banks for funding purposes would ring-fence assets so that they are unavailable to depositors and unsecured creditors in case of resolution.
• Basel III and Solvency II could further increase the need to expand the perimeter of regulation. As both Basel III and Solvency II push banks and insurers toward shorter duration and less risky business, non-regulated entities and market-based risk transfer mechanisms might evolve to fill any gap in market capacity that emerges. In addition, the likely increased use of securitization by banks and insures alike requires a strengthening in transparency and oversight of these contagion channels including securities lending-related cash collateral reinvestment programs, implementing macro-prudential measures (such as counter-cyclical margin requirements) related to
• securitization, repos and securities lending where appropriate, and improving market infrastructure for secured funding markets.
• Basel III and Solvency II may lead to excessive risk transfer to consumers and therefore, may require strengthening consumer protection. To the extent that the new accords increase capital and funding costs, the product mix offered by banks and insurers may change and entail additional risks for consumers. For example, excessive risk transfers could be a concern in the area of pension benefits where consumers already bear significant investment and longevity risk. Additional risk transfers to consumers may not be socially desirable from the pension policy point of view.
• Finally, there appears to be a need for empirical investigation about the magnitude of the impact of unintended consequences. There is no universally agreed set of unintended consequences and this paper is the first attempt (that we know of) to generate a set and relate it to the specifics of the Basel III and Solvency II accords. In addition, there is a general absence of empirical studies on the extent of the impact of possible unintended consequences.
Appendix I. An Overview of the Basel III and Solvency II Accords
1. The Basel III and Solvency II accords are coming into effect within the next few years. Basel III, evolving from Basel II, requires more equity capital and additional long-term funding. On the other hand, Solvency II establishes a new risk-based capital framework, replacing Solvency I, where required capital was only a simple proportion of liabilities or premiums. The following sections give briefings on some significant features of the two accords and the major shifts that they will introduce.
Basel III
2. A number of enhancements have been proposed to strengthen the Basel accord. New capital, leverage, and liquidity requirements have been proposed by the BCBS to strengthen the regulation, supervision, and risk management of the banking sector. Basel III, the modified accord, strengthens the three pillars of Basel II, particularly Pillar 1 with enhanced minimum capital and liquidity requirements (Figure 4).
Overall Modifications of the Basel II Accord Source: Bhimalingam & Burns (Reference Bhimalingam and Burns2011).
3. The modified capital standards and the new capital buffers will require banks to hold more capital and higher quality of capital. Moreover, the new leverage and liquidity ratios propose a non risk-based measure to supplement the risk-based minimum capital requirements to ensure that adequate funding is maintained during stress periods. Additionally, the capital required in respect of counterparty credit risk and market risk in the trading book portfolio has been strengthened, including new capital requirements for Credit Value Adjustment (CVA), Wrong Way Risk (WWR), Stress Value at Risk, and Incremental Risk (IR)Footnote 75 (Figure 5).
Basel III Framework
4. The main focus of the Basel accord modifications is to improve the loss-absorption capacity of banking institutions through stronger capital. Funding and liquidity requirements are intended to further enhance the short- and long-term stability of the financial system.
Basel III new capital regulations
5. To enhance the capital quality of banks, the modified rules require that common equity form a larger core component of bank's capital. The minimum ratio of common equity to risk-weighted assets will go up to 4.5 percent in 2015 from the currently requirement of 2 percent (Figure 6). The qualifying elements within Tier 1 capital are the common shares, minority interests, and retained earnings and, from January 2013, other instruments not meeting the criteria for inclusion in common equity will be excluded and will be phased out over a 10-year horizon.
Basel III Capital Requirements (percentage of RWA) Source: BCBS (2010) and Bhimalingam & Burns (Reference Bhimalingam and Burns2011).
6. Two types of capital buffers will be required under Basel III: the Capital Conservation Buffer and the Countercyclical Capital Buffer. Both will be added on top of common equity requirements. Capital Conservation Buffer will be phased in, starting at 0.6 percent of RWAs in 2016 and reaching 2.5 percent of RWAs in 2019. It will need to be met entirely with common equity. The purpose of this additional capital is to avoid breaching the minimum capital requirements, particularly in periods of stress. Local supervisors will decide whether and, if so, for how long local institutions can operate within the buffer range. Similarly, the countercyclical capital buffer will be added on top of the common equity requirements. However, it can be met with both common equity and other fully-absorbing capital (Figure 6). It could be as low as zero, but it could reach up to 2.5 percent of RWAs in periods of excessive growth. Together with the capital conservation buffer, the required amount of fully-absorbing capital could reach up to 9.5 percent of RWAs.
7. Additional Tier 1 capital of 1.5 percent of RWAs and Tier 2 capital of 2 percent of RWAs are required under Basel III, which increase the total capital requirements to 10.5 percent by 2019. Both of these requirements can be met using either common equity or financial instruments with loss-absorption features and without any incentive to redeem. However, under Basel III minimum requirements, capital instruments that do not meet the requirements for inclusion in Tier 1 common equity capital will be excluded as from January 1, 2013, unless certain conditions are met, in which case they are proposed to be phased out over the following 10 years. Only instruments issued before 12 September 2010 would qualify for the proposed transition arrangements. Other existing public sector capital injections would be grandfathered until January 1, 2018.Footnote 76
Leverage ratio
8. Under Basel III, a leverage ratio will be reported to supervisors starting in 2013, with disclosure after 2015 and with an objective of making it part of Pillar 1 capital requirements in 2018. It is calculated as the ratio of Tier 1 capital to the total unweighted assets, including some off-balance sheet assets. Banks would be required to maintain a leverage ratio of 3 percent or more. The unweighted assets include provisions, loans, off-balance sheet items with full conversion, and all derivatives. The main purpose of this ratio is to constrain leverage in the banking sector, while also helping to safeguard against model risk and measurement errors.
Liquidity requirements
9. In order to reduce liquidity risk, Basel III rules introduce two new measures, which are the Liquidity Coverage Ratio (LCR) and the Net Stable Funding Ratio (NSFR). They are defined and calculated as follows:
• LCR is designed to measure whether a bank has sufficient high-quality liquid resources to survive an acute stress scenario lasting for one month (30 days); i.e.,
LCR = High quality liquidity assets/Net cash outflow over 30 days;
• This ratio has to be greater than 100 percent, subject to a further requirement on the quality of liquid assets. Level 1 assets are included without limits and are held at market value, with no haircuts unless required by the home supervisor. Lower-quality Level 2 assets can only be up to 40 percent of the required asset pool; they have a minimum haircut of 15 percent of market value and they should be diversified.
• NSFR has a time horizon of one year and helps to determine whether the maturity structure of assets and liabilities is sustainable. This ratio can be calculated as follows:
NSFR = Available Stable Funding/Required Stable Funding;
This ratio also has to be greater than 100 percent.
10. Basel III also provides four additional ratios for monitoring liquidity, which are: LCR by Significant Currency, Contractual Maturity Mismatch, Concentration of Funding, and Available Unencumbered Assets.
Solvency II
11. The Solvency II accord calculates required capital using a total balance sheet approach, taking into account the actual risk on the balance sheet and any offsetting effects (Figure 7).Footnote 77 It is scheduled to be implemented in January 2013 and applies to all except the very smallest insurers and reinsurers in Europe as well as the non-European ones operating in that region. Like Basel III, Solvency II includes three pillars. Pillar 1 specifies quantitative requirements related to technical provisions and capital, including both going-concern Solvency Capital Requirements (SCR) and gone-concern Minimum Capital Requirements (MCR). Pillar 2 contains provisions regarding governance and risk management. Pillar 3 contains guidelines on supervisory reporting and transparency requirements.
Overall Modifications of the Solvency I Accord Source: Bhimalingam & Burns (Reference Bhimalingam and Burns2011).
12. Two control levels of capital are established, which are represented by the SCR and MCR ratios. The SCR aims to cover against 1 in 200 years event while the MCR is the absolute minimum required capital, which is estimated as a smaller proportion of the SCR. Breaching of the MCR level of capital requirements leads to immediate supervisory action, which can trigger the withdrawal of supervisory authorization. The key component of the SCR is the Basic SCR, which is computed before any adjustments and combines capital charges for five types of major risks. On the other hand, the calculation of the MCR is based on a linear approach, with the result being restricted to a range of between 25 percent and 45 percent of the SCR, but not less than an absolute monetary floor. For supervisory purposes, the difference between the SCR and the MCR can be considered as an intervention window to reduce the risk that the MCR will be breached. Box 2 illustrates how both SCR and MCR ratios are estimated.
Solvency II SCR & MCR Estimation
Appendix II. Capital Required for Various Risks under Basel III and Solvency II
1. The risk areas considered under Pillar 1 of the two accords differ from one another. Basel III deals with credit risk, market risk, and operational risk. Solvency II deals with nonlife underwriting risk, life underwriting risk, health underwriting risk, market risk, counterparty default risk, and operational risk.Footnote 79
2. Under Pillar 1 of the Basel III accord, three major classes of risks are considered: credit risk, market risk, and operational risk. Credit risk originates mainly in the banking book, with the exception of credit counterparty risk through Securities Financing Transactions (SFT) and OTC derivatives, which originates in the trading book and was a specific object of the Basel III revisions. Market risk (interest, equity, FX, and commodities risk) originates mainly in the trading book.Footnote 80 Operational risk is the risk of losses resulting from inadequate or failed internal processes, people and systems.
3. Pillar 1 of Solvency II considers these same classes of risk, as well as underwriting risk, which is unique to the insurance sector. Underwriting risk is the risk of loss associated with both the perils covered by insurance policies and the processes followed in the conduct of the insurance business, such as risk selection and claims settlement.
4. This appendix focuses on the treatment of credit and market risks for capital requirement purposes under the standardized approaches of the Basel III and Solvency II accords. However, it does not discuss operational or underwriting risks, or the internal models approaches to credit and market risks.
Credit Risk
5. Basel III did not materially change the Basel II provisions for treatment of credit risk in the banking book. The only discussion taking place relates to the intention of decreasing the dependency of capital charges on external ratings under the various approaches and to reduce the procyclicality of capital charges stemming from the mechanics of internal models used under the internal ratings-based approach.Footnote 81 Regarding both issues, no concrete amendments to the solvency accord had been formulated at the time of writing.
6. Minimum credit risk weights under the standardized approach are reported in Table A1. Claims on sovereigns and their central banks are risk weighted between zero percent and 100 percent, depending on their ratings. Claims on noncentral government public sector entities (PSE) receive the same risk weights as banks, without preferential treatment of short term claims, but supervisors have the discretion to assign same rating as sovereigns when these entities have revenue raising powers. Claims on multilateral development banks (MDB) are risk weighted following option 2 for banks without preferential treatment of short-term claims.Footnote 82
Basel II/III Credit Risk Weights: Standardized Approach
7. Two options are available for determining the requirement in respect of claims on banks and securities firms in a given jurisdiction. Under option 1, banks have no external ratings and claims receive a one-less-favorable rating category than the sovereign of incorporation.Footnote 83 Under option 2, banks receive their own ratings and unrated banks receive 50 percent risk weight. In addition, under this option, the supervisor can treat short-term claimsFootnote 84 preferentially by granting a one-more-favorable rating category. Finally, claims on securities firms receive the same ratings as claims on banks if they fall under comparable regulatory and supervisory arrangements (risk-based capital), otherwise they are treated as claims on corporates.
8. Claims on corporates, including insurers, receive a similar treatment to claims on banks, with the exception of higher risk weights for corporate rated B+ to B−. In addition, supervisory authorities may authorize banks to risk weight all corporate claims at 100 percent without regard to external ratings.
9. Retail loans and residential mortgages are by definition unrated and receive risk weights of 70 percent and 35 percent, respectively. Claims secured by commercial real estate should receive a 100 percent risk weight, but for well-developed and long-established markets, lower risk weights are possible. Finally, the unsecured portion of nonperforming loans (NPLs) with less than 20 percent provisions receives a 150 percent risk weight, reduced to 100 percent when provisions are more than 20 percent, and with discretion to reduce the risk weight to 50 percent when provisions are more than 50 percent of the outstanding amount of the loan.
10. Higher risk claims receive a default weight of 150 percent, while other assets receive a default risk weight of 100 percent. Again, under Pillar II, the supervisory authority may increase such weights.
11. Off balance sheet items are risk weighted through the use of credit conversion factors (CCF). These vary according to the transaction. For instance, repos, reverse repos, long positions in forward markets, and securities lending all receive a CCF of 100 percent. Commitments with an original maturity of more than one year or contingent claims associated with performance bonds, warranties and letters of credit receive a CCF of 50 percent. Finally, commitments with an original maturity of less than one year receive a CCF of 20 percent, or 0 percent the commitment can be canceled unilaterally by the bank.
12. Under Solvency II, credit risk is dealt with in two risk modules. The spread risk sub-module of market risk covers, among other things, the credit risk associated with investments in bonds. The counterparty default risk module covers, among other things, the credit risk associated with derivatives.
13. The capital required under the spread risk sub-module depends on both the rating category of an asset and its duration. The market value of an asset is multiplied by a rating-dependent stress factor, as well as by its duration, which is subject to floors and caps. Accordingly, long duration assets are subject to much higher capital requirements than short duration assets of the same rating category. The stress factors and duration limitations for some key types of assets held by insurers are shown in Table A2.
Solvency II Credit Risk Factors
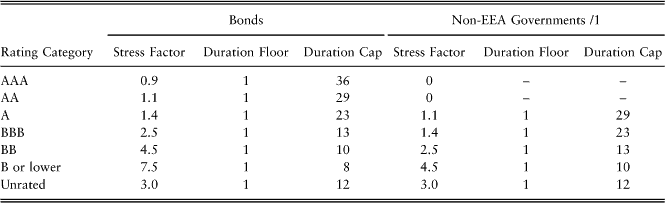
14. Some assets receive special treatment under the spread risk sub-module. There is no capital requirement for borrowings by or demonstrably guaranteed by the national government of an EEA state, issued in the currency of the government, or issued by a specified multilateral development bank or international organization. Mortgage covered bonds and public sector covered bonds are also treated differently. If they meet certain requirements and are rated AAA, they are subject to a stress factor of 0.6 percent and a duration cap of 53 years.
Market Risk
15. Market risk is defined as the risk of losses in on- and off-balance sheet positions arising from changes in market prices. Under Basel III, market risk includes interest rate and equity risk related to instruments in the trading book and foreign exchange and commodity risk throughout the bank. The treatments of various types of market risk under the two accords are contrasted below.
16. Basel III modifies the standardized measurement method for market risk by adding the concept of correlation trading. The correlation trading portfolio incorporates securitization exposure and nth-to-default credit derivatives with certain criteria. A minimum capital charge of 8 percent was introduced for exposures in correlation trading portfolios, while a transition period until end of 2013 was given for capital charges for noncorrelation trading portfolios.
17. Basel III provides alternative approaches to measure the price risk of options, depending on the significance of a bank's trading portfolio. If a bank is engaged in limited options-buying activities, then it is allowed to adopt a simplified approach. On the other hand, if it both writes and purchases options, then it is expected to use intermediate approachesFootnote 85 or internal models.
Interest Rate Risk
18. Basel III does not impose a capital charge for interest rate risk in the banking book. It instead deals with the risks associated with maturity mismatches through the liquidity requirements (LCR) and the net stable funding ratio (NSFR).
19. However, capital is required for interest rate risk in the trading book. Capital risk charges apply to both specific and general market risk. Under the specific risk category, there are four types of rules for determining the capital charge on certain debt or similar instruments, dealing respectively with issuer risk, unrated debt, non-qualifying issuers, and positions hedged by credit derivatives. The capital charges for government and other categories are shown in Table A3.Footnote 86 The qualifying category includes those securities issued by the public sector as well as those rated as investment grade, which are subject to supervisory approval. Also, the qualifying category might include unrated securities if they can be rated equivalent to investment grade and listed in the stock exchange. On the other hand, instruments issued by non-qualifying issuers are weighted as non-investment grade and the supervisory authorities can apply higher charges.
Basel III Market Risk Capital Charges for Specific Risk
20. Basel III did not change the capital charges for general market risk, which is the risk of loss arising from changes in market interest rates. The risk can be measured using either the maturity or duration methods. The capital charge is calculated as the sum of: the net short or long position in the trading book, the small and large proportion of matched positions, and the net charge for positions in options. Interest rate derivatives, off-balance sheet instruments, and swaps in the trading book that react to changes in the interest rate must be accounted for whenever possible.
21. Under Solvency II, capital is required for interest rate risk for all assets and liabilities for which the net asset value is sensitive to changes in the term structure of interest rates or interest rate volatility. Assets sensitive to interest rate movements will include fixed-income investments, policy loans, and interest rate derivatives. Insurance liabilities, which are based on the discounted value of future cash-flows, are sensitive to changes in the rates at which those cash-flows are discounted. The more significant the mismatch between the term structures of assets and liabilities, the higher the capital that will be required for interest rate risk.
22. The capital requirement for interest rate risk is determined using two pre-defined scenarios, involving instantaneous upward or downward shifts in the term structure. The relative changes under the two scenarios are shown in Table A4, for selected maturities. Irrespective of the stress factors, the absolute change of interest rates in the downward scenario should at least be one percentage point, except that the shocked rate cannot be negative. The changes in the net value of assets and liabilities due to re-valuing all interest rate sensitive items using the altered term structures are calculated, with the capital requirement being the greater of the two absolute results.
Solvency II Interest Rate Risk Scenarios
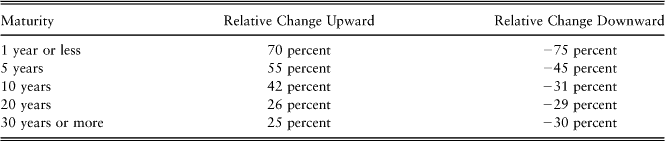
Equity Risk
23. As with interest rate risk, equity risk has also two charges under Basel III, for specific and general market risk.Footnote 87 Basel III modifications no longer allow national authorities to grant lower capital specific risk charges for liquid and well-diversified equity portfolios. For both specific and general market risk the capital charge is now 8 percent.
24. The remainder of the accord on equity risk remains unchanged from Basel II. Banks are still required to include equity derivatives in the measurement system and convert exposures into exposures in the relevant underlying. Matched long and short positions in an identical equity in each market can be fully offset. In relation to equity index exposures, a further capital charge of 2 percent will apply to the net long or short position to cover factors such as execution risk.
25. The capital required for equity risk under Solvency II is determined by applying immediate shocks to the values of equities. The shocks are reductions of 39 percent on global equitiesFootnote 88 and 49 percent on other equities and commodities, except that no shock is applied to participations in financial and credit institutions and a shock of 22 percent is applied to other strategic participations. Correlation of 0.75 between the global and other categories is assumed. Solvency II also intends to incorporate a counter-cyclical symmetric adjustment into the equity shock applied. For example, a 30 percent global equity shock was applied in QIS5 instead of the base 39 percent shock.
Commodities Risk
26. Basel III remains unchanged in respect of commodities risk.Footnote 89 To measure commodities risk and applicable capital charges, banks can adopt (under the standardized approach) either a maturity ladder method or a simplified method. The capital charge for directional risk is equal to 15 percent of the net position, long or short, in each commodity and an additional 3 percent capital charge of the bank's gross positions, for protection against other types of risks.
27. Under Solvency II, commodities risk is treated as equity risk. The capital requirement is based on a 49 percent shock in the value of the commodity position.
Foreign Exchange Risk
28. Capital required for foreign exchange risk remains unchanged under Basel III. Banks are required to calculate their net open positions in different currencies and gold. Then a uniform 8 percent capital charge is applied to the higher of the net long currency position or the net short positions (across currencies and gold). A bank doing negligible business in FX or not taking FX positions with its own funds can be exempted from the capital charges.
29. Under Solvency II, required capital is determined in respect of each of an insurer's individual currency positions. The insurer's investment policy is to be taken into account, which could include hedging arrangements and gearing. For each currency, the contribution to the capital requirement is determined as the maximum of the results of a 25 percent rise or a 25 percent fall in the value of the currency in relation to the local currency. The most significant impact of this requirement is likely to be at the group level, for insurers with equity investments in foreign subsidiaries.