Introduction
The last decade has seen ideas about ‘social investment’ taking a hold in Australian social policy (Deeming and Smyth, Reference Deeming and Smyth2015; Perkins et al., Reference Perkins, Nelms and Smyth2005; Smyth, Reference Smyth2007). As in comparable countries, it has been most evident in policies for ‘human capital’ development – especially early childhood education; welfare to work programmes; and support for ‘working families’ (family tax benefits, child care, paid parental leave) (Morel et al., Reference Morel, Palier and Palme2012). At the same time, the shadow of neoliberalism lingers, notably over the unemployed and sole parents in market liberal societies like Australia (Deeming, Reference Deeming2016). While the ‘social investment perspective’ (Jenson, Reference Jenson2010) focuses on building welfare around work, this poses fresh challenges for ageing societies from a life-course perspective (Kvist, Reference Kvist2015).
With the social investment approach having been typically a paradigm for the young, this article focuses attention on the older worker within the emerging new ‘inclusive growth’ agendas which help to benefit everyone and to which all must contribute (Smyth and Buchanan, Reference Smyth and Buchanan2013a). Here particular consideration is given to the challenges faced by older workers in the knowledge-based economy with the promotion of longer working lives, delaying the transition to retirement (OECD, 2006a, 2015a). Conceptions of ‘active ageing’, participation and inclusion extend well beyond notions of ‘productive value’ and policies that simply encourage more older people to stay in work of course (Deeming, Reference Deeming2009; Biggs, Reference Biggs, Smyth and Buchanan2013); however, it is the labour market situation of older workers that currently challenges investment-oriented social policies, to which we now turn.
The first section of this article examines the social investment perspective, and the challenge posed by ageing populations, before reflecting on the labour market situation of older workers in Australia. In the next section, we consider the issues facing older workers in the labour market, and the problem of weak employability in the older population is discussed. The specific focus of the social investment perspective is of course human capital upgrading, but the situation of older workers in the strongly productivist economy (where policies are primarily geared towards the idea of getting people into paid employment) has largely been neglected by policymakers in the advanced societies (compared to children and young adults, older workers lack a productivity argument according to the influential work of James Heckman, e.g. Heckman and Masterov, Reference Heckman and Masterov2007). However, if the social investment strategy is to succeed in Australia and elsewhere, it will mean broadening the frame to consider the needs of older workers, and we consider what that might mean for the development of social policy in the final section.
The social investment perspective and ageing populations
The concept of a ‘social investment state’ (see Giddens, Reference Giddens1998) that promotes a ‘working society’ has a deep resonance with Australian social policy history, strongly characterised by productivist values and opportunity, founded on the idea of giving each other a ‘Fair Go’ (Smyth and Buchanan, Reference Smyth and Buchanan2013a).
The early origins of the social investment perspective are not well rehearsed in the literature but they are certainly traceable to the productive social policy ideas of the 1930s, found in the writings of Swedish social democrats like Gunnar Myrdal and British socialists like R. H. Tawney, who understood social policy as a necessary investment, not cost, toward a more socially just economic order (Tilton, Reference Tilton, Misgeld, Molin and Amark1993 Motel et al., Reference Morel, Palier, Palme and Hasmath2015; Smyth and Deeming, forthcoming). Since the late 1990s, new ideas and strategies concerning the role of social policy for societal development have been formulated, and, internationally, policy agendas now point towards a similar policy logic based around notions of ‘social investment’ (Morel et al., Reference Morel, Palier and Palme2012). Nevertheless, as Jane Jenson (Reference Jenson, Morel, Palier and Palme2012) remarks, social policy scholars have yet to develop a singular theoretical core informing the social investment state in the way that Keynesianism informed the welfare state and neoclassical economics its successor. Nor could we say that the ‘social investment’ perspective has fully emerged as the dominant paradigm in social policy, as Hemerijck (Reference Hemerijck2013) has argued.
The social investment perspective is said to address the ‘new social risks’ faced by citizens in post-industrial society (Armingeon and Bonoli, Reference Armingeon and Bonoli2006); including, for example, long-term unemployment and youth unemployment, unskilled and precarious employment, as well as the growing problem of in-work poverty, and the struggle to reconcile family life and working life, particularly with the massive increase in women’s employment participation that began in the 1970s. These social risks are ‘new’ because the nature of their problems were in the past less damaging (e.g. being an unskilled worker in the industrial capitalist economy) or their constituent groups used to be more negligible (e.g. female workers). Today, female participation in paid work is critical to sustaining welfare states in ageing societies, and new family-friendly childhood education and care policies are being designed to increase participation in the labour market. Conceptually then, scholars attempt to separate out ‘social investment’ spending on human capital (i.e. looking for ‘returns’, cf. Nolan, Reference Nolan2013) from social spending on ‘old social risks’ related to pensions, healthcare and social security benefits – but hard distinctions can be problematic. Pension and superannuation systems themselves act to deliver investment and economic development for example, while healthcare systems help to create millions of jobs, which also helps to promote economic development, and a workforce that is both fit and well.
Despite some of the conceptual vagueness, however, two core features may be observed: investment in human capital and the objective of full labour market participation. Indeed, the notion that the social investment state seeks to rebuild a new welfare state around work is now generally recognised in the research literature (Morel et al., Reference Jenson, Morel, Palier and Palme2012). However, it is this notion of building welfare around work that poses fresh challenges from a life-course perspective, particularly when the situation of older workers has largely been neglected by policymakers committed to the social investment perspective. Older workers face particular disadvantages in the labour market, and, as we shall see, existing labour market disadvantages are further compounded by the social investment approach, which to date has typically been focused on promoting educational investment in children and young adults (Esping-Andersen et al., Reference Esping-Andersen, Gallie, Hemerijck and Myles2002).
The labour market situation of older workers
In addition to adequate economic incentives and better employer practices, employability and willingness to keep on working are prerequisites to increasing employment rates in the older population.
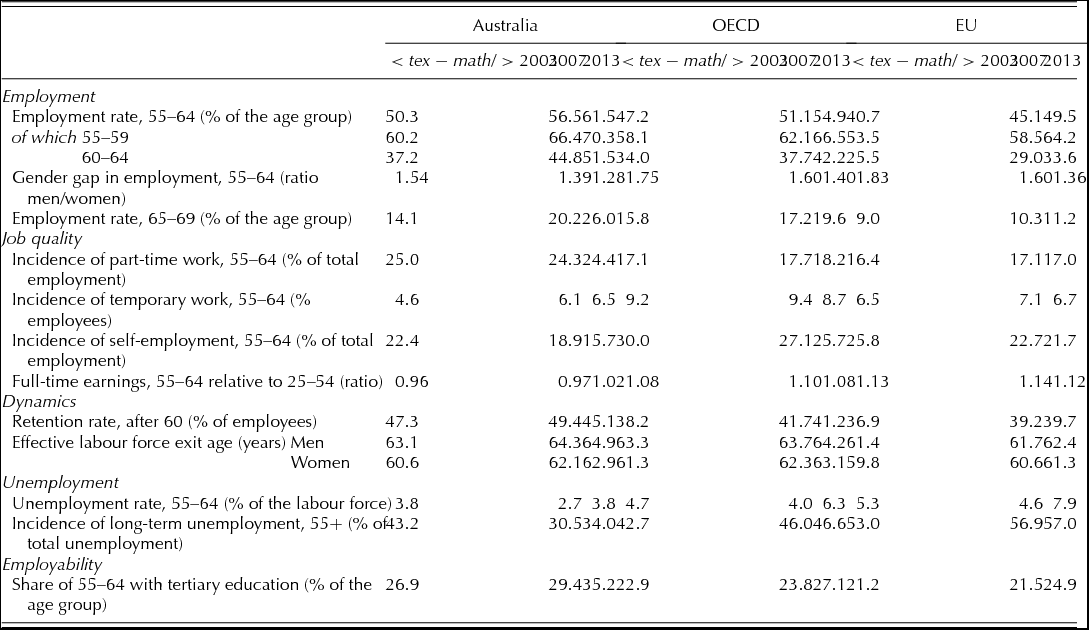
In Australia, labour force participation rates for older Australians are currently low, particularly for people aged sixty-five or over (Table 1).Footnote 1 Although employment rates amongst the older population have increased significantly in recent years, there will be greater socio-demographic pressure for older Australians to remain in the workforce for longer. The overall employment rate in the fifty-five to sixty-four age group has increased rapidly over the last ten-year period, from 50 per cent in 2003 to about 62 per cent in 2013 (Table 1). The employment rate for people in the sixty-five to sixty-nine age group has also increased from 14 per cent in 2003 to about 26 per cent in 2013, but the employment rate remains low with only one out of four Australians in this age group in the labour force. Table 1 shows that employment growth for the older population has been much faster in Australia over the past decade, compared to the OECD and EU average. The gender employment gap amongst older workers aged fifty-five to sixty-four has also decreased significantly in Australia during the last decade, from a ratio of 1.54 (men/women) in 2003 to one of 1.28 in 2013 (Table 1).

The unemployment rate for older workers aged fifty-five to sixty-four in Australia, at 3.8 per cent, is lower than the OECD average of 6.3 per cent for the same age group (Table 1). However, the high incidence of long-term unemployment for those fifty-five and over in Australia, at 34 per cent, presents a challenge for policymakers looking to extend working lives (although Table 1 suggests progress, the level of long-term unemployment amongst those aged fifty-five plus appears to have declined over the past decade, being 43 per cent in 2003, now below OECD and EU averages. In 2013, the share of part-time work in the fifty-five to sixty-four age group was 24 per cent of total employment, higher than the OECD average of 18 per cent. The incidence of temporary work amongst the older population in Australia is below OECD and EU averages, now less than 7 per cent of all employees. Older workers in full-time jobs also earn the same as their younger counterparts in the twenty-five to fifty-four age group, and the country ranks among those with the highest employment retention rate after the age of sixty, above OECD and EU averages (Table 1).
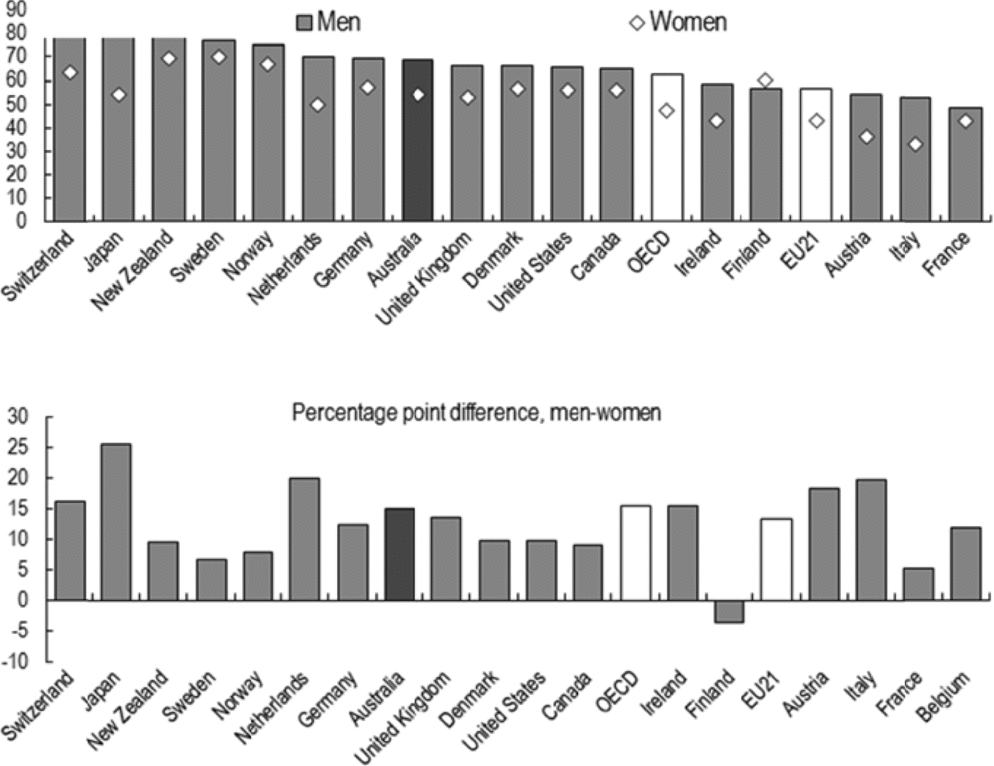
Although progress is being made to increase employment rates in the older population, nevertheless the employment rate for older people aged fifty-five to sixty-four, at 69 per cent for men and 54 per cent for women, remains well below the rate recorded by the highest achieving countries in the OECD (Figure 1). New Zealand, Switzerland and Japan, for example, have employment rates of around 80 per cent for men in this age group. New Zealand records an employment rate of 70 per cent for women aged fifty-five to sixty-four, one of the highest in the advanced economies. More needs to be done to improve gender equality in employment and to close the gender employment gap (at 15 per cent) that exists amongst older workers in Australia. Gender equality is not just about economic empowerment but clearly maximising economic opportunities for older women to participate fully in the economy would mark progress. Finland is exceptional amongst the advanced economies (Figure 1); here we find higher employment rates for women than for men in the fifty-five to sixty-four age group (61 per cent for women compared to 57 per cent for men).
Employment rates of older people aged 55–64 in OECD countries

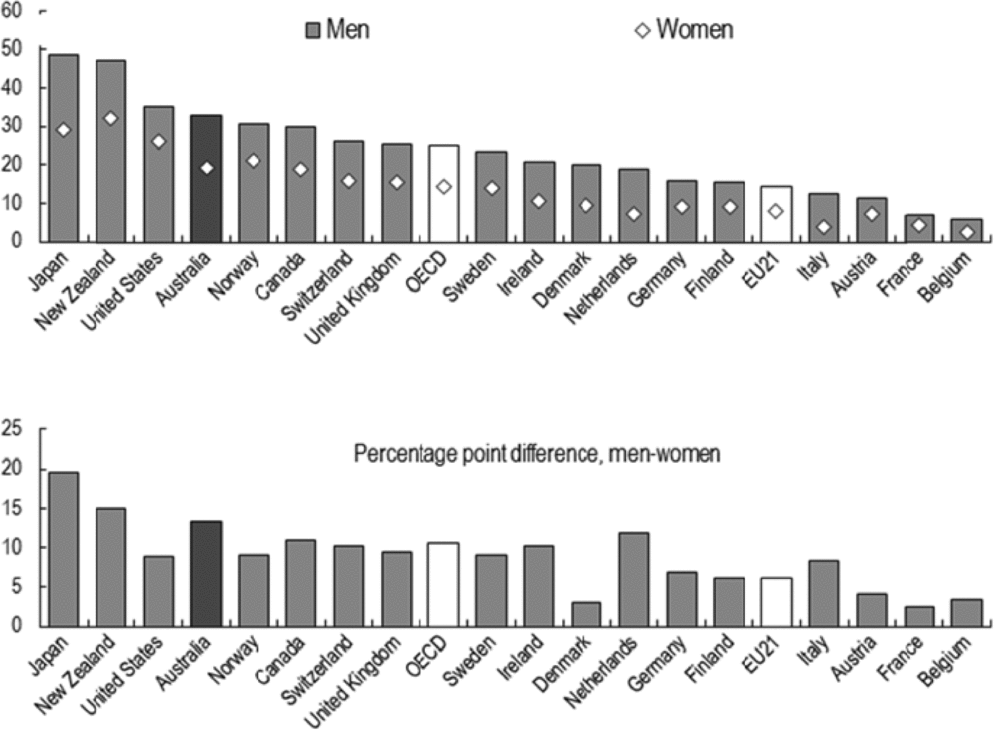
Unsurprisingly, employment rates for older workers aged sixty-five to sixty-nine across the OECD are considerably lower than for workers in the fifty-five to sixty-four age group. Australia performs well against the OECD and EU averages, with employment rates for men at 33 per cent and 19 per cent for woman (Figure 2). That said, employment rates for older Australian workers aged sixty-five to sixty-nine are well below those recorded in some of the other advanced nations such as New Zealand and Japan, with employment rates close to 50 per cent for men and around 30 per cent for woman in both countries in this age group (Figure 2). The gender employment gap between men and women aged sixty-five to sixty-nine in Australia, at 13 per cent, is slightly higher than the OECD group average of 10 per cent (Figure 2). Employment of older workers is generally higher in OECD countries outside Europe. These countries have experienced stronger growth following the global financial crises. Australia even managed to avoid a technical recession (the only other advanced economy to do so out of all of the other OECD countries was Poland).
Employment rates of older people aged 65–69 in OECD countries

Issues facing older workers in the labour market
There are a number of key barriers to employment facing older people. The specific focus of the social investment perspective is of course human capital and the problem of weak employability. Other barriers include financial incentives and disincentives to continue in work or retire; financial incentives remain the traditional levers used by policymakers for promoting behavioural change (Taylor, Reference Taylor2002). Then there are employer barriers such as age discrimination (Australian Human Rights Commission, 2015), unsuitable working conditions and/or working time arrangements, and the need for more flexible working arrangements in the older population more generally.
Weak employability
Older workers in Australia have achieved a relatively high education level and tertiary education rates have been increasing: 27 per cent of Australians in the fifty-five to sixty-four age group had completed tertiary education in 2003, by 2013 this figure had risen to 35 per cent (Table 1). The results for Australia compare favourably with the OECD average; in 2013, only 27 per cent of citizens aged fifty-five to sixty-four in the OECD had completed tertiary education. Nevertheless, the present generation of older workers in Australia and the other OECD countries have less formal education than their younger counterparts and this puts them at a disadvantage in the labour market.
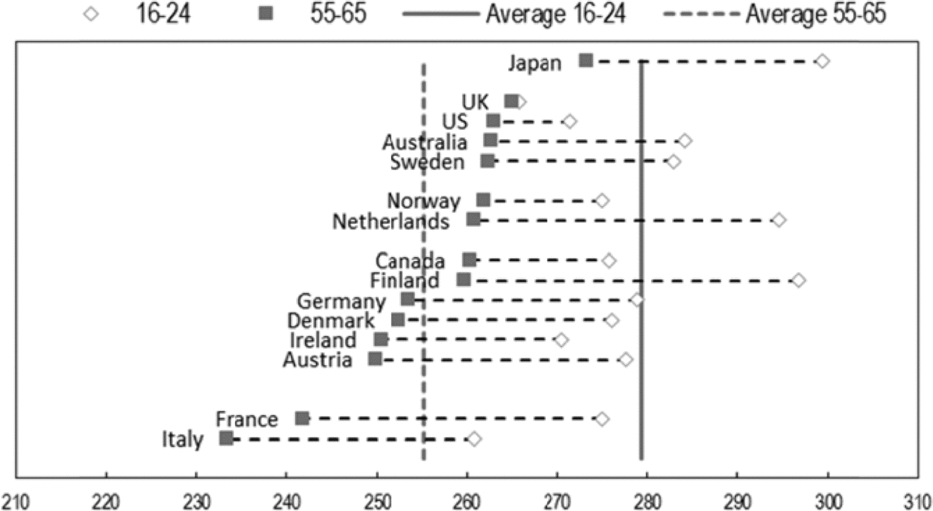
Formal education is not all that matters for employability. Employment prospects for some groups of older people are poor because they have obsolete skills. The rapid and fundamental restructuring of the labour market, with the emergence of new requirements with regard to skills has been a challenge for many older workers. The Programme for the International Assessment of Adult Competencies (PIAAC) provides new insights into skill levels in OECD countries (OECD, 2013). The OECD survey assesses a range of skills in the adult population: literacy, numeracy and problem solving in the context of technology-rich environments. While there are large individual level variations, older adults are generally found to have lower proficiency in these skills than their younger counterparts. Figure 3 shows, for example, considerable progress in literacy skills in the advanced economies for two generations: aged sixteen to twenty-four and fifty-five to sixty-five. Australia performs particularly well against the OECD average across generations and has made considerable progress in literacy skills compared to most other countries (with the exceptions of Japan, the Netherlands and Finland). Still, the age gap in literacy skills in Australia is considerable since literacy in the sixteen to twenty-four group is much higher compared to older workers in the fifty-five to sixty-five age group (Figure 3). The problem of employability is thus compounded over the life-course, indicating the growing need for greater investment in education and skills training programmes for older workers in order to maintain the employability of the ageing workforce.
Progress in literacy skills for two generations in OECD countries

Financial incentives and disincentives
Until the early 1990s, income transfers in the advanced economies were often designed to induce early retirement, the expectation being that older workers would be replaced by unemployed younger workers. However, this strategy was undone by demographic shifts and an ever-growing population of older workers. With the fiscal crises of pension systems, the 1994 Jobs Strategy (OECD, 2006b) contained a recommendation to adjust policies and programmes for older workers, so as to provide more people with better opportunities and incentives to continue working past traditional retirement age and reduce the economic incentives for older people to withdraw from the labour market.
In Australia, comprehensive pension reforms were introduced in 2009 following the Harmer Review of pensions, commissioned by the Labor government (2007–13) with the aim of improving the adequacy, sustainability and flexibility of the pension system (Harmer Review, Reference Review2009). Pension replacement rates in Australia remain low by international standards (OECD, 2011), although Labor managed to raise the minimum-income protection floor to protect the poorest old-age pensioners during its term in office (minimum-income protection floor was set at 28 per cent of average weekly male earnings) and increased the compulsory minimum superannuation obligation required by employers. More generally, the Australian social security system relies heavily on setting very strong work incentives, largely at the expense of income support allowances and relatively low wage replacement rates (Deeming, Reference Deeming2014).
From 2017 to 2023, the qualifying age for the means-tested Age Pension will increase gradually from sixty-five to sixty-seven (the eligibility age is set to increase to 65.5 years in July 2017, and then six-month increments every two years, until it reaches the age of sixty-seven years in July 2023). The Liberal coalition government, now led by Malcolm Turnbull, is seeking to further increase the Age Pension age to seventy years if the Liberals secure a clear majority at the federal election (2 July 2016). They intend to increase the Age Pension age to seventy years, in six-month increments (every two years) starting from July 2017, until it reaches the age of seventy years in July 2035. Later and more flexible retirement will help to ensure pension sustainability and future national prosperity, but there are a range of employer barriers that need to be addressed if employment rates in the older population are to increase.
Employer barriers
The reluctance of employers to hire or retain older workers reflects a combination of both subjective age factors, such as age discrimination, and objective factors, such as mandatory-retirement rules.
Many older workers in Australia face the problem of age discrimination. In the period 2013 to 2014, employment related age discrimination was the main area of complaint to the Australian Human Rights Commission under the Age Discrimination Act 2004, making up 62 per cent of age-related complaints in the last financial year (Australian Human Rights Commission, 2015). The main age groups of complainants were fifty-five to sixty-four years (31 per cent of age-related complaints) and sixty-five to seventy-four years (17 per cent of age-related complaints). The Commission's survey of age discrimination in the workplace found that over a quarter (27 per cent) of Australians aged fifty years and over indicated that they had experienced some form of age discrimination in the workplace during the past two years. While a third (33 per cent) of people who had been discriminated against gave up looking for work as a result of experiencing age discrimination (Australian Human Rights Commission, 2015). In Australia, mandatory retirement is expressly unlawful since the practice of compulsory retirement in firms is incompatible with the overall thrust of offering greater choice to workers’ retirement decisions.
In practice, many older Australians choose to retire at the age of first entitlement for standard retirement benefits. This tendency may lend some support to social policies which modify statutory retirement ages as mentioned earlier; but as Dean (Reference Dean, Keune and Serrano2014) argues, a renewed focus on decent work, better quality jobs and the recognition of social value may be a more effective way to improve labour market participation and extend working lives in the long term. The growing population of older workers in OECD countries will almost certainly mean more work for occupational health teams undertaking health risk assessments of work situations, job design and working time arrangements, which in the future are likely to include more flexible work, part-time as well as full-time work, for older workers (Sharit and Czaja, Reference Sharit, Czaja, Borman and Hedge2012). Poor or inappropriate working conditions can push older workers into early retirement for instance. While a lack of opportunities to shift to part-time work may limit the scope for a more phased transition to retirement.
Inclusion and social investment for all?
Access to lifelong learning
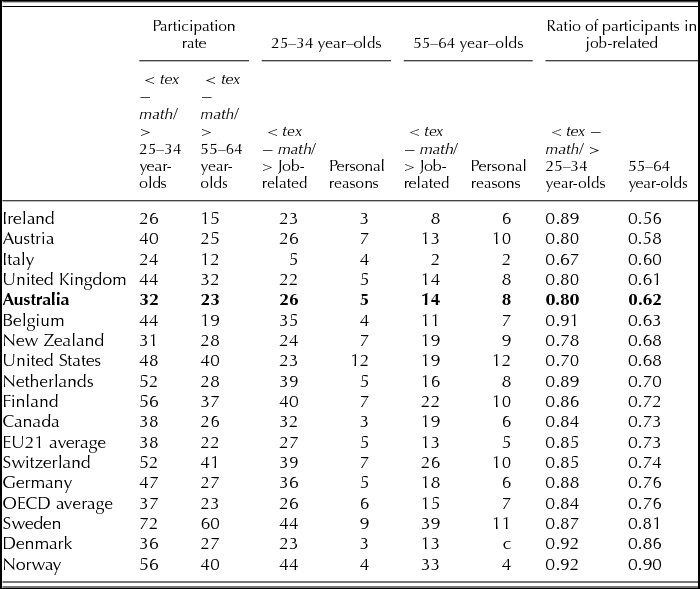
Investment in lifelong learning and education has a positive impact on older worker employment levels and the effective age of labour market exit (Hemerijck, Reference Hemerijck2013). New skills and competencies can be acquired from education over the life-course; however, surveys suggest that participation in non-formal education for people aged fifty-five to sixty-four is relatively low compared to younger adults in the twenty-five to thirty-four age group (across the OECD, adults in the younger age group have a participation rate nearly twice that of adults in the older age group). As shown in Table 2, less than a quarter of the older Australian population aged fifty-five to sixty-four report they have participated in some form of non-formal education during the 2005–2009 reference period, according to the recent cross-national survey of education (OECD, 2012).
Participation and purpose of non-formal education, for 25–34 and 55–64 year-olds

Note: Reference period is 2005–09.
Source: OECD (2012).
Participation in non-formal education tends to be higher for older people (aged fifty-five to sixty-four) in the Nordic welfare states of Finland, Norway and Sweden. Participation rates are highest in Sweden, at 60 per cent, according to the survey of education. The type and quality of non-formal education is also important for employability with participation in job-related training schemes being particularly important. Table 2 also shows that the vast bulk of non-formal education in the Nordic context is job related according to the survey of education. In sum, levels of participation in non-formal education are relatively low in Australia, as is the proportion of the population undertaking job-related training. However, it is certainly true that employment rates for older workers are still pretty good in Australia, and Australia provides access to high-quality education by OECD standards. On the face of it, the Australian approach to economic management appears to be working well despite these shortcomings, even without an explicit social investment strategy supporting the older workforce. Australia's success comes in no small measure from the country's economic success (so caution is needed in cross-national comparisons in this field; we are not strictly comparing like with like here). Australia has become accustomed to high levels of economic growth over the past two generations, which has helped sustain the demand for workers generally. However, growth may not last and more could be done to tackle entrenched inequalities in the labour market for older workers to ensure broad-based, employment centred development and inclusiveness of economic growth (Smyth and Buchanan, Reference Smyth, Buchanan, Smyth and Buchanan2013b).
The role of training and skills development in active labour market policies
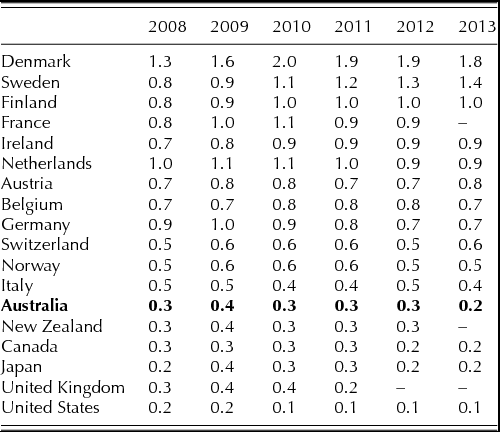
As outlined earlier, the legitimate role of the new “active” welfare state is to mobilise the full productive potential of citizens. New ‘activation’ and job training programmes can help to reskill workers and increase their job readiness. Long-term unemployment can deskill in the knowledge economy. Training unemployed citizens in the skills required by employers is therefore part of the supply-side approach to social policy to overcome shortfalls in the economy. Compared to European countries, however, the level of state investment in human capital policies and active labour market programmes (ALMPs) in Australia and other liberal market economies remains relatively low by comparison (Table 3). At the same time, it should be noted that the effectiveness of ALMPs to generate successful employment outcomes has been questioned in the Australian context (Belchamber, Reference Belchamber, Smyth and Buchanan2013), and elsewhere (Filges et al., Reference Filges, Smedslund, Knudsen and Jørgensen2015).Footnote 2 Table 3 shows total annual expenditure on active labour market policies in Australia stood at 0.2 per cent of GDP in 2013, and no more than 0.4 cent of GDP during the 2008–13 period. Denmark maintains the highest expenditure on ALMPs, spending nearly 2 per cent of GDP on a wide range of supply-side based active labour market measures in 2013. The relatively low level of investment in ALMPs may surprise, given the growing commitment to social investment and inclusive growth in Australia (Smyth and Buchanan, Reference Smyth and Buchanan2013a). However, if social investment in ‘human capital policies’ is more broadly conceived to include education (including vocational education and training in schools and universities), we find Australia has above average spending and performs well on educational and training outcomes but the lack of attention to the needs of older workers remains a concern (Burke, Reference Burke, Smyth and Buchanan2013).
Public expenditure on active labour market policies in OECD countries (per cent of GDP)

Source: OECD Employment and Labour Markets Statistics (DOI: 10.1787/lfsdata–en).
There is widespread consensus that advanced welfare states have to maintain a highly skilled and highly productive workforce in order to maintain living standards and competitive advantage in the global economy. Our policy focus on where older workers fit in the emerging national social investment strategies is therefore very timely, particularly so given the emphasis of contemporary social investment policy focused on addressing the needs of children and young people (Scarpetta et al., Reference Scarpetta, Sonnet and Manfredi2010).
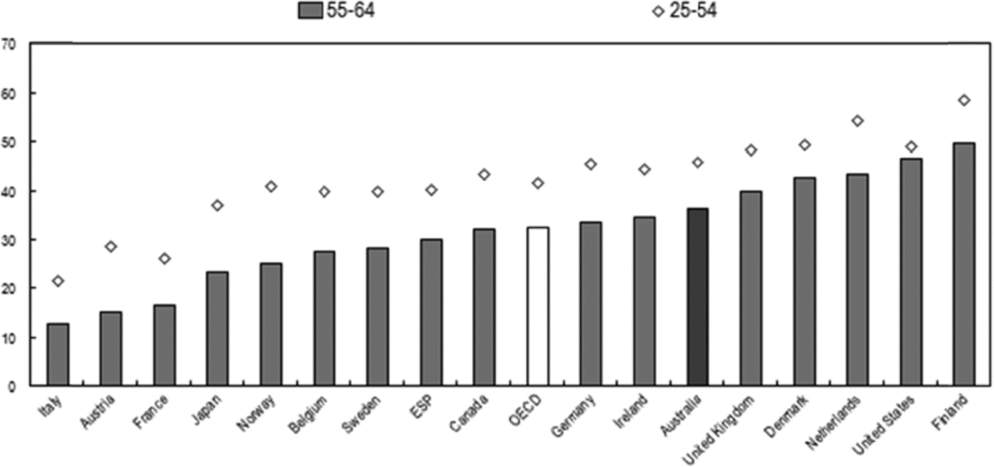
Older workers receive far less job-related training than younger workers in all OECD countries (Figure 4), although there is considerable variation across countries in the size of this gap (as well as in the overall level of training). There are clear aged-based and cross-national inequalities apparent in the data relating to skill proficiency, which provides a basis for analysing employability and the ability to update and learn new skills. Figure 4 shows participation rates in job-related training in Australia at 46 per cent in the age group twenty-five to fifty-four compared to 36 per cent in the older age group fifty-five to sixty-four. While the job-related training rates for older workers in Australia trail behind the rates found in comparable countries such as the UK and the US, as well as the Netherlands, Denmark and Finland (Figure 4).
Participation in job-related training by age group in OECD countries

In the context of rapid population ageing, social policies to encourage greater labour market participation in later life and new policies that foster employability are crucial. The level of government spending on social investment policies in many of the advanced economies will need to increase if older workers are to benefit and reskill. Investments in education and skills training will also make it easier for older people to take up so called ‘second careers’. Social investment policy in this context will mean enabling re-employment as well as slowing phased withdrawal from the labour force. This might mean linking training measures for older unemployed workers directly to a specific job and a better tailoring of active labour market policies and subsidies for employers taking on older workers. Discrimination is still very much in evidence in education and training policies, inequalities which disadvantage older workers persist (Figure 4). Unfortunately, such issues are neglected in the emerging social investment strategies at present.
Discussion and conclusion
In the advanced economies, ‘active’ (social investment-orientated) welfare states are now replacing the old ‘passive’ welfare regimes. The premise, in other words, is on work, and the objective is to increase labour market participation. However, in many of the advanced economies – including Australia – labour force participation rates for older workers are currently low, particularly for people aged over sixty-five. This is problematic (OECD 2006a; 2015a). The ratio of working population to retired population needs to increase in the advanced economies, not only for reasons of economic efficiency, but also because it is well known that being active in later life, which is not only about employment, is good for individual and collective social well-being (Deeming, Reference Deeming2009). The social investment perspective, as currently conceived, is rather narrow. The present focus on the early years and active social policies for younger adults will no longer suffice in ageing societies. The importance of the productive capability of older workers has largely been overlooked in national social investment strategies, Sweden appears the exception here (Lindh, Reference Lindh, Morel, Palier and Palme2011).
As we have shown, older workers face particular disadvantages in the labour market, and existing labour market disadvantages are further compounded by social investment strategies largely designed around the needs of young adults and children. Future social investment strategies will need to involve greater horizontal redistribution, to underpin the productive and reproductive social contract between generations, as Kvist (Reference Kvist2015) argues. New and more encompassing social investment strategies are needed to address the human capital requirements and the needs of employers. Our comparative analysis of survey data and social indicators also illustrates how employment rates of older people and national social investment strategies can and do vary. Here we might contrast the ‘thick’ or ‘heavy’ investment strategies pursued elsewhere in Northern Europe that have gone some way to address the growing needs of older workers, as shown in Table 2. Thus the participation rate of older people in non-formal education is relatively high in the Nordic context, the vast bulk of it is job-related training, underpinned by statist skill formation strategies (Eichhorst and Marx, Reference Eichhorst and Marx2015). By contrast, ALMPs and investment in human capital is generally weaker in liberal market societies, according to the cross-national indicators. Political parties of all persuasions, including Australian social democrats, have pursued ‘thin’ or ‘light’ human capital based investment strategies alongside the pro-market employment orientation of welfare provision (Deeming and Smyth, Reference Deeming and Smyth2015). In this article, we have shown how the social investment-orientated perspective in social policy has neglected the growing needs of the older population who now live longer and work longer; this neglect is particularly evident in market liberal societies like Australia but there are general lessons that can be learnt.
The picture of social investment strategies we have presented shows the need for a reorientation of social policy to meet the challenges posed by ageing populations. The policy imperative to rebuild a new welfare state around work is growing. In the context of ageing populations, this imperative becomes more urgent, with the growing need to increase the economically active population in relation to the dependent population. Social investment strategies must counteract processes of cumulative disadvantage. Older workers have less tertiary education (but the picture is improving), and face particular challenges from deskilling, ageism, long-term unemployment and the lack of opportunity to develop the right skills for a knowledge economy. Increased investment in the human capital of older workers must now be given some priority in the advanced economies if social investment strategies are to succeed. This will mean broadening the investment perspective to include the (neglected) education and training needs of older workers to help ensure that everyone can contribute to and benefit from socially inclusive models of growth.