1 Introduction
Thermally driven flows play an important role in nature and in many industrial applications; examples are convection in the oceans and atmosphere, in the ventilation of buildings and in the cooling of devices. In most of these cases, the conducting surfaces are generally not smooth. As a paradigm for the study of thermal turbulence, Rayleigh–Bénard convection (RBC) – a fluid layer heated from below and cooled from above – has been studied extensively in the past few decades (for reviews, see e.g. Ahlers, Grossmann & Lohse Reference Ahlers, Grossmann and Lohse2009; Lohse & Xia Reference Lohse and Xia2010; Chillà & Schumacher Reference Chillà and Schumacher2012). A related but distinctly different model problem can be considered when the cooling and heating are applied to the vertical side walls, rather than to top and bottom plates. This system was referred to as a ‘differentially heated cavity’ in Batchelor (Reference Batchelor1954), and there are a large number works on this topic (Patterson & Imberger Reference Patterson and Imberger1980; Paolucci & Chenoweth Reference Paolucci and Chenoweth1989; Xin & Le Qur Reference Xin and Le Qur1995; Dol & Hanjalic Reference Dol and Hanjalic2001; Xu, Patterson & Lei Reference Xu, Patterson and Lei2009; Yousaf & Usman Reference Yousaf and Usman2015; Dou & Jiang Reference Dou and Jiang2016; Belleoud, Saury & Lemonnier Reference Belleoud, Saury and Lemonnier2018). However in the current paper, in order to emphasize the difference between this system and RBC, we prefer to refer to it as vertical natural convection (VC) as adopted in Ng et al. (Reference Ng, Ooi, Lohse and Chung2015, Reference Ng, Ooi, Lohse and Chung2017, Reference Ng, Ooi, Lohse and Chung2018) and Shishkina (Reference Shishkina2016). An important feature of VC as compared to RBC is that gravity acts orthogonal to the heat flux, which happens frequently in nature, in building ventilation, in power plants and in electronic chip systems. Hence, enhancing the heat transport in this particular configuration can have great relevance in many applications.
To enhance the heat transfer in thermal convection, numerous strategies have been proposed, such as introducing wall roughness, nanofluids (Tiwari & Das Reference Tiwari and Das2007; Corcione Reference Corcione2010) or bubbles (Narezo Guzman et al. Reference Narezo Guzman, Xie, Chen, Fernandez Rivas, Sun, Lohse and Ahlers2016; Gvozdić et al. Reference Gvozdić, Almras, Mathai, Zhu, van Gils, Verzicco, Huisman, Sun and Lohse2018, Reference Gvozdić, Dung, Almras, van Gils, Lohse, Huisman and Sun2019). Among these approaches, the introduction of symmetric wall roughness has been shown to be an efficient way to enhance the transfer properties. Hence, numerous experimental (Shen, Tong & Xia Reference Shen, Tong and Xia1996; Du & Tong Reference Du and Tong1998, Reference Du and Tong2000; Roche et al. Reference Roche, Castaing, Chabaud and Hebral2001; Qiu, Xia & Tong Reference Qiu, Xia and Tong2005; Tisserand et al. Reference Tisserand, Creyssels, Gasteuil, Pabiou, Gibert, Castaing and Chilla2011; Salort et al. Reference Salort, Liot, Rusaouen, Seychelles, Tisserand, Creyssels, Castaing and Chilla2014; Xie & Xia Reference Xie and Xia2017; Jiang et al. Reference Jiang, Zhu, Mathai, Verzicco, Lohse and Sun2018), numerical (Stringano, Pascazio & Verzicco Reference Stringano, Pascazio and Verzicco2006; Yousaf & Usman Reference Yousaf and Usman2015; Wagner & Shishkina Reference Wagner and Shishkina2015; Toppaladoddi, Succi & Wettlaufer Reference Toppaladoddi, Succi and Wettlaufer2017; Zhu et al. Reference Zhu, Stevens, Verzicco and Lohse2017; Jiang et al. Reference Jiang, Zhu, Mathai, Verzicco, Lohse and Sun2018; Zhang et al. Reference Zhang, Sun, Bao and Zhou2018) and theoretical (Villermaux Reference Villermaux1998; Shishkina & Wagner Reference Shishkina and Wagner2011; Goluskin & Doering Reference Goluskin and Doering2016) efforts have been made to explain and control the heat transfer in thermal convection with symmetrically rough walls, mainly in the context of RBC.
In addition to the widely explored case of symmetric roughness, a more general possibility is to use asymmetrically rough surfaces that resemble the classical Feynman–Smoluchoski ratchet (Smoluchowski Reference Smoluchowski1912; Feynman, Leighton & Sands Reference Feynman, Leighton and Sands1963). Several experimental and numerical investigations have employed the Feynman–Smoluchoski ratchet-like roughness in various problems, all leading to a breaking of the symmetry of the system. These include self-propelled Leidenfrost droplets and solids on ratchet surfaces (Linke et al. Reference Linke, Alemán, Melling, Taormina, Francis, Dow-Hygelund, Narayanan, Taylor and Stout2006; Lagubeau et al. Reference Lagubeau, Merrer, Clanet and Quéré2011), ‘capillary ratchets’ in feeding by birds (Prakash, Quéré & Bush Reference Prakash, Quéré and Bush2008) and even ‘Brownian ratchets’ of molecular motors (Van Oudenaarden & Boxer Reference Van Oudenaarden and Boxer1999; Hänggi & Marchesoni Reference Hänggi and Marchesoni2009). In the context of RBC, Jiang et al. (Reference Jiang, Zhu, Mathai, Verzicco, Lohse and Sun2018) recently found that ratchet-like roughness induces symmetry breaking and thereby a preferred orientation of the large-scale circulation and pronounced difference in heat transfer, depending on whether the large-scale roll sweeps along or against the ratchet direction.
In the present work, we conduct a combined experimental and numerical study of the influence of ratchet-like (asymmetric) wall roughness on heat transfer and flow dynamics in VC, in particular on the large-scale circulation roll (LSCR). Similar to the definitions in RBC, the relevant parameters in VC are: the Rayleigh number
 $Ra$
– the dimensionless temperature difference between hot and cold vertical walls; the Prandtl number
 $Pr$
– the ratio of momentum diffusivity to thermal diffusivity; and as a response of the system the Nusselt number
 $Nu$
– the dimensionless specific heat flux. These are defined as
 $$\begin{eqnarray}\displaystyle Ra={\displaystyle \frac{\unicode[STIX]{x1D6FC}gH^{3}\unicode[STIX]{x1D6E5}}{\unicode[STIX]{x1D708}\unicode[STIX]{x1D705}}},\quad Pr={\displaystyle \frac{\unicode[STIX]{x1D708}}{\unicode[STIX]{x1D705}}}\quad \text{and}\quad Nu={\displaystyle \frac{J}{(\unicode[STIX]{x1D712}\unicode[STIX]{x1D6E5}/H)}}, & & \displaystyle\end{eqnarray}$$
where
 $\unicode[STIX]{x1D6FC}$
,
 $g$
,
 $H$
,
 $\unicode[STIX]{x1D6E5}$
,
 $\unicode[STIX]{x1D708}$
,
 $\unicode[STIX]{x1D705}$
,
 $\unicode[STIX]{x1D712}$
and
 $J$
are the thermal expansion coefficient, gravitational acceleration, thickness of the fluid layer between the conducting plates, temperature difference between hot (
 $T_{h}$
) and cold (
 $T_{c}$
) plates, kinematic viscosity, thermal diffusivity, thermal conductivity of the convecting fluid and heat flux per unit area, respectively.
In Jiang et al. (Reference Jiang, Zhu, Mathai, Verzicco, Lohse and Sun2018), it was shown that in RBC the two different orientations of the LSCR over the asymmetric roughness structures gave different heat transport properties. This could be connected to the dynamics of plume emissions. The case in which the flow near the top and bottom plates moves along the smaller slope side of the ratchets (case A) gives a smaller
 $Nu$
enhancement compared to the case in which the flow near the top and bottom plates travels against the steeper slope side of the ratchets (case B), as in the latter case, additional plume emission is triggered.
How do these two cases compare in VC? Recent work (Ng et al. Reference Ng, Ooi, Lohse and Chung2015, Reference Ng, Ooi, Lohse and Chung2018) suggests that many of the flow features in VC are similar to those of RBC, such as the laminar-like scaling for the boundary layer thickness of velocity and temperature, the kinetic and thermal dissipations in the boundary layers and so on. Besides, the studies of VC with symmetric surface structures such as fins (Xu et al. Reference Xu, Patterson and Lei2009), squares (Shakerin, Bohn & Loehrke Reference Shakerin, Bohn and Loehrke1988) and sinusoidal roughness (Yousaf & Usman Reference Yousaf and Usman2015) also show similar phenomena and properties to RBC with symmetric rough conducting plates. Does this also mean that the effects of asymmetric ratchet structures on the heat transport and flow dynamics are also similar for VC and RBC? Answering these questions will be the objective of the present study.
The paper is organized as follows. We first describe the experimental set-up and numerical methods in § 2, which is divided into three subsections. Geometrical aspects of the convection cell, temperature monitoring techniques and shadowgraph visualization techniques are described in §§ 2.1–2.2. Section 2.3 introduces the numerical methods. Section 3 presents the results and analyses performed, with regard to the effects of ratchet structures on the heat transport efficiencies (§ 3.1), the dynamics of LSCR (§ 3.2) and the properties of temperature profiles (§ 3.3). In § 3.4 we highlight the differences in the heat transport in VC and RBC systems with ratchet structures. Final remarks and conclusions are given in § 4.
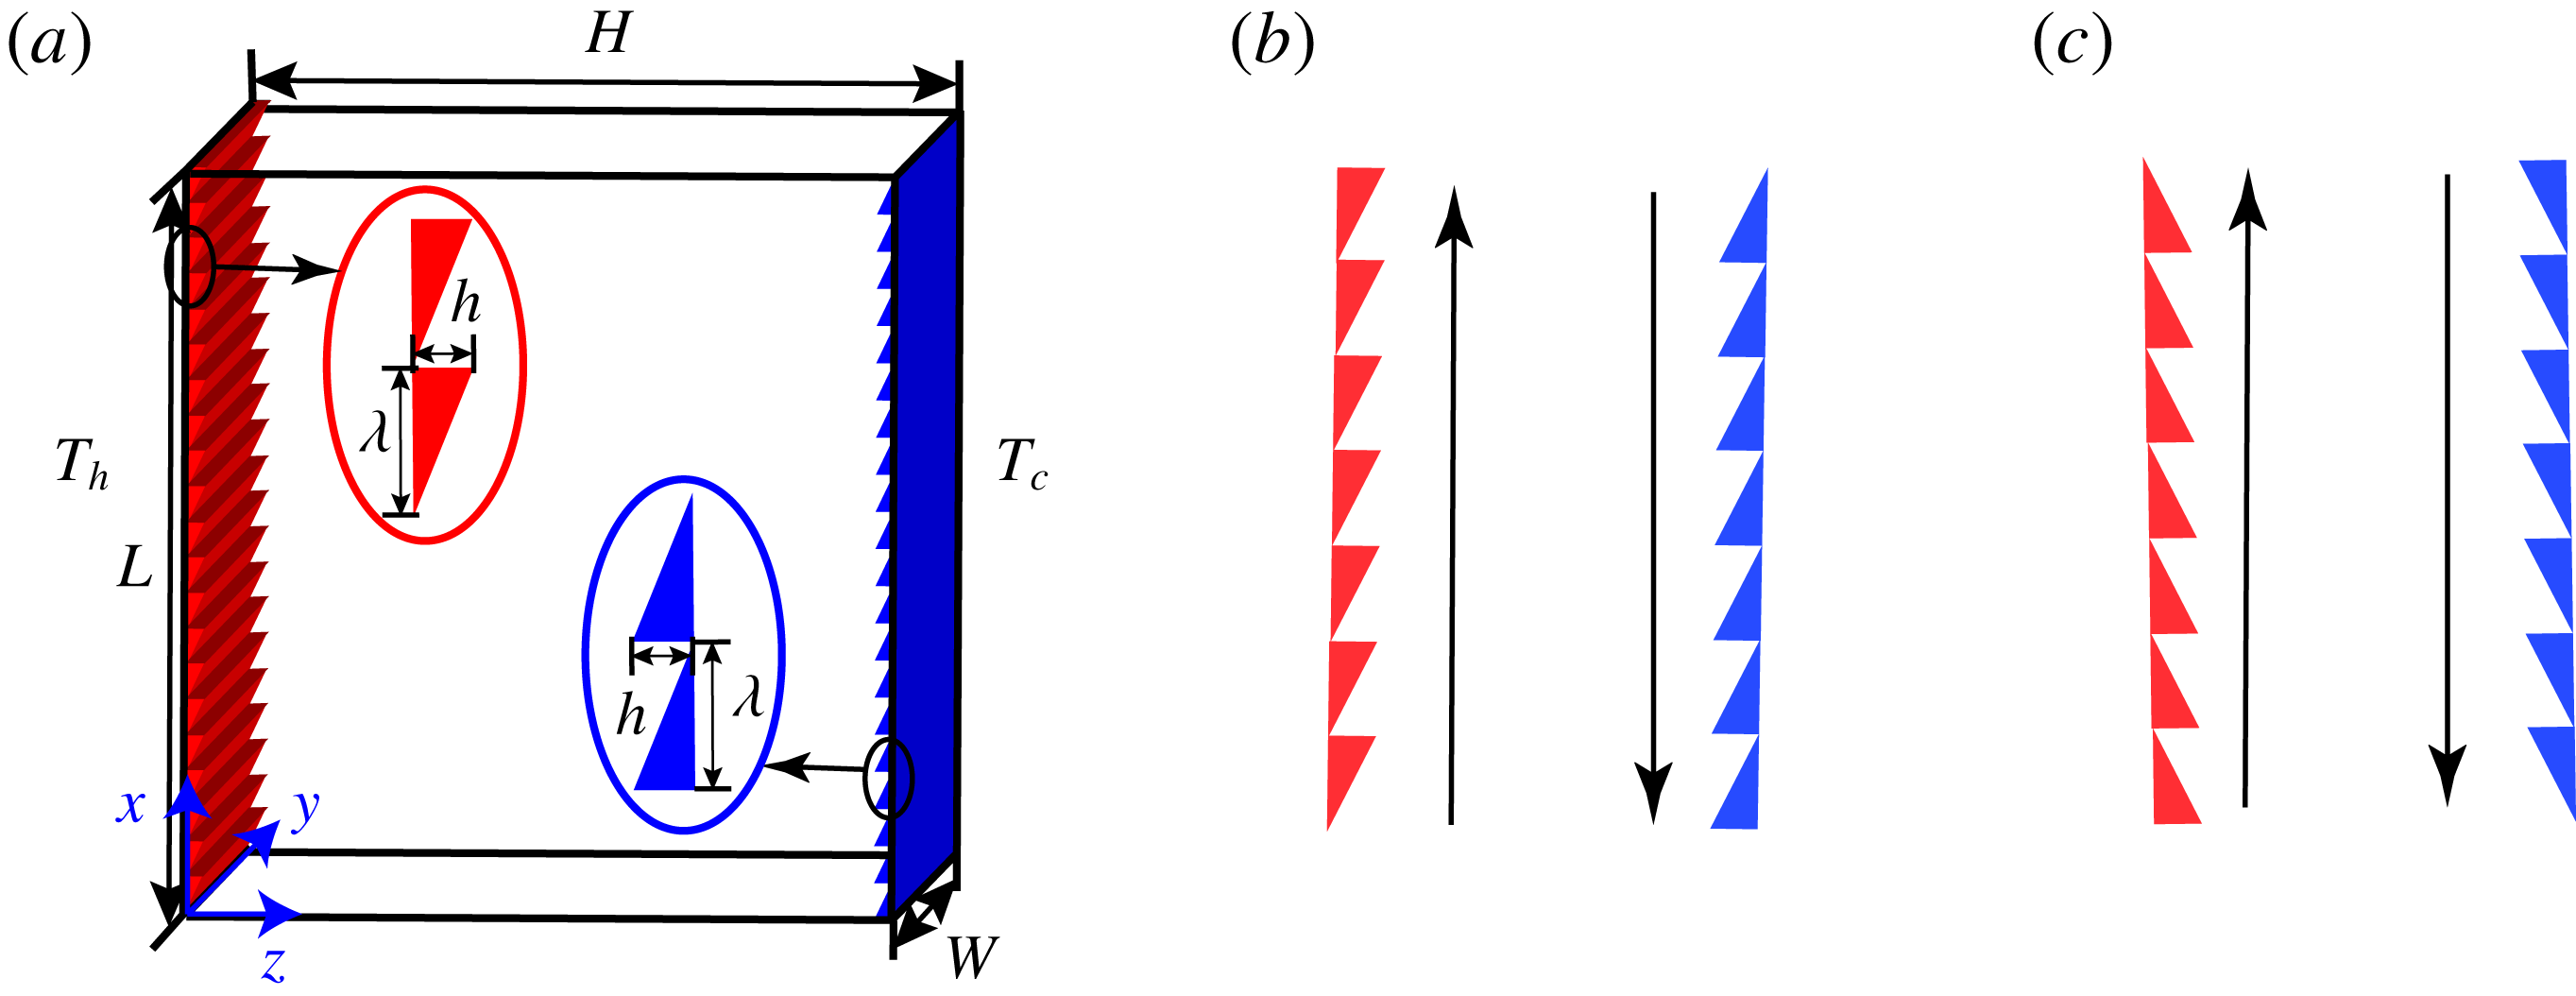
(a) A sketch of a convection cell with asymmetric ratchets on vertical side plates. (b) Schematic showing the flow configuration where the LSCR moves along the smaller slope side of the ratchets, referred to subsequently as VC-case-A. (c) Schematic of the flow configuration where the LSCR travels towards the steeper slope of the ratchets, subsequently referred to as VC-case-B.

2 Experimental set-up and direct numerical simulations
2.1 Convection cell
Experiments are performed in a rectangular cell (see figure 1 a), with ratchet structures on the hot and cold vertical conducting plates.
The conducting plates are made of copper, and their surfaces are electroplated with a thin layer of nickel to prevent oxidation. The sidewall of the cell is made of transparent Plexiglas for flow visualization. The length (
 $L$
), width (
 $W$
) and height (
 $H$
) of the cell are 240, 60 and 240 mm, respectively, resulting in a unit aspect ratio in the large-scale circulation plane (
 $\unicode[STIX]{x1D6E4}\equiv L/H=1$
). Two silicone rubber film heaters, which are supplied by DC power with a 0.05 % long-term stability, are sandwiched in the hot plate to provide constant heat flux. The cold vertical plate is connected to a cooling chamber, which is regulated at constant temperature by circulating cold water from a temperature-controlled circulating bath (Polyscience, PP15R-40-A12Y). The temperature stability of the circulating bath is 0.005 K within the experimental temperature range, and the maximum cooling power is 1 kW. In our experiments, there are two opposing inlets and two opposing outlets at the side of the chamber to keep the temperature of the cold plate as uniform as possible. It should be pointed out that the temperature boundary condition is constant temperature for cold plate and constant heat flux for hot plate in our experiments. In the RBC system, at high Ra, the difference of global heat transport between constant-temperature and constant-heat-flux boundary conditions is almost negligible (Johnston & Doering Reference Johnston and Doering2009; Huang et al.
Reference Huang, Wang, Xi and Xia2015). However in the VC system, there is a small difference in global heat transfer between the two temperature boundary conditions, which will be discussed in § 3.1.
The ratchet-like structures on the hot and cold vertical plates each have a height
 $h=6$
mm and the wavelength
 $\unicode[STIX]{x1D706}=12$
mm. In our experiments, the situation in which the flow near the hot and cold plates moves along the smaller slope side of the ratchets is subsequently referred to as VC-case-A (see figure 1
b). When the relative flow direction is reversed, i.e. when the flow near the hot and cold plates travels towards the steeper slope of the ratchets, we refer to this flow configuration as VC-case-B (see figure 1
c). For comparison, we have also studied a cell with smooth hot and cold plates, which is subsequently referred to as VC-smooth.
To study the heat transport over a wide
 $Ra$
range, we use two working fluids: (i) distilled water and (ii) Novec 7200 (Novec 7200 Engineered Fluid, 3M Inc.). The detailed properties for the two fluids are listed in table 1. In our experiments, for distilled water the temperature of the bulk fluid is maintained at
 $40\pm 0.05\,^{\circ }$
C, resulting in a corresponding Prandtl number
 $Pr=4.3$
. In comparison, Novec 7200 is maintained at a temperature of
 $25\,^{\circ }$
C, for which
 $Pr=10.7$
.
Properties of working fluid for water at 40
 $^{\circ }$
C and Novec 7200 at 25
 $^{\circ }$
C.

The convection cell is wrapped up with a 5 cm thickness of Styrofoam to minimize heat leakage to the surroundings. To further prevent heat leakage, a PID-controlled temperature-regulated aluminium basin is placed on the left of the heating plate so that the temperature difference between the heating plate and environment is minimized. Furthermore, we use a constant-temperature bath controlled by PID to keep the temperature of the outside environment the same as the bulk temperature. In this way, almost all the heat produced by the heaters is transported through fluid to the cooling plate. Consequently, the net heat flux could be calculated as the electric power consumed, which is determined from the applied voltage and current to the heating films.
2.2 Measurement techniques
The temperature of the heating plate is measured using six thermistors (Omega, 44131), which are embedded in the heating plate. The locations of the thermistors are 20, 60, 100, 140, 180 and 200 mm away from the bottom edge of the cell. Another six thermistors are used to measure the temperature of the cooling plate at mirrored locations of the cooling plate. The thermistor has a room temperature resistance of 10 k
 $\unicode[STIX]{x03A9}$
and is calibrated individually with an accuracy of 0.005 K using a circulating bath. We use the Steinhart–Hart equation (Lavenuta Reference Lavenuta1997) to convert the resistance of thermistors measured by a 6
 ${\textstyle \frac{1}{2}}$
-digit multimeter (Keithley, 2701) to temperature.
As described in Jiang et al. (Reference Jiang, Zhu, Mathai, Verzicco, Lohse and Sun2018), shadowgraphy is used to visualize the flow structures. A white light-emitting diode light is passed through a Fresnel lens to form a uniform and parallel light source. The parallel light passing through the cell will converge or diverge according to the varying degree of refraction inside the fluid, which is a function of fluid temperature. A sheet of wax-paper is used as a projection screen for the shadowgraph, which is recorded using a Nikon camera. In order to minimize effects due to optical imperfections, the shadowgraph image is subtracted by an averaged background image pixel by pixel.
2.3 Numerical methods
We carry out three-dimensional direct numerical simulations in a rectangular cell using the second-order finite difference code AFiD (Verzicco & Orlandi Reference Verzicco and Orlandi1996; van der Poel et al. Reference van der Poel, Ostilla-Mónico, Donners and Verzicco2015; Zhu et al. Reference Zhu, Phillips, Spandan, Donners, Ruetsch, Romero, Ostilla-Mónico, Yang, Lohse, Verzicco, Fatica and Stevens2018), in combination with an immersed-boundary method (Fadlun et al. Reference Fadlun, Verzicco, Orlandi and Mohd-Yusof2000) to track the ratchet structures. The code has been extensively validated in prior work (Zhu et al. Reference Zhu, Stevens, Verzicco and Lohse2017, Reference Zhu, Phillips, Spandan, Donners, Ruetsch, Romero, Ostilla-Mónico, Yang, Lohse, Verzicco, Fatica and Stevens2018; Jiang et al. Reference Jiang, Zhu, Mathai, Verzicco, Lohse and Sun2018). The governing Boussinesq equations in dimensionless forms read
 $$\begin{eqnarray}\displaystyle & \displaystyle {\displaystyle \frac{\unicode[STIX]{x2202}\boldsymbol{u}}{\unicode[STIX]{x2202}t}}+\boldsymbol{u}\boldsymbol{\cdot }\unicode[STIX]{x1D735}\boldsymbol{u}=-\unicode[STIX]{x1D735}p+\sqrt{{\displaystyle \frac{Pr}{Ra}}}\unicode[STIX]{x1D6FB}^{2}\boldsymbol{u}+\unicode[STIX]{x1D703}\hat{\boldsymbol{z}}, & \displaystyle\end{eqnarray}$$
 $$\begin{eqnarray}\displaystyle & \displaystyle \unicode[STIX]{x1D735}\boldsymbol{\cdot }\boldsymbol{u}=0, & \displaystyle\end{eqnarray}$$
 $$\begin{eqnarray}\displaystyle & \displaystyle {\displaystyle \frac{\unicode[STIX]{x2202}\unicode[STIX]{x1D703}}{\unicode[STIX]{x2202}t}}+\boldsymbol{u}\boldsymbol{\cdot }\unicode[STIX]{x1D735}\unicode[STIX]{x1D703}={\displaystyle \frac{1}{\sqrt{RaPr}}}\unicode[STIX]{x1D6FB}^{2}\unicode[STIX]{x1D703}, & \displaystyle\end{eqnarray}$$
where
 $\hat{\boldsymbol{z}}$
is the unit vector pointing in the direction opposite to that of gravity,
 $\boldsymbol{u}$
the velocity vector normalized by the free-fall velocity
 $\sqrt{g\unicode[STIX]{x1D6FC}\unicode[STIX]{x0394}H}$
,
 $t$
the dimensionless time normalized by
 $\sqrt{H/(g\unicode[STIX]{x1D6FC}\unicode[STIX]{x1D6E5})}$
,
 $\unicode[STIX]{x1D703}$
the temperature normalized by
 $\unicode[STIX]{x1D6E5}$
and
 $p$
the pressure normalized by
 $g\unicode[STIX]{x1D6FC}\unicode[STIX]{x1D6E5}/H$
. As seen from the above equations, the control parameters for the system are the Rayleigh and Prandtl numbers. The material properties and the geometry of the cell were chosen to be the same as used in experiments. The no-slip boundary conditions were adopted for the velocity at all solid boundaries. At hot and cold plates constant temperatures were prescribed and at all other walls heat-insulating conditions were adopted. Adequate resolutions are ensured for all simulations so that the results are grid independent. For example, at
 $Ra=5.7\times 10^{9}$
,
 $1280\times 1280\times 256$
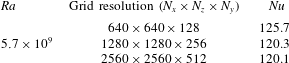
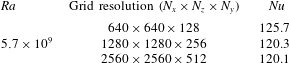
grid points are used for the cases with ratchet. To verify the grid resolution, we have conducted a set of grid convergence studies for VC-case-B at
 $Ra=5.7\times 10^{9}$
as listed in table 2. Three grid resolutions have been tested, namely
 $640\times 640\times 128$
,
 $1280\times 1280\times 256$
and
 $2560\times 2560\times 512$
, and the resulting Nusselt numbers are 125.7, 120.3 and 120.1. Thus it is reasonable to choose the grid resolution
 $1280\times 1280\times 256$
for
 $Ra=5.7\times 10^{9}$
.
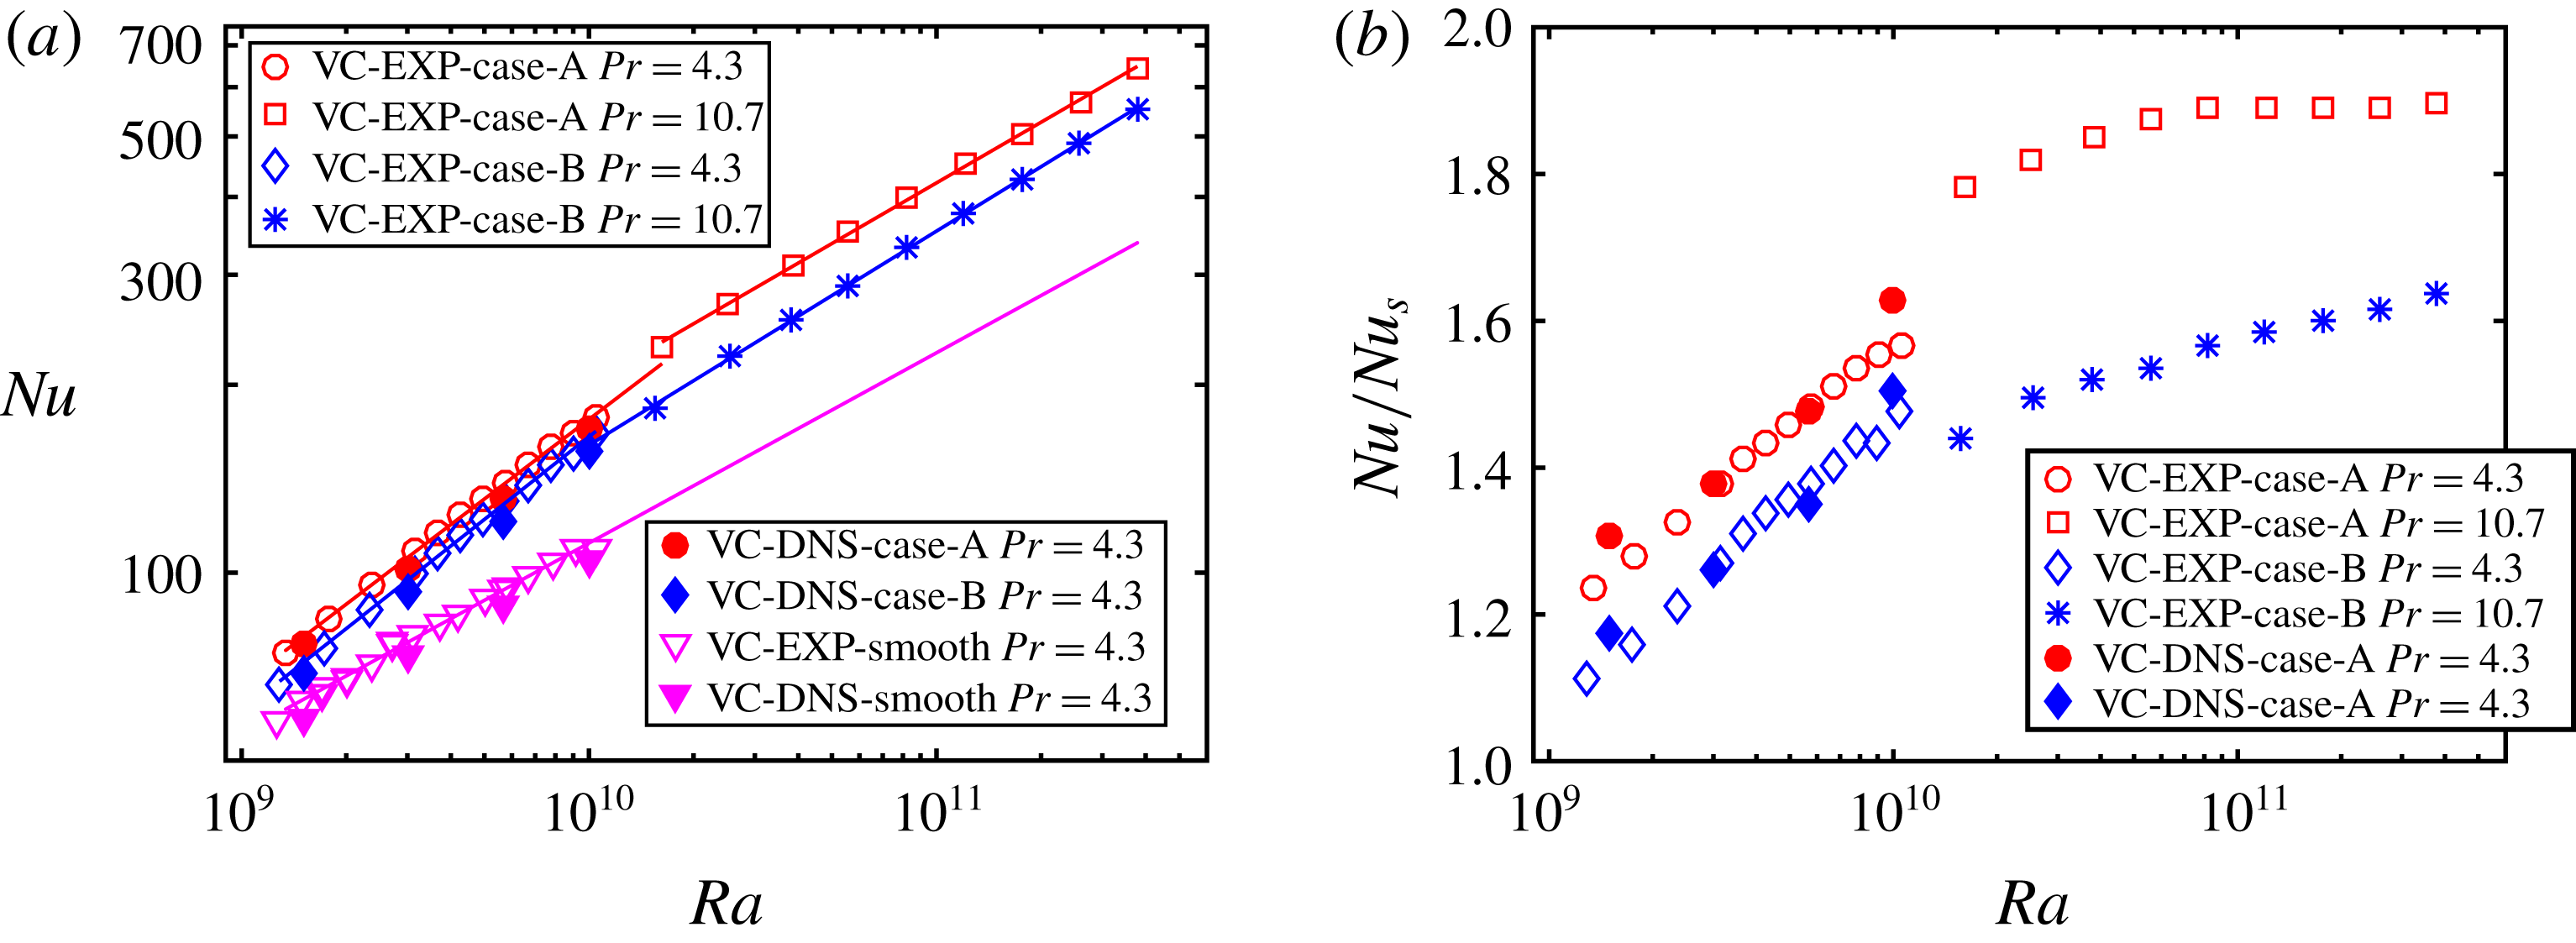
(a) Nusselt number
 $Nu$
as a function of Rayleigh number
 $Ra$
in the smooth and rough cells. (b) The
 $Nu$
enhancement as a function of
 $Ra$
for the two cases. The open symbols correspond to experimental data and the filled symbols correspond to numerical data.

Grid convergence studies for VC-case-B at
 $Ra=5.7\times 10^{9}$
.
3 Results and discussion
3.1 Heat transport
We first study the effects of ratchet structures on the convective heat transfer in VC. As mentioned in § 2.1, two kinds of working fluid are used for a wide
 $Ra$
range. Figure 2(a) shows the measured
 $Nu$
as a function of
 $Ra$
for VC cases A, B and smooth. The experiments for rough cases covered a
 $Ra$
range [
 $1.3\times 10^{9},3.8\times 10^{11}$
]. We expect that for the smooth case in such a
 $Pr$
range [4.3, 10.7], the
 $Nu$
dependence on
 $Pr$
would be quite weak (Grossmann & Lohse Reference Grossmann and Lohse2001; Stevens, Lohse & Verzicco Reference Stevens, Lohse and Verzicco2011) so that the results can be extrapolated to the whole
 $Ra$
range and
 $Nu(Ra)$
can be described by a power law with an effective exponent of
 $0.30\pm 0.01$
. However, the
 $Pr$
effect might manifest itself in the case of wall roughness. The reason is that if
 $Pr$
is greater than one, with increasing Rayleigh number, the roughness element will first perturb the thermal boundary layer and then perturb the viscous boundary layer which might result in multiple regimes of Nusselt scalings. A detailed competition between roughness height and boundary layer thicknesses (thermal and viscous) will eventually determine the local scaling exponent at a specific Rayleigh number. This deserves systematic study in future to understand the particular
 $Pr$
dependence in turbulent thermal convection with roughness.
Further, we find
 $Nu$
for the rough wall cases is larger than that for the smooth wall case and two different scaling regimes exist as reported in Zhu et al. (Reference Zhu, Stevens, Verzicco and Lohse2017). In regime I, corresponding to
 $Ra\in [1.3\times 10^{9},1.0\times 10^{10}]$
, the roughness elements perturb the thermal boundary layers, resulting in dramatically enhanced heat transport. The local effective exponents are
 $0.42\pm 0.01$
for VC-case-A and
 $0.44\pm 0.01$
for VC-case-B. Upon further increasing
 $Ra$
(up to
 $1.0\times 10^{10}$
), the scaling exponent saturates back to the effective value
 $0.32\pm 0.01$
for VC-case-A and
 $0.34\pm 0.01$
for VC-case-B, which we refer to as regime II. The numerical data are also plotted in figure 2(a). We find the experiments and simulations are in reasonable agreement, besides a marginal deviation in the absolute values. This small deviation can be attributed to the fact that in the numerical simulations, the temperature boundary conditions are constant temperature for both heating and cooling plates. However in our experiments, the temperature boundary conditions are mixed, with constant heat flux for the hot plate and constant temperature for the cold plate. For constant-heat-flux boundary condition, the thermal boundary layer develops along the heating surface, so there exists a temperature gradient along the heating plate. Indeed, at
 $Ra=1.05\times 10^{10}$
, in the VC experiments we find a maximum temperature difference
 $\unicode[STIX]{x1D6FF}T/\unicode[STIX]{x1D6E5}=0.17$
on the hot plate. The different boundary conditions presumably cause the difference in
 $Nu$
between experiments and numerical simulations.
To further demonstrate the
 $Nu$
enhancement, we normalize the data in the ratchet-structure cell by
 $Nu$
for the smooth case as shown in figure 2(b). Obviously,
 $Nu$
is enhanced in both rough cases. The
 $Nu$
enhancements for both cases have a similar trend: they are relatively small at the smallest
 $Ra\approx 10^{9}$
, and increase with
 $Ra$
monotonically. This occurs because with increasing
 $Ra$
the thermal boundary layer thickness
 $\unicode[STIX]{x1D6FF}_{T}$
decreases, resulting in an increase in the effective roughness height
 $h/\unicode[STIX]{x1D6FF}_{T}$
(Zhu et al.
Reference Zhu, Stevens, Verzicco and Lohse2017). Therefore, the roughness elements perturb the flow more strongly, which explains the increasing trend of the
 $Nu$
enhancement with increasing
 $Ra$
.
Next we focus on the difference in the
 $Nu$
enhancements between the two rough cases. At the smallest
 $Ra=1.3\times 10^{9}$
,
 $Nu$
enhancement
 $Nu_{en}=23.5\,\%$
for VC-case-A and
 $Nu_{en}=11.2\,\%$
for VC-case-B. However, the
 $Nu$
enhancements increase differently with increasing
 $Ra$
for the two cases. At the highest
 $Ra=3.8\times 10^{11}$
,
 $Nu_{en}$
are
 $89.8\,\%$
and
 $63.6\,\%$
for VC-case-A and VC-case-B, respectively. What could be the physical mechanisms governing this huge difference in the
 $Nu$
enhancement between the two cases? We will address this in the following section.
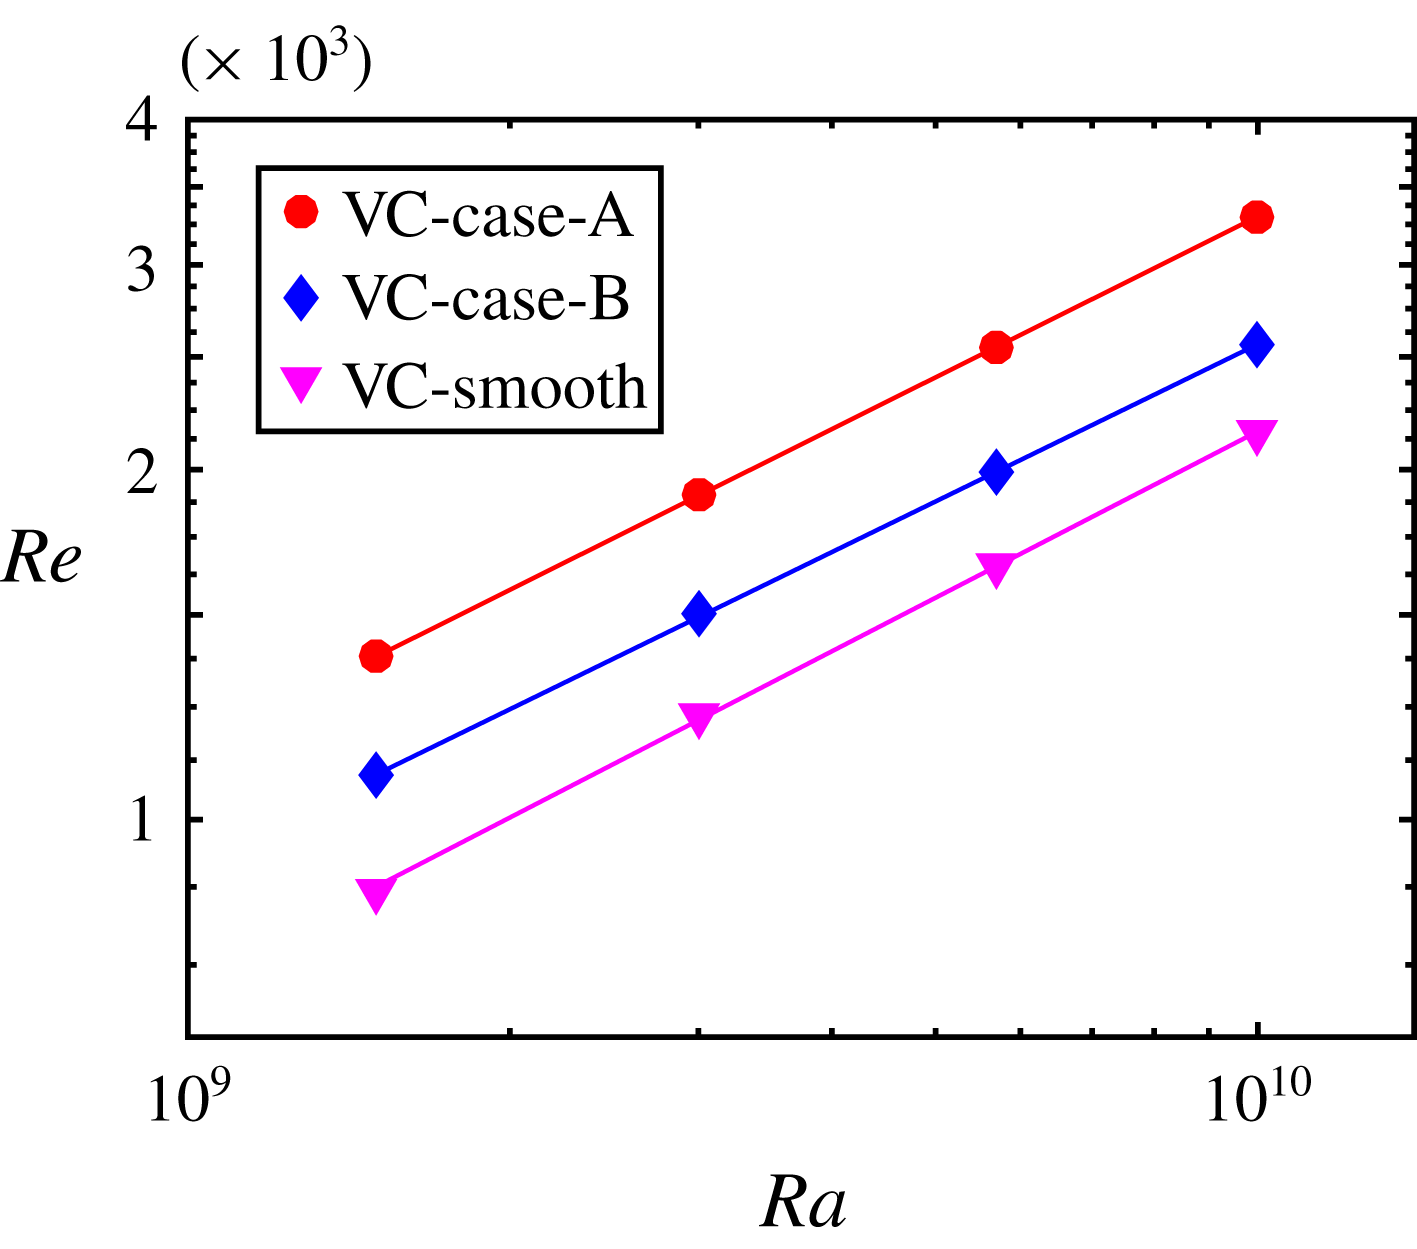
Reynolds number
 $Re$
as a function of the Rayleigh number
 $Ra$
. The
 $Re$
is defined as
 $Re=V_{LSC}H/\unicode[STIX]{x1D708}$
, where
 $V_{LSC}=(\langle u_{x}\rangle _{S})_{max}$
is the maximum mean vertical velocity of LSCR.

3.2 Dynamics of large-scale circulation
To study the mechanisms of distinct
 $Nu$
enhancements for the two cases, we measure the wind Reynolds number
 $Re$
as a function of
 $Ra$
, where
 $Re=V_{LSC}H/\unicode[STIX]{x1D708}$
, with
 $V_{LSC}=(\langle u_{x}\rangle _{S})_{max}$
the maximum vertical mean velocity of LSCR. Here the notation
 $\langle \cdot \rangle _{S}$
denotes the average over time and over (any) vertical plane. As evident from figure 3, VC-case-A has the highest
 $Re$
, followed by VC-case-B, and then the smooth case. The higher
 $Re$
in VC-case-A should be responsible for the higher heat transport efficiency than VC-case-B. However, what causes the difference in flow intensity for the two rough cases?
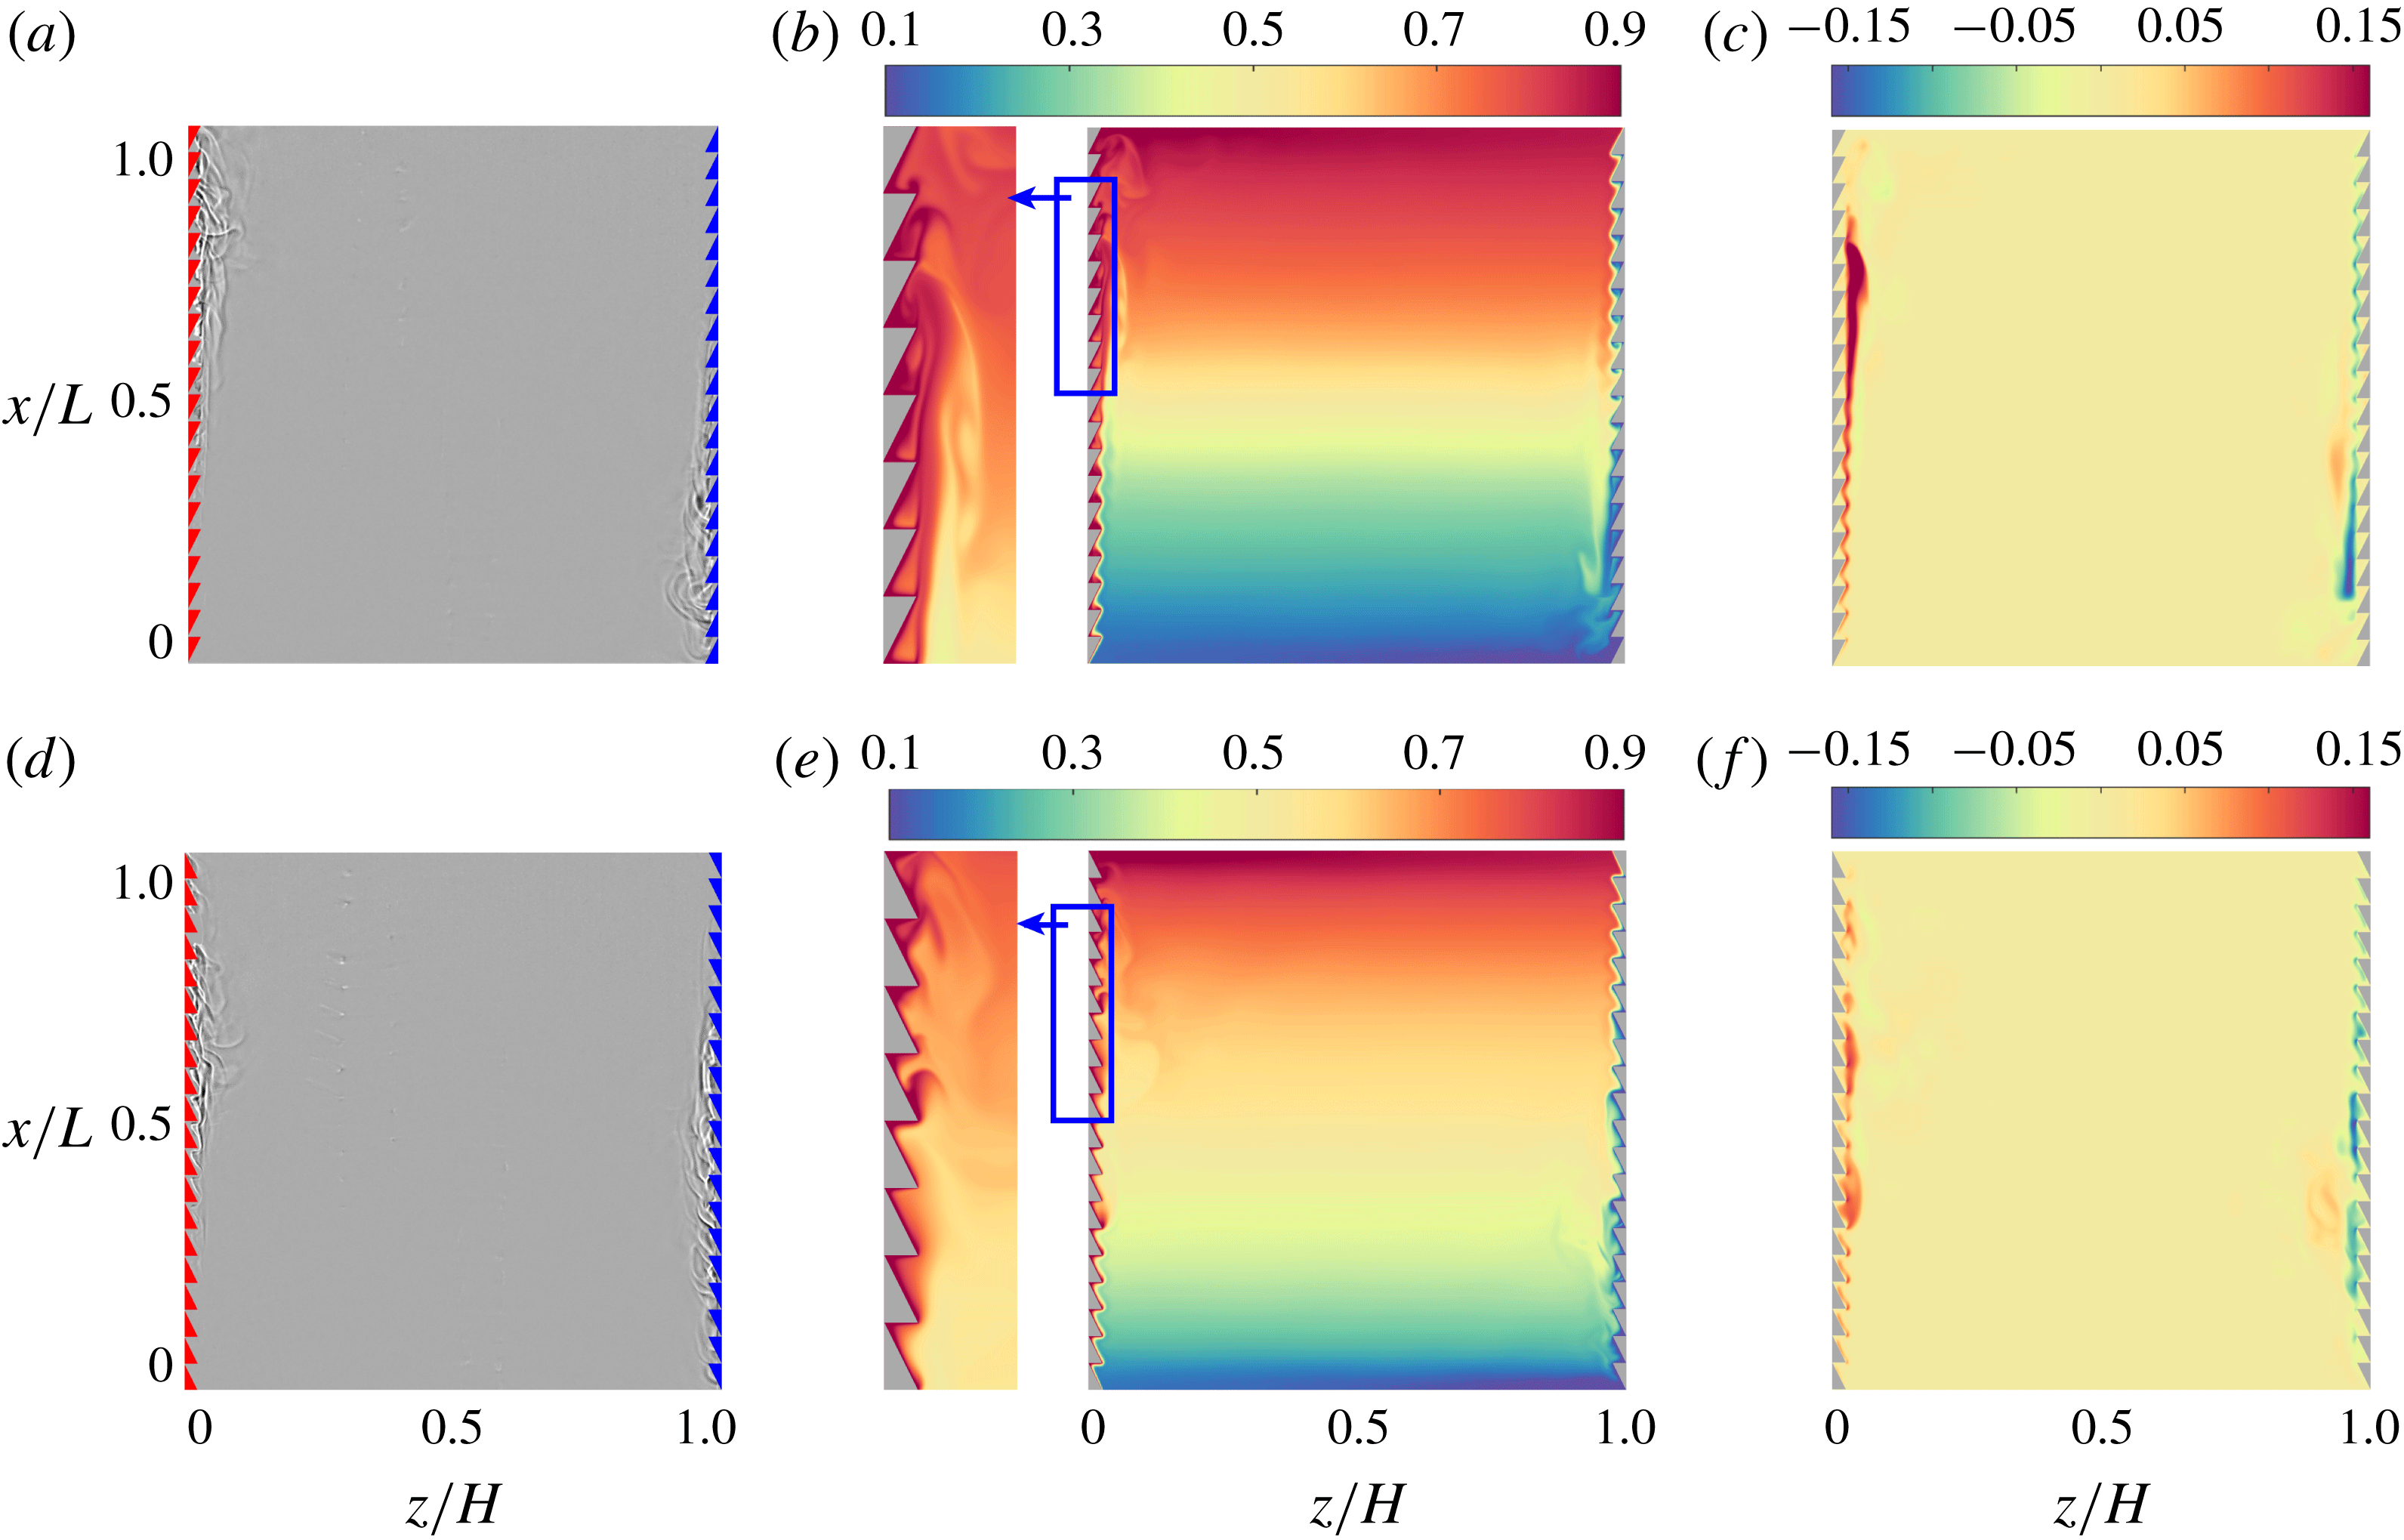
(a,d) Shadowgraph visualization at
 $Ra=5.7\times 10^{9}$
and
 $Pr=4.3$
for (a) VC-case-A and (d) VC-case-B. The directions of LSCR are clockwise in both cases. The corresponding movies (supplementary movie 1 for VC-case-A and movie 2 for VC-case-B) are available at https://doi.org/10.1017/jfm.2019.446. (b,e) Instantaneous temperature field from direct numerical simulations at
 $Ra=5.7\times 10^{9}$
and
 $Pr=4.3$
for (b) VC-case-A and (e) VC-case-B. The left-hand insets show an enlarged portion of the representative plot for the selected windows. (c,f) Instantaneous vertical velocity field from direct numerical simulations at
 $Ra=5.7\times 10^{9}$
and
 $Pr=4.3$
for (c) VC-case-A and (f) VC-case-B. In both cases the flow is quite calm and not turbulent.

To further elucidate the influence of the ratchet structures on the flow dynamics, we perform shadowgraph visualization at
 $Ra=5.7\times 10^{9}$
and
 $Pr=4.3$
. Figure 4(a,d) shows shadowgraph images for the two cases. For VC-case-A, the flow near the wall moves along the smaller slope side of the ratchets. In contrast, for VC-case-B (see figure 4
d), the sharp corners of the ratchets slow down the LSCR, resulting in weaker convection. Figures 4(b) and 4(e) show instantaneous dimensionless temperature fields at
 $Ra=5.7\times 10^{9}$
and
 $Pr=4.3$
for VC-case-A and VC-case-B, respectively. Consistent with the shadowgraph images, in VC-case-A the thermal plumes sweeping over the smaller slope of the ratchet elements are organized together to form a strong LSCR. In contrast, in VC-case-B the thermal plumes dissipate quickly due to the slowing down by the steeper slope of the ratchets, leading to a weaker LSCR. To further demonstrate the flow dynamics, we report the instantaneous dimensionless vertical velocity fields, shown in figure 4(c,f). For VC-case-A, the flow develops along the smaller slopes of the ratchets and is detached at the end of the wall to form a strong LSCR. However, the flow in VC-case-B is hindered by the sharp corners of the ratchets, and consequently results in lower LSCR velocities. This difference in the strength of the LSCR can be linked to the observed high heat transport efficiency of VC-case-A over VC-case-B.
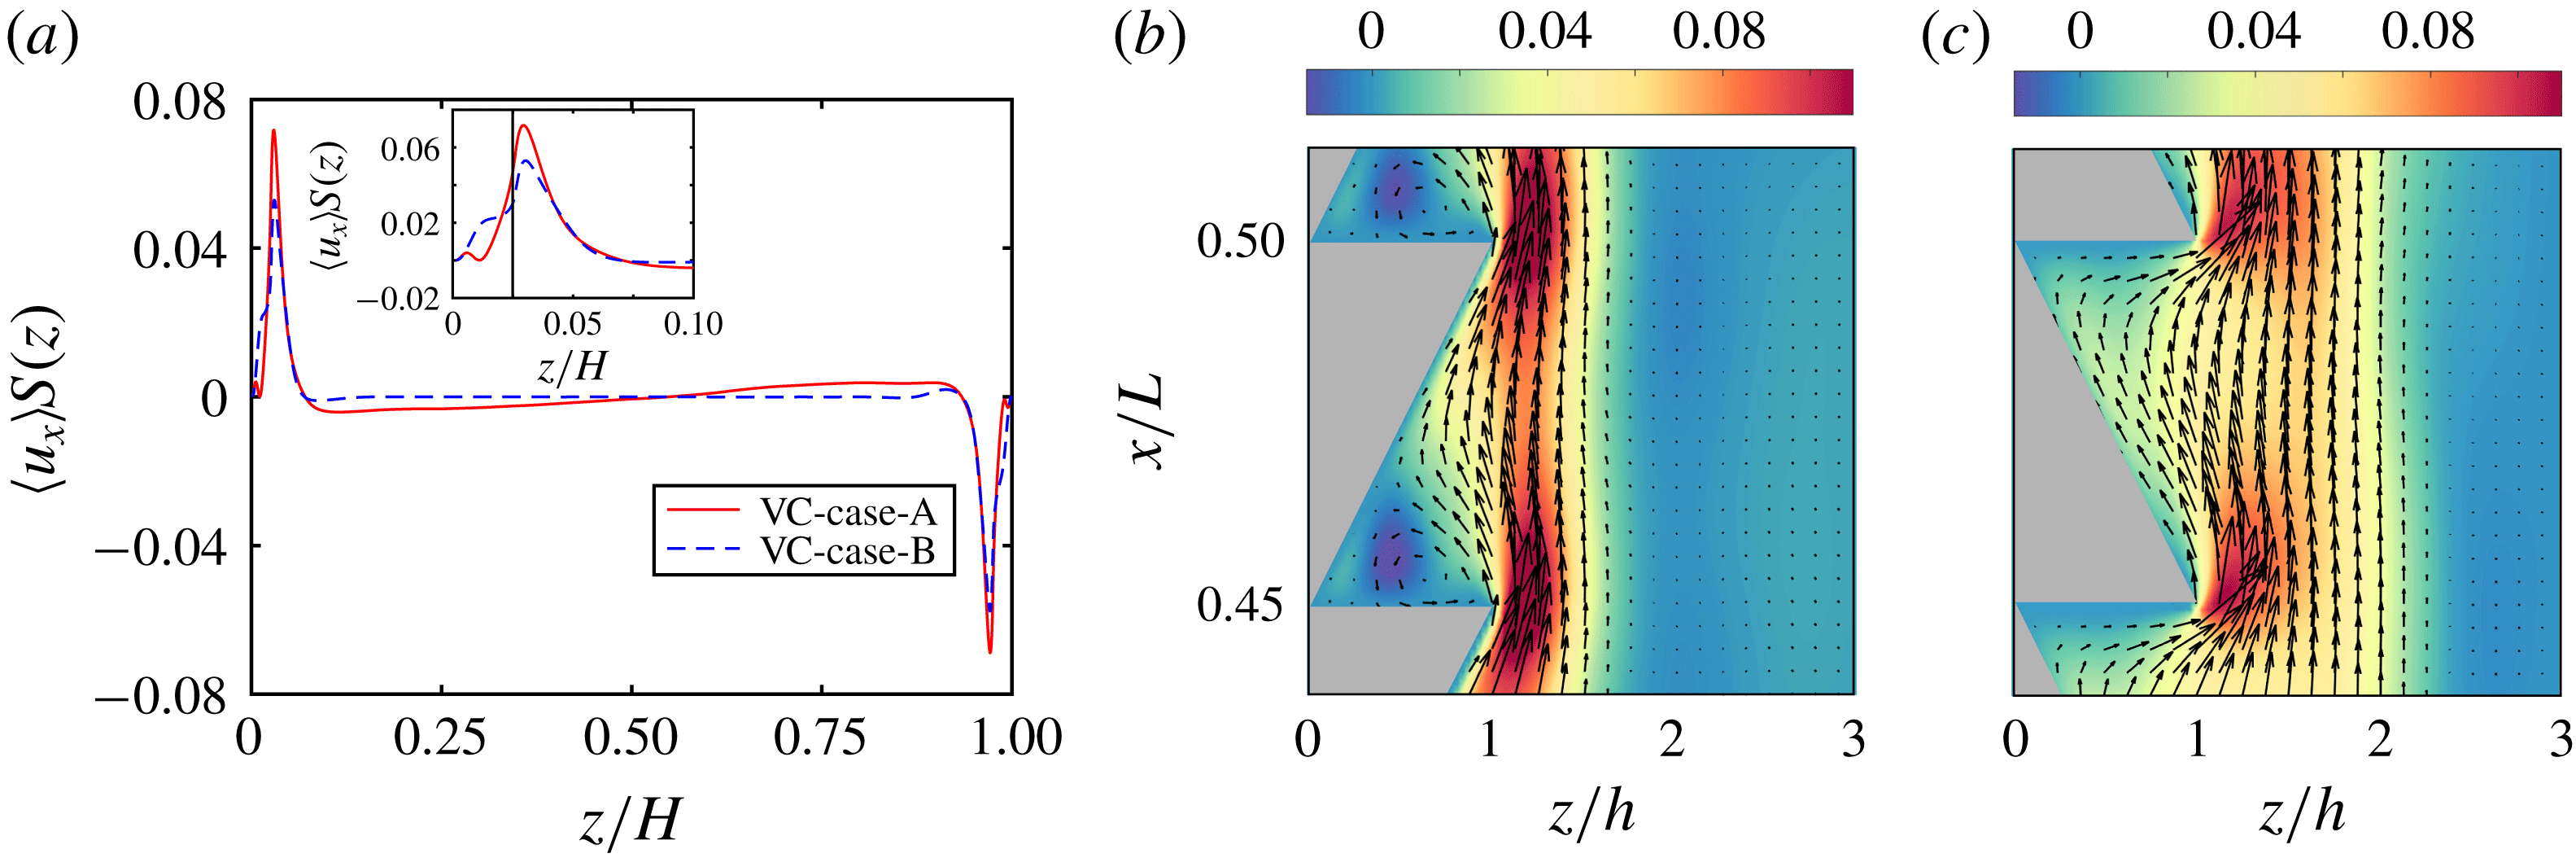
Next, we quantify the strength of the LSCR for the two cases. Figure 5(a) shows the mean dimensionless vertical velocity as a function of position
 $z/H$
. The mean vertical velocity profiles for both cases have a similar trend, with maximum values just beyond the ratchet tips. As is clear from the inset, VC-case-A has a higher maximum dimensionless mean vertical velocity
 $(\langle u_{x}\rangle _{S})_{max}(A)=0.072$
than VC-case-B, for which
 $(\langle u_{x}\rangle _{S})_{max}(B)=0.058$
. Consistent with the instantaneous vertical velocity fields, the time-averaged vertical velocity fields reveal that for VC-case-A (figure 5
b), the LSCR is stronger as compared to that for VC-case-B (figure 5
c). Furthermore, a secondary vortex flow exists in the cavity in VC-case-A, which will be discussed in § 3.3. In a word, the smaller slope of the ratchet works as an ‘accelerator’ to speed up the flow, whereas the steeper slope of the ratchet acts as a ‘brake’ to slow down the flow.
(a) The dimensionless mean vertical velocity as a function of position
 $z/H$
for VC-case-A (solid line) and VC-case-B (dashed line) at
 $Ra=5.7\times 10^{9}$
and
 $Pr=4.3$
. The inset shows an enlarged portion of the plot near the roughness elements. The black line indicates where the tips of roughness elements are. (b) Time-averaged vertical velocity fields for VC-case-A, superposed by the velocity vectors. The selected window is located at the middle of the hot plate. (c) Time-averaged vertical velocity fields for VC-case-B, superposed by the velocity vector. The selected window is located at the same place as for VC-case-A.

3.3 Properties of the temperature profiles
We discuss the temperature profiles in this section. There are several studies of the properties of the temperature profiles for turbulent thermal convection (Belmonte, Tilgner & Libchaber Reference Belmonte, Tilgner and Libchaber1994; Zhou & Xia Reference Zhou and Xia2013; Ng et al.
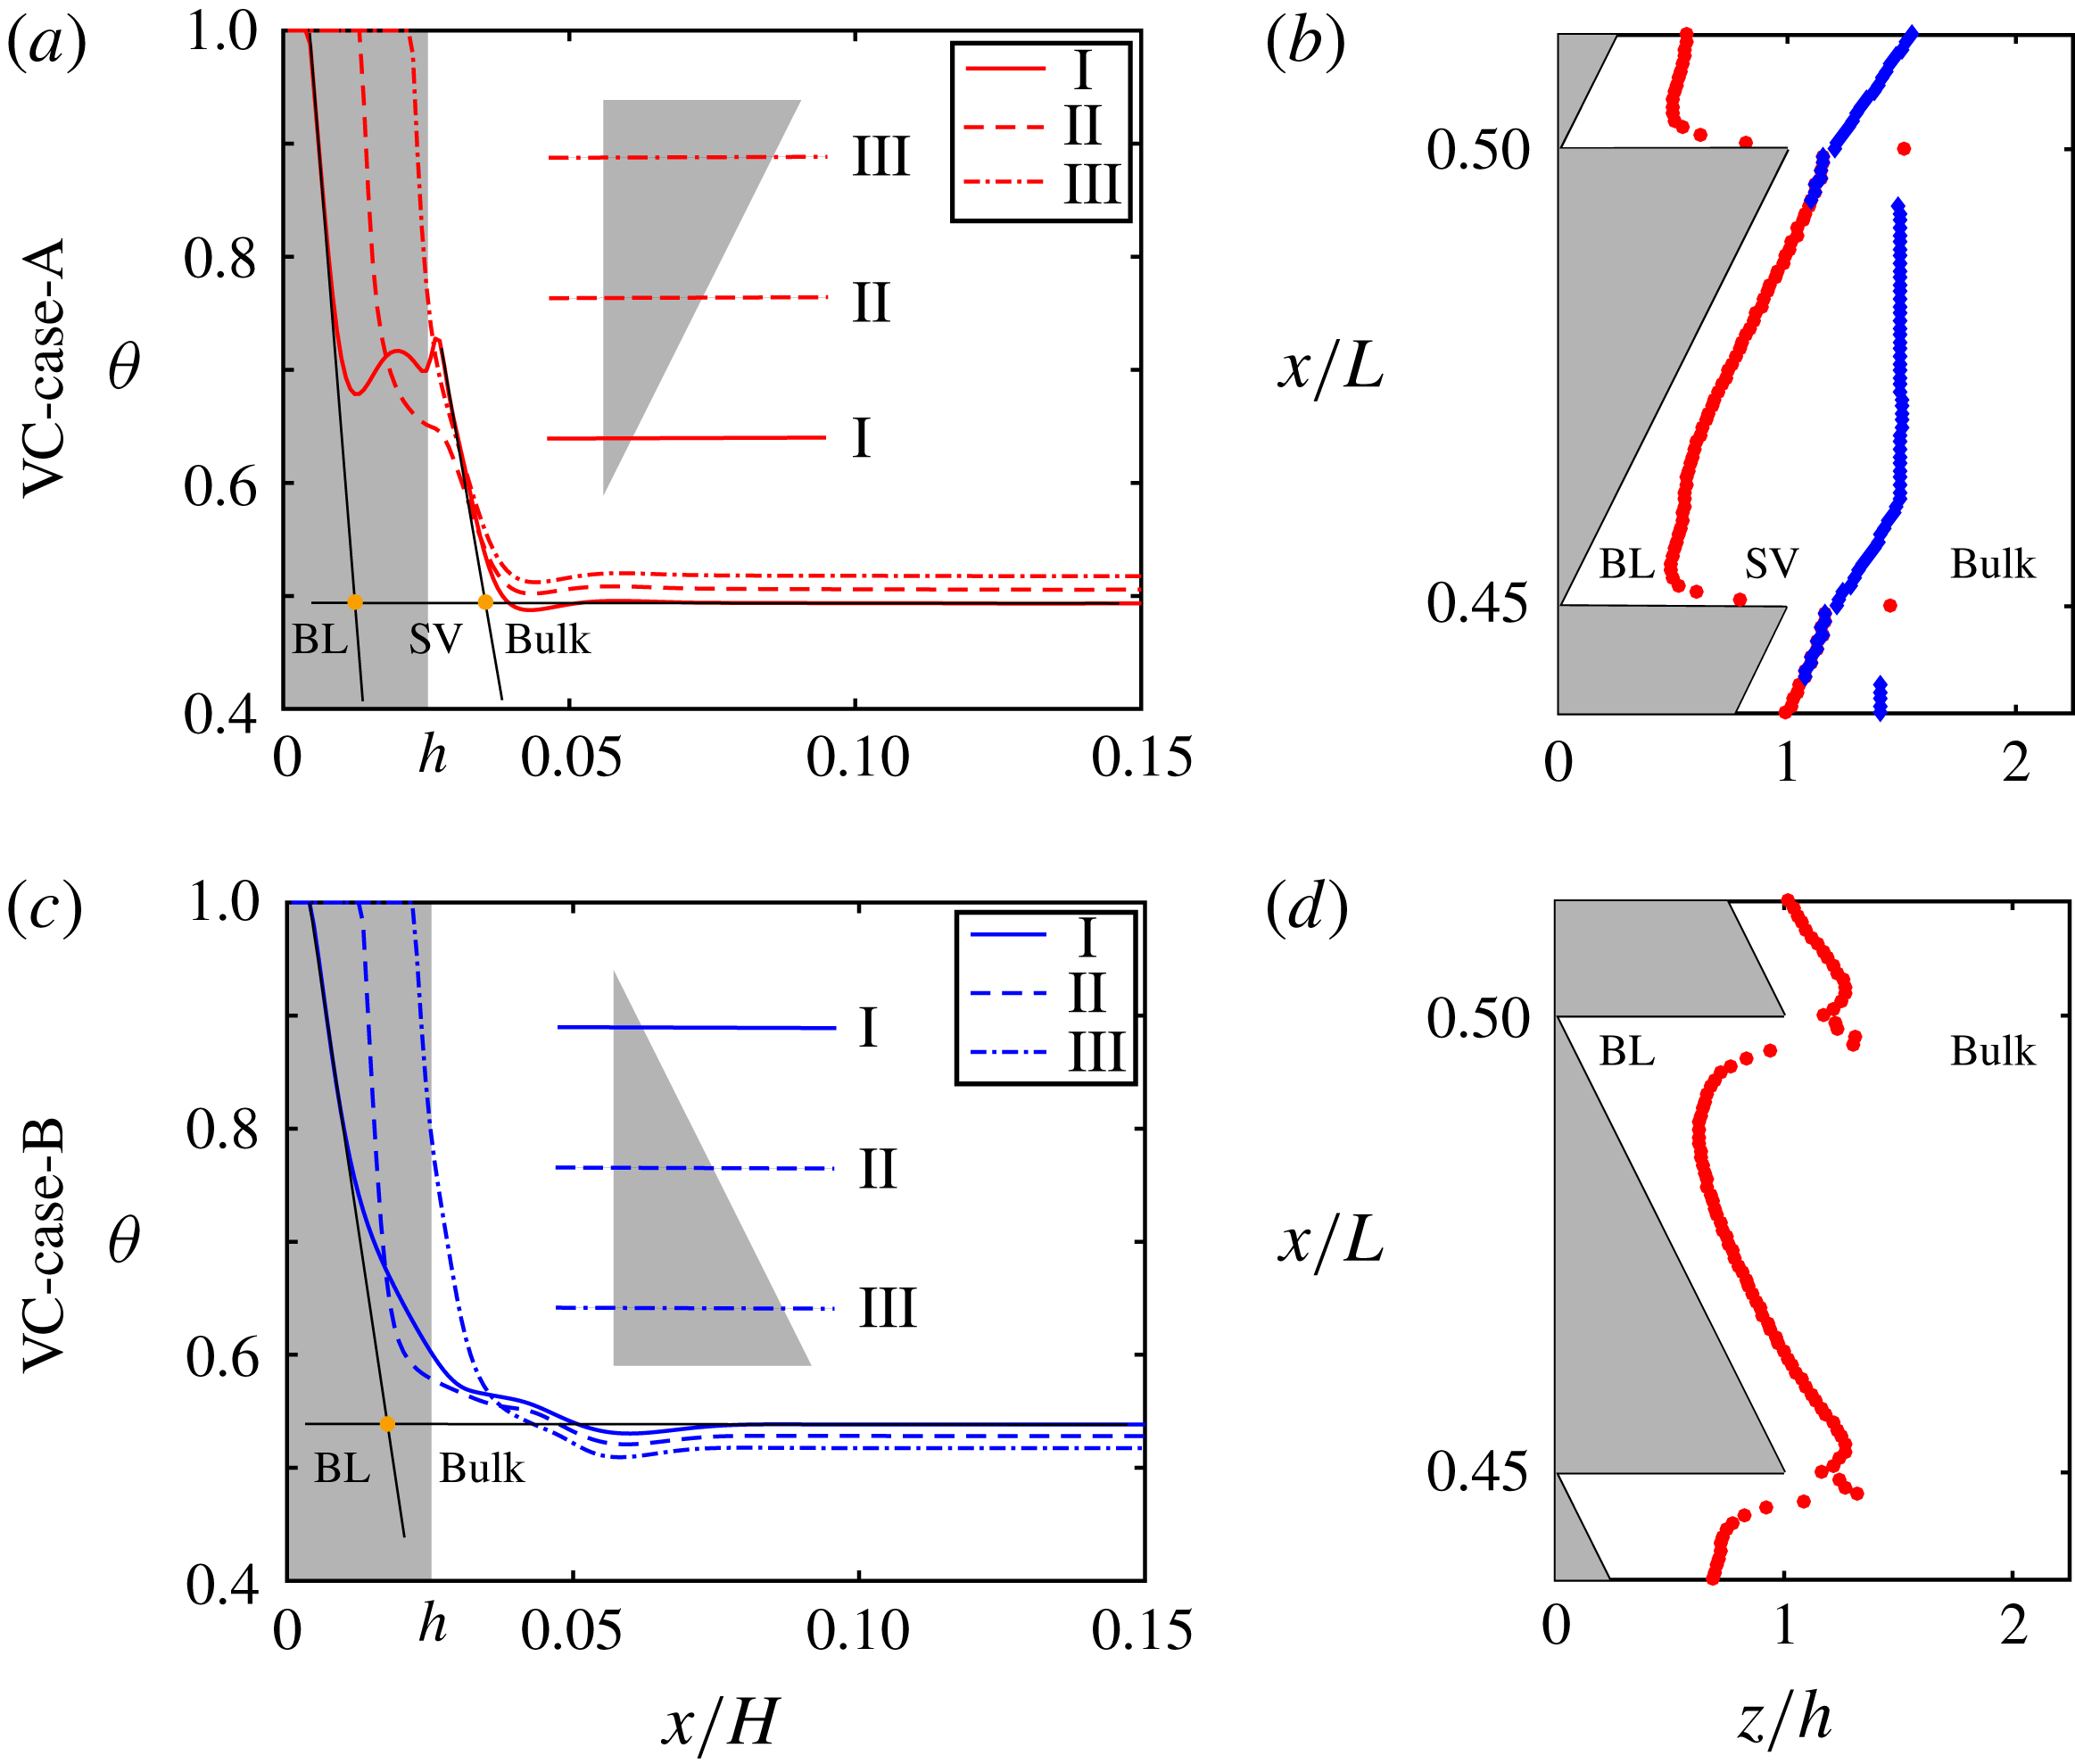
Reference Ng, Ooi, Lohse and Chung2015), which show that for smooth wall case the mean temperature profile near the plate is linear. How about the time-averaged temperature profiles in vertical convection with ratchet-shaped roughness? Here we plot the time-averaged temperature profiles for both cases A (see figure 6
a) and B (see figure 6
c) at
 $Ra=5.7\times 10^{9}$
and
 $Pr=4.3$
. The selected portions are located at the middle of the hot plate. The solid lines, dashed lines and dashed-dot lines are for the position above the valley of the ratchet, the position at the middle of the roughness and the position near the peak of the ratchet element, respectively. As shown in figure 6(a), two distinct sharp gradient regions are found in the time-averaged temperature profile for VC-case-A: the one that is very close to the plate is similar to the boundary layer of the smooth case; the other one begins from the region neighbouring the ratchet tip and ends at the edge of the bulk. Between the two sharp gradient regions lies a plateau. However, the situation is different in VC-case-B. We note that the time-averaged temperature profile for VC-case-B is similar to that for the smooth case, for which only one linear region exists in the thin layer near the hot plate.
(a,c) Profiles of the time-averaged temperature
 $\langle \unicode[STIX]{x1D703}\rangle$
from direct numerical simulations at
 $Ra=5.7\times 10^{9}$
for (a) VC-case-A and (c) VC-case-B. The selected portions are located at the middle of the hot plate. The solid lines show the data for the position above the valley of the ratchet element, the dashed lines denote the profile at the middle of the ratchet roughness and the dashed-dot lines denote the profile near the peak of the ratchet element. (b,d) The thermal boundary layer (BL) thickness (red circles) and secondary vortex zone (SV) thickness (blue diamonds) averaged in time as functions of
 $x/L$
for (b) VC-case-A and (d) VC-case-B.

To illustrate the the difference of time-averaged temperature profiles between two cases, we use the ‘slope’ method to estimate the length scale of the thermal boundary layers (Zhou & Xia Reference Zhou and Xia2013; Ng et al. Reference Ng, Ooi, Lohse and Chung2015; Zhang et al. Reference Zhang, Sun, Bao and Zhou2018). That is, the thickness of the thermal boundary is defined as the distance at which the tangent of the mean-temperature profile at the plate crosses the bulk temperature. For VC-case-A, we can define two kinds of layer thicknesses, as reported by Zhu et al. (Reference Zhu, Ostilla-Monico, Verzicco and Lohse2016) in a study of Taylor–Couette flow with grooved walls. The layer between the wall and the point where the tangent of the temperature profile at the plate crosses the bulk temperature is referred to as thermal boundary layer, while the layer between the thermal boundary layer and the point where the second ‘slope’ crosses the bulk temperature is referred to as secondary vortex zone. Beyond this is termed as the bulk zone. As is evident in figure 6(c), there is only one ‘slope’ in the time-averaged temperature profile for VC-case-B, which means that only thickness of the thermal boundary layers can be estimated.
Figure 6(b,d) shows the thickness of the thermal boundary layer (red circles) and the thickness of secondary vortex zone (blue diamonds) as functions of
 $x/L$
from mean temperature profiles. The selected windows are at the middle of the hot plates. First of all, for both cases, the ratchet-shaped roughness perturbs the thermal boundary layers, thus resulting in higher heat transfer efficiencies compared to smooth wall case. More in detail, figure 6(b) shows that three flow zones exist in VC-case-A, namely boundary layer, secondary vortex zone and bulk, as illustrated before. Due to the shear induced by the secondary vortex zone, the thermal boundary layer covers the ratchet surface uniformly in VC-case-A. However the situation is different in VC-case-B (see figure 6
d), where the horizontal part of the roughness blocks the flow, which leads to the absence of secondary vortex zone (too weak to determine). Hence, VC-case-B has a thicker thermal boundary layer than VC-case-A above the valley, which explains the weaker heat transfer for the former.
Further, considering the gradient of temperature profile at the wall, we can estimate the local
 $Nu_{r}$
based on the heat flux transported by each single roughness element (
 $J_{r}$
). Here,
 $Nu_{r}$
is defined as
 $Nu_{r}=J_{r}/(\unicode[STIX]{x1D712}~\unicode[STIX]{x1D6E5}/H)$
,
 $J_{r}=1/(W\unicode[STIX]{x1D706})~\unicode[STIX]{x1D712}\int (\unicode[STIX]{x2202}\langle \unicode[STIX]{x1D703}\rangle /\unicode[STIX]{x2202}\hat{n})\,\text{d}S$
, where
 $\hat{n}$
is the unit vector perpendicular to the surface of the ratchet elements, and the integration
 $\int (\cdot )\,\text{d}S$
is along the surface of roughness element. Due to the symmetry of the hot and cold boundaries, here we only calculate
 $Nu_{r}$
at the hot plate.
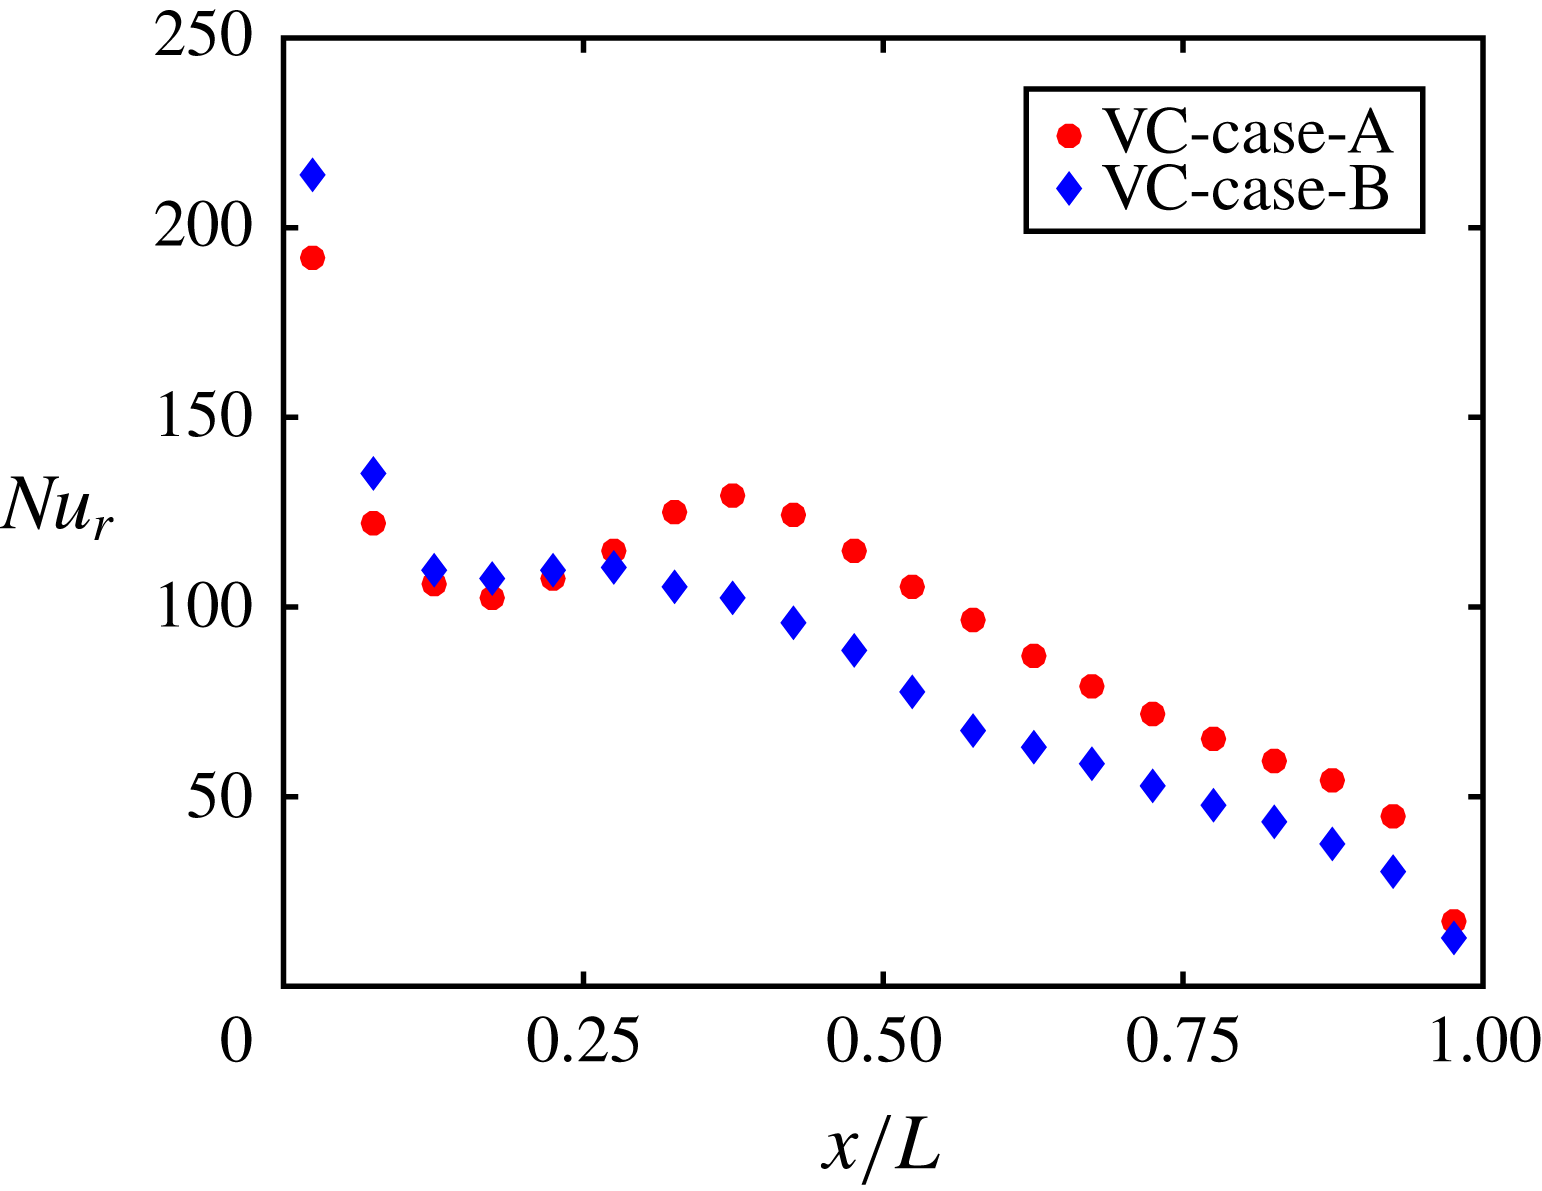
As is evident in figure 7, the local
 $Nu_{r}$
for both cases has a maximum value at the bottom of the hot plate, and then suddenly decreases with
 $x/L$
increasing. After the sudden drop, the local
 $Nu_{r}$
slightly increases with
 $x/L$
increasing, then followed by a decrease until the end. Specifically, when
 $x/L<0.25$
, the local
 $Nu_{r}$
for VC-case-B is slightly larger than that for VC-case-A, but the difference of local
 $Nu_{r}$
for the two cases is relatively small. However, as
 $x/L$
continues to increase, there is a significant difference for the local
 $Nu_{r}$
between the two cases. When
 $x/L>0.35$
, the local
 $Nu_{r}$
for VC-case-A is larger than that for VC-case-B. The higher local
 $Nu_{r}$
at the upper half part of the hot plate explains the stronger global heat transport for VC-case-A. The reason for heat flux enhancement for VC-case-A is that the flow separates from the tip of the ratchet and then reattaches at the inclined surface of the next ratchet element at the upper part of the hot plate (see figures 4
b and 5
b). As is reported in Keating et al. (Reference Keating, Piomelli, Bremhorst and Nesic2004), in a backward-facing step the peak in heat transfer occurs just upstream of the time-averaged mean reattachment location. Similarly, in VC-case-A, the cold fluid carried by separated flow impacts the surface to cool the plate, resulting in a higher local
 $Nu_{r}$
for VC-case-A.
Local
 $Nu_{r}$
at hot plate as a function of
 $x/L$
for VC-case-A (filled circles) and VC-case-B (filled diamonds), where
 $x/L$
denotes the position of each ratchet centre. The local
 $Nu_{r}$
is defined as
 $Nu_{r}=J_{r}/(\unicode[STIX]{x1D712}~\unicode[STIX]{x1D6E5}/H)$
and
 $J_{r}=1/(W\unicode[STIX]{x1D706})~\unicode[STIX]{x1D712}\int (\unicode[STIX]{x2202}\langle \unicode[STIX]{x1D703}\rangle /\unicode[STIX]{x2202}\hat{n})\,\text{d}S$
, where
 $\hat{n}$
is the unit vector perpendicular to the surface of the ratchet element and the integration
 $\int (\cdot )\,\text{d}S$
is along the surface of roughness element.

3.4 Comparisons with RBC
Finally, we present direct comparisons of the effects of ratchet structures on heat transport between VC and RBC systems. The detailed results for RBC with ratchet roughness are demonstrated in Jiang et al. (Reference Jiang, Zhu, Mathai, Verzicco, Lohse and Sun2018). Here we address that the geometry of the convection cell is identical to the VC system. A small tilt of either
 $+3.2^{\circ }$
or
 $-3.2^{\circ }$
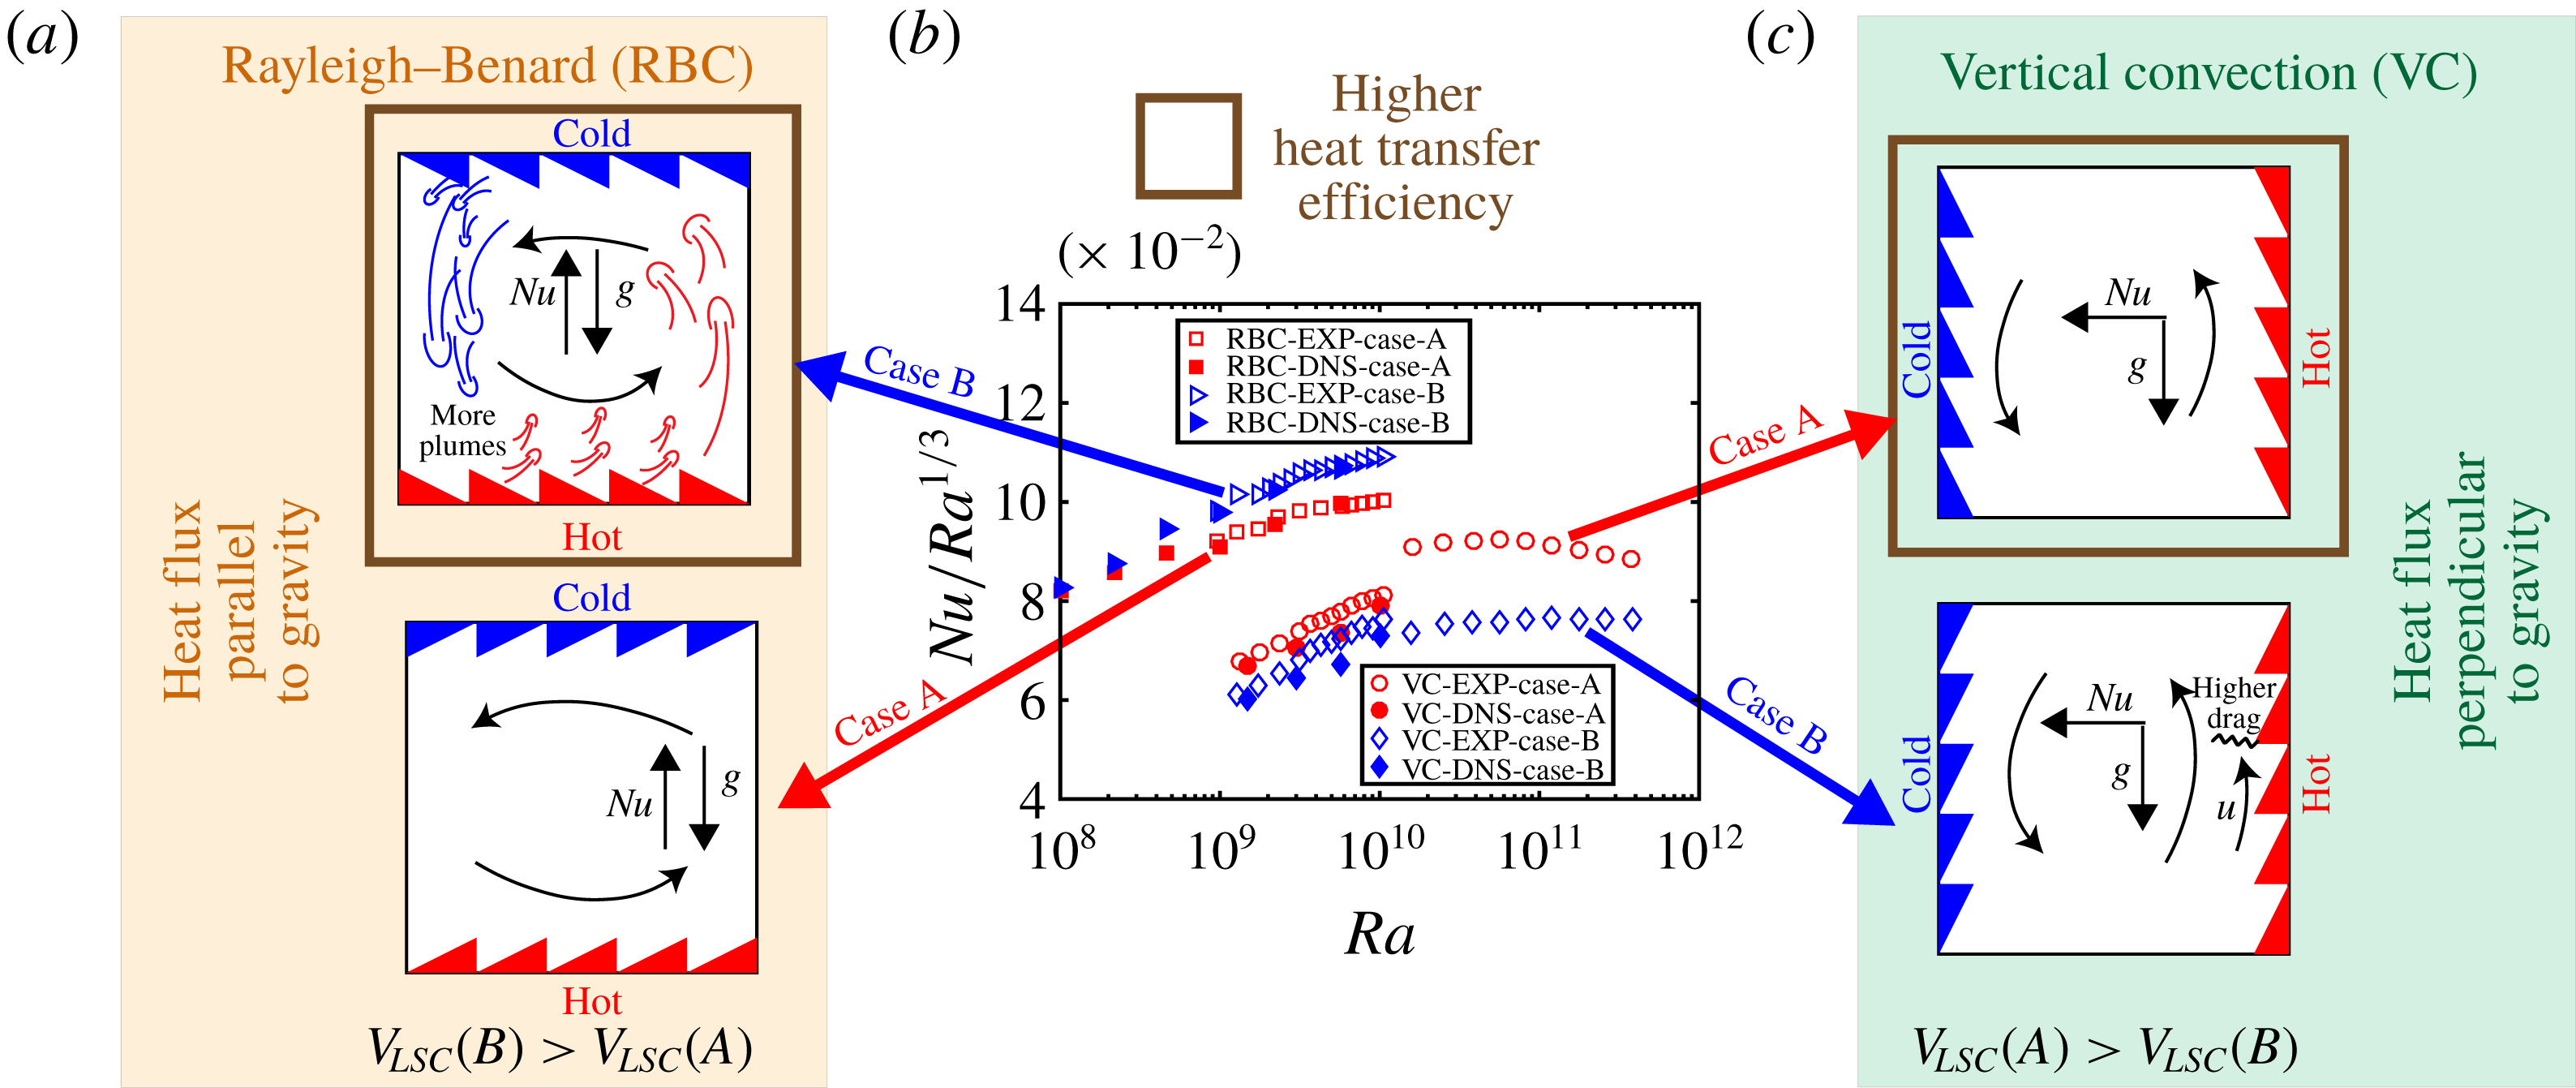
is introduced in the RBC in order to lock the direction of the LSCR to either case A or case B. Note that this hardly influences the heat transport properties in smooth RBC (Ciliberto, Cioni & Laroche Reference Ciliberto, Cioni and Laroche1996). Similar to the definition of those cases in VC, the configurations are classified into two cases. When the flow near the top and bottom plates moves along the smaller slope side of the ratchets, we refer to this situation as RBC-case-A (bottom panel of figure 8
a). Conversely, when the flow near the top and bottom surfaces is directed towards the sharp corners of the ratchet, the configuration is referred to as RBC-case-B (top panel of figure 8
a).
Figure 8(b) shows the compensated plot of
 $Nu/Ra^{1/3}$
versus
 $Ra$
for both VC and RBC with ratchets. Most prominently, we notice that RBC has a higher heat transport efficiency than VC for the same box and the same temperature difference. This is because the flow is stronger when gravity is aligned with the temperature gradient than that when it is orthogonal. However, interestingly, RBC-case-B has a higher heat transport efficiency than RBC-case-A. In contrast,
 $Nu$
enhancement in VC-case-A is larger than that in VC-case-B. What causes these differences in the trends of heat transfer augmentation between RBC and VC?
(a) Sketch of flow structures in RBC with ratchet-like roughness on the horizontal walls, which shows the process of plume emission. (b) The compensated plots of
 $Nu$
with
 $Ra$
for RBC and VC with ratchet-like roughness on hot and cold plates. The data for RBC are from Jiang et al. (Reference Jiang, Zhu, Mathai, Verzicco, Lohse and Sun2018). (c) Sketch of flow structures in VC with the ratchet-like roughness on the vertical walls, which shows the process of blocking the flow.

The reason for the highest heat flux in RBC-case-B is connected to the plume emissions (Jiang et al.
Reference Jiang, Zhu, Mathai, Verzicco, Lohse and Sun2018). In RBC, gravity is parallel to the direction of heat flux. When the flow near the wall hits the sharp corners of the ratchet, a large number of plumes are detached from the boundary layer to the bulk fluid. These low-density plumes are aided by buoyancy, since in RBC the buoyancy is directed along the direction of heat flux. This explains the higher
 $Nu$
enhancement for RBC-case-B over RBC-case-A. By means of quantitatively studying the plume emissions, we found (Jiang et al.
Reference Jiang, Zhu, Mathai, Verzicco, Lohse and Sun2018) that RBC-case-B has the largest number of plume emissions, followed by RBC-case-A and RBC-smooth. Further, we examine the velocity of the LSCR for RBC-case-A and RBC-case-B. It is shown that RBC-case-B has a larger roll velocity,
 $V_{LSC}(B)=0.129$
, than RBC-case-A, for which
 $V_{LSC}=0.117$
. Here
 $V_{LSC}$
is defined as
 $V_{LSC}=(\langle u_{x}\rangle _{S})_{max}$
, where
 $x$
denotes the direction parallel to gravity in RBC. Indeed in RBC, the plume emissions drive the formation of the LSCR, and more plumes not only contribute to a stronger LSCR, but also to a larger heat flux.
Unlike RBC, in VC (see figure 8
c) the buoyancy of the plumes is parallel to the large-scale flow near the heating and cooling plates. Therefore under the effect of the buoyancy, the plumes move along the plates and do not separate. Since the flow in VC-case-B (bottom panel of figure 8
c) has to move against the steeper slope side of the ratchet elements, it faces strong hindrance, which results in a weaker LSCR than in VC-case-A (top panel of figure 8
c). However in RBC, instead, the buoyancy is perpendicular to the hot and cold walls. Hence the buoyancy helps the plumes flow away from the plates, resulting in plume emissions from thermal boundary to the bulk. Therefore, the ratchets serve different functions in RBC and VC. While in RBC they are the origin of strong plume emissions, in VC their role is mainly to hinder the LSCR. This, in the asymmetric ratchet cases, leads to different
 $Nu$
enhancements between RBC and VC.
4 Conclusions
We have conducted a systematic experimental and numerical exploration of turbulent VC with asymmetric ratchet-like rough walls. Convective heat transport measurements and flow visualizations are performed in the VC system, and the results are compared with RBC. The measured heat transport efficiency in the rough cell is found to be higher than that in the smooth cell in VC. We have identified two flow configurations, namely case A where the LSCR sweeps along the smaller slope side of the ratchet surfaces, and case B where the LSCR is directed against the steeper slope of the ratchets. The
 $Nu$
enhancement is sensitive to the direction of LSCR over the asymmetric surface structures, i.e. VC-case-A has a higher
 $Nu$
enhancement than VC-case-B. The measured wind Reynolds number shows that VC-case-A has a strong LSCR. In contrast, the ratchet elements in VC-case-B hinder the formation of LSCR, resulting in a weaker large-scale circulation flow. The mean vertical velocity profiles obtained from the numerical simulations quantitatively validate this interpretation. A closer analysis of mean temperature profiles indicates that the stronger LSCR in VC-case-A triggers the formation of a secondary vortex, which promotes fluid mixing inside the roughness cavity. Thus, a stronger and more efficient convective roll explains the higher
 $Nu$
enhancement in VC-case-A than that in VC-case-B.
Further, we compare the effects of asymmetric ratchets on heat transport between two convection systems of VC and RBC. In contrast to the trend observed for VC, the
 $Nu$
enhancement in RBC-case-B exceeds that in RBC-case-A. This is connected to the dynamics of plume emissions. In RBC-case-B, the flow near the wall hits the sharp corners of ratchet elements and leads to a greater number of plume emissions from the boundary layer to the bulk, resulting in a larger heat transfer.
This comparative study of two canonical natural convection systems, VC and RBC, has provided an improved understanding of how asymmetric wall roughness affects flow structures in varied ways to alter the global heat transport. Our findings are relevant to a range of atmospheric, oceanic and geophysical flows, as well as to engineering applications of heat exchange and flow control.
Acknowledgements
This work was supported by the Natural Science Foundation of China under grant nos. 91852202 and 11861131005, and by NWO within the programme ‘Towards Ultimate Turbulence’ and by MCEC programme.
Supplementary movies
Supplementary movies are available at https://doi.org/10.1017/jfm.2019.446.