Lexical stress is a type of prosody that is used in languages such as English to contrast strong and weak syllables within polysyllabic words (e.g., a word such as ‘zebra’ is produced with a strong initial syllable followed by a weak syllable – this pattern is reversed in a word such as ‘giraffe’). It has been reported that children with autism spectrum disorders (ASD) have difficulties with perception and production of prosody including lexical stress (see review by Arciuli, Reference Arciuli, Arciuli and Brock2014). However, speech production studies have seldom utilised acoustic analyses. Judging the magnitude of stress contrastivity by ear is a challenging task, one that is perhaps better accomplished via objective acoustic analyses that enable quantification of stress contrastivity. As far as we are aware, no previous study comparing children with and without ASD has examined the amount of contrast produced across strong and weak syllables within words that begin with different patterns of lexical stress: a strong–weak pattern (SW) versus a weak–strong pattern (WS). In the current study we explored stress contrastivity in children with ASD versus typically developing (TD) children group-wise matched on age and vocabulary. We used the same methodology reported in recent studies of TD individuals that analysed stress contrastivity acoustically (Arciuli & Ballard, Reference Arciuli and Ballard2017; Arciuli & Colombo, Reference Arciuli and Colombo2016; Ballard, Djaja, Arciuli, James, & van Doorn, Reference Ballard, Djaja, Arciuli, James and van Doorn2012).
Acoustic studies of stress contrastivity in typically developing children
The ability to produce stress contrastivity emerges during infancy (Davis, MacNeilage, Matyear, & Powell, Reference Davis, MacNeilage, Matyear and Powell2000). By the time children become toddlers at around two to three years they use contrasting vowel duration across strong and weak syllables in their word productions, although without adult-like intentional control (Kehoe, Stoel-Gammon, & Buder, Reference Kehoe, Stoel-Gammon and Buder1995; Pollock, Brammer, & Hageman, Reference Pollock, Brammer and Hageman1993).
There have been only a handful of acoustic studies on the developmental trajectory of children's production of lexical stress, and few have measured the amount of contrast across vowels within adjacent syllables in words/nonwords that have different patterns of lexical stress. Schwartz, Petinou, Goffman, Lazowski, and Cartusciello (Reference Schwartz, Petinou, Goffman, Lazowski and Cartusciello1996) analysed the production of two-syllable nonwords by TD children at two years of age. Nonwords were constructed so that there was a SW version as well as a WS version, and these were introduced as labels for novel objects during play. Acoustic analyses of syllable duration, vowel duration, peak intensity, and peak fundamental frequency were undertaken for each nonword production, enabling the calculation of ratios of unstressed to stressed syllables. The results revealed that children produced contrastive stress in both SW and WS contexts, although not in an adult-like manner. Children exhibited a smaller amount of stress contrastivity than adults during their speech production.
Another relative measure of stress contrast is the normalised Pairwise Variability Index (PVI: Low, Grabe, & Nolan, Reference Low, Grabe and Nolan2000). It is useful beyond its original use in analysing vowel duration, in order to examine stress contrast in terms of intensity and fundamental frequency as well as duration. The normalised PVI was used in an acoustic study by Ballard et al. (Reference Ballard, Djaja, Arciuli, James and van Doorn2012) which reported on stress contrastivity in the word productions of TD children aged three to seven years and adults. A picture naming task included two targets that began with a SW pattern of lexical stress over the initial syllables (‘caterpillar’ and ‘butterfly’) and two targets that began with a WS pattern of lexical stress (‘potato’ and ‘tomato’). Results indicated that children use adult-like contrastivity in their production of SW words. By comparison, even when productions were unequivocally rated as correct via perceptual judgements, acoustic analyses revealed that children's stress contrastivity in their production of WS words was not adult-like. Arciuli and Ballard (Reference Arciuli and Ballard2017) extended this study by examining production of the same words by eight- to eleven-year-olds. Acoustic analyses revealed that while children of this age are more adult-like in the stress contrastivity they produce in WS words than three- to seven-year-olds, there were still differences in the way stress contrastivity was realised.
Broadly speaking, such findings suggest a protracted developmental trajectory for lexical stress production. Indeed, it has been suggested that speech motor development proceeds over many years, continuing even into early adolescence (Lee, Potamianos, & Narayanan, Reference Lee, Potamianos and Narayanan1999; Singh & Singh, Reference Singh and Singh2008; Smith, Reference Smith2006). More specifically, these different trajectories for the production of words beginning with a SW pattern and words beginning with a WS pattern may reflect factors relating to practice. An initial strong syllable is the dominant pattern for all English words and is the dominant pattern when it comes to nouns (Arciuli & Cupples, Reference Arciuli and Cupples2004, Reference Arciuli and Cupples2006). As a result, English-speaking children have less exposure to WS patterning and have less practice producing it. In addition, producing a WS pattern may be more physiologically demanding for children. Some reasons for this include the possibility that controlling a rising contour may be challenging (Sundberg, Reference Sundberg1979). Controlling the production of brief vowels in words with an initial weak syllable may also present challenges (e.g., Allen & Hawkins, Reference Allen, Hawkins, Yeni-Komshian, Kavanagh and Ferguson1980, but see Vihman, DePaolis, & Davis, Reference Vihman, DePaolis and Davis1998). See DePaolis, Vihman, and Kunnari (Reference DePaolis, Vihman and Kunnari2008) for further discussion of such constraints on children's speech production.
The production of stress contrastivity has been examined in languages other than English. For example, Arciuli and Colombo (Reference Arciuli and Colombo2016) conducted an acoustic study of Italian-speaking children's productions of trisyllabic words beginning with a SW or a WS pattern over the initial syllables. Results revealed that, unlike English-speaking children, young Italian-speaking children were adult-like in the way they produced stress contrastivity for the majority of trisyllabic WS words. Arciuli and Colombo argued that, as an initial weak syllable is the dominant pattern in trisyllabic Italian words, children have more practice with this pattern, which may enable them to overcome any physiological issues. There are ways to explore the possibility that WS productions may be more challenging than SW productions aside from cross-linguistic studies comparing TD children and healthy adults. One option is to investigate SW and WS productions in children with ASD versus typical peers. Atypical prosody, including atypical lexical stress, has long been reported in ASD.
Acoustic studies of stress contrastivity in children with autism spectrum disorders
As noted in the review by Arciuli (Reference Arciuli, Arciuli and Brock2014), the expressive prosody of individuals with ASD is highly variable, having been described as “monotonic, sing-song-like, robotic, parroted, machine-like, odd, over-exaggerated, and/or stilted” (Järvinen-Pasley, Peppé, King-Smith, & Heaton, Reference Järvinen-Pasley, Peppé, King-Smith and Heaton2008, p. 1328). While not all individuals with ASD exhibit atypical prosody, such atypicalities have been reported across the autism spectrum, including in individuals who are high-functioning (Peppé, McCann, Gibbon, O'Hare, & Rutherford Reference Peppé, McCann, Gibbon, O'Hare and Rutherford2007; Shriberg, Paul, McSweeny, Klin, Cohen, & Volkmar, Reference Shriberg, Paul, McSweeny, Klin, Cohen and Volkmar2001). It has been noted that atypical prosody is early appearing (Paul, Fuerst, Ramsay, Chawarska, & Klin, Reference Paul, Fuerst, Ramsay, Chawarska and Klin2011; Wetherby, Woods, Allen, Cleary, Dickinson, & Lord, Reference Wetherby, Woods, Allen, Cleary, Dickinson and Lord2004). Moreover, there have been reports that atypical prosody may persist even after other aspects of speech and language have begun to improve (e.g., DeMyer, Barton, DeMyer, Norton, Allen, & Steele, Reference DeMyer, Barton, DeMyer, Norton, Allen and Steele1973; Simmons & Baltaxe, Reference Simmons and Baltaxe1975). With regard to speech production, in particular, some previous research has found evidence of atypical production of lexical stress in individuals with ASD (Kargas, López, Morris, & Reddy, Reference Kargas, López, Morris and Reddy2016; McAlpine, Plexico, Plumb, & Cleary, Reference McAlpine, Plexico, Plumb and Cleary2014; Paul, Augustyn, Klin, & Volkmar, Reference Paul, Augustyn, Klin and Volkmar2005), while other research has not (Shriberg et al., Reference Shriberg, Paul, McSweeny, Klin, Cohen and Volkmar2001). None of these studies of lexical stress included acoustic analyses.
A study by Grossman, Bemis, Plesa Skwerer, and Tager-Flusberg (Reference Grossman, Bemis, Plesa Skwerer and Tager-Flusberg2010) investigated perception and production of prosody in 16 children with ASD versus 15 TD peers. Participants were seven to eighteen years of age. These researchers did utilize acoustic analyses when examining speech production and did use some stimuli that related to lexical stress. However, these stimuli included noun phrases (‘a hot DOG’) and compound nouns (‘HOTdog’) and their acoustic measures related to whole words rather than syllables comprising words/nonwords. As such, the study is not relevant to our focus on the relative change in stress contrast across adjacent syllables. In a study that did report acoustic data on stress contrastivity by measuring individual syllables, Paul, Bianchi, Augustyn, Klin, and Volkmar (Reference Paul, Bianchi, Augustyn, Klin and Volkmar2008) elicited utterances using the Tennessee Test of Rhythm and Intonation Patterns (T-TRIP: Koike & Asp, Reference Koike and Asp1981). This test requires participants to imitate prerecorded utterances that utilise sequences of the nonsense syllable /ma/. Participants were 46 individuals with ASD and 20 control participants (age range 7 to 28 years). Paul et al. (Reference Paul, Bianchi, Augustyn, Klin and Volkmar2008) found modest group differences in terms of acoustic measures of syllable duration (note that they measured the entire syllable rather than focusing only on vowels). Strong syllables were longer than weak syllables but this difference was greater in the TD group by comparison with the ASD group. Van Santen, Prud'Hommeaux, Black, and Mitchell (Reference Van Santen, Prud'Hommeaux, Black and Mitchell2010) also explored stress contrastivity via acoustic data. Like Paul et al. (Reference Paul, Bianchi, Augustyn, Klin and Volkmar2008) they utilised an imitation task, where children repeated two-syllable nonsense words. Participant numbers varied from 23 to 26 TD children (mean age of 6.35) and 24 to 26 children with ASD (mean age of 6.57), depending on the analyses. Results suggested that individuals with ASD may exhibit an atypical balance of acoustic features associated with stress contrastivity.
Van Santen et al. (Reference Van Santen, Prud'Hommeaux, Black and Mitchell2010) did not offer reasons why children with ASD might produce lexical stress differently from their typical peers. Paul et al. (Reference Paul, Bianchi, Augustyn, Klin and Volkmar2008) did discuss possible reasons including “underlying difficulty in the perceptual and/or motor apparatus involved in speech production.” (p. 120). However, an important consideration in both studies is that nonsense utterances and nonsense words were elicited using imitation. When imitated productions are elicited it is more difficult to separate perceptual and motor influences on participant responding. As such, it is valuable to use non-imitation methods such as picture naming in order to look more closely at speech production that is not immediately preceded by speech perception. Moreover, we were especially interested in comparing stress contrastivity in SW versus WS patterns in children with and without ASD, something which has not been examined in any previous studies that we know of.
The current study
We conducted an acoustic investigation of stress contrastivity in real word productions elicited via picture naming in children with and without ASD. We followed the direction of recent acoustic studies undertaken with TD children that examined stress contrastivity in words with different patterns of lexical stress (words beginning with a SW pattern versus words beginning with a WS pattern). We hypothesised that if children with ASD struggle with stress contrastivity more than their typical peers we might be more likely to see evidence of this in WS productions. As the non-dominant pattern in English there is less opportunity to practise the WS pattern, which may also be associated with unique physiological challenges for children. Production of WS words may reflect speech motor practice/control issues more than the production of SW words.
Method
We used the same four stimuli, the same picture naming elicitation task, and the same acoustic measures employed by Ballard et al. (Reference Ballard, Djaja, Arciuli, James and van Doorn2012) and Arciuli and Ballard (Reference Arciuli and Ballard2017) in their studies of TD children. The data reported here are a subset of data collected as part of larger studies.
Participants
Speech production data from 40 Australian English-speaking children were collected. Data collection was approved by the Human Research Ethics Committee at The University of Sydney and written informed consent was obtained from parents of the child participants.
Twenty children had received a diagnosis of ASD (2 females, M = 88.55 months) and 20 children were typically developing (2 females, M = 86.55 months). The sample of children with ASD were previously described in studies by Bailey, Arciuli, and Stancliffe (Reference Bailey, Arciuli and Stancliffe2017a, Reference Bailey, Arciuli and Stancliffe2017b). These children were recruited from speech pathology and psychology clinics in a large metropolitan area. Before joining our study, children had received a prior clinical diagnosis of ASD, Asperger's syndrome, or pervasive developmental disorder – not otherwise specified using criteria from the Diagnostic and Statistical Manual of Mental Disorders – 4th edition (American Psychiatric Association, 2000). While we did not confirm diagnosis during our study we did collect data on children's adaptive abilities using the Vineland Adaptive Behaviour Scales – 2nd edition (VABS-2; Sparrow, Cicchetti, & Balla, Reference Sparrow, Cicchetti and Balla2005). Consistent with previous research involving children with ASD (e.g., Carter et al., Reference Carter, Volkmar, Sparrow, Wang, Lord, Dawson and Schopler1998; Perry, Flanagan, Geier, & Freeman, Reference Perry, Flanagan, Geier and Freeman2009; Volkmar, Sparrow, Goudreau, Cicchetti, Paul, & Cohen, Reference Volkmar, Sparrow, Goudreau, Cicchetti, Paul and Cohen1987), age-based percentile rank scores for participants in the current study showed considerable deficits in the domain of socialisation (M = 13.14, SD = 23.94) relative to daily living skills (M = 23.56, SD = 22.66).
The 20 TD children were drawn from a larger pool of TD children so as to provide a comparison group that was group-wise matched to the ASD group in terms of age and receptive vocabulary (see ‘Results’).
Test of vocabulary
The Peabody Picture Vocabulary Test – 4th edition (PPVT-4: Dunn & Dunn, Reference Dunn and Dunn2007) was used to assess receptive vocabulary in order to allow us to group-wise match our children with ASD with TD peers. The test requires participants to select one of four images that corresponds with a target spoken by the researcher.
Stimuli for speech production
Targets were four highly familiar words which were similar in terms of phonological structure over the first two syllables (i.e., CVCV). This enabled easy identification of vowel onsets and offsets for measuring vowel durations. Children viewed a picture of each target and were asked to name it (‘butterfly’, ‘caterpillar’, ‘tomato’, ‘potato’). The naming task was performed twice while children were wearing a headset microphone at 10 cm mouth–microphone distance. Speech was recorded using a hand-held recorder (44 kHz sampling rate, 16 bit).
Perceptual and acoustic measures
As described in earlier studies by Ballard et al. (Reference Ballard, Djaja, Arciuli, James and van Doorn2012) and Arciuli and Ballard (Reference Arciuli and Ballard2017), we first determined correct versus incorrect production of the target words. Next, acoustic analysis of only correct productions was made with PRAAT (V5.2.0.1: Boersma & Weenink, Reference Boersma and Weenink2010). Waveforms and wide band spectrograms (300 Hz bandwidth) were generated for each word production. Acoustic measurements for the first two vowels of each target were: (1) vowel duration (msec) as measured from onset to offset for the first vowel (V1) and the second vowel (V2), as well as (2) peak vocal intensity (dB), and (3) peak f 0 (Hz) for V1 and V2. These measurements allowed us to calculate PVI values for duration, intensity, and f 0 for each word production. The PVI is the normalised difference between the first two vowels within a word: PVI_a = 100 x {(a1-a2)/[(a1+a2)/2]} where a1 and a2 are measures of duration, peak intensity, or peak f0 of the first and second vowels, respectively. A positive PVI indicates first-syllable stress while a negative PVI indicates second-syllable stress. The larger the numerical value of the PVI, be it positive or negative, the greater the level of stress contrastivity.
These PVI values were averaged across the two productions of the same word in order to create six grand PVI values for each child: PVI_ SW_duration, PVI_ SW_intensity, and PVI_ SW_ f 0 (for ‘butterfly’, ‘caterpillar’) and PVI_WS_duration, PVI_ WS_intensity, and PVI_ WS_ f 0 (for ‘tomato’, ‘potato’).
Results
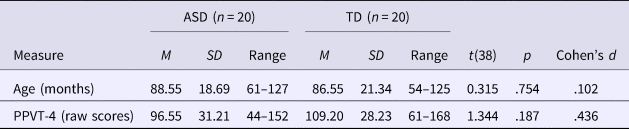
Descriptive statistics relating to age and receptive vocabulary as measured using raw scores from the PPVT-4 (Dunn & Dunn, Reference Dunn and Dunn2007) for each group of children are provided in Table 1. As can be seen, independent samples t-tests showed no statistically significant differences in age or receptive vocabulary raw scores for children with ASD and TD children. In terms of comparison with the normative data in the test manual, our children with ASD tended to achieve age-based receptive vocabulary percentile rank scores on the PPVT-4 which were lower than the normative average of 50. However, the group mean was still within 1 SD of this average (M = 27.42, SD = 24.53, range = 0.30–79). This is consistent with previous research showing that receptive language, including receptive vocabulary, can be an area of relative weakness for some individuals on the autism spectrum (e.g., Kover, McDuffie, Hagerman, & Abbeduto, Reference Kover, McDuffie, Hagerman and Abbeduto2013).
Descriptive Statistics for Age and PPVT-4 Scores for ASD And TD Groups

Perceptual and Acoustic Measures
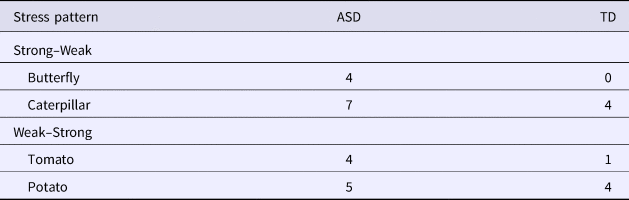
Of the possible 320 word productions (8 productions for each of 40 children), 29 productions (9.06%) were excluded from acoustic analysis due to error (12.50% of productions from children with ASD and 5.63% of productions from TD peers). Most production errors reflected substitution of phonemes (‘calerpillar’ for ‘caterpillar’). A small number of errors reflected weak syllable deletion (e.g., ‘tato’ for ‘potato’). Table 2 displays these errors.
Number of Production Errors by Word and Group

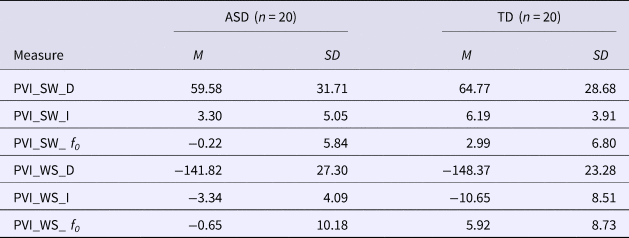
Table 3 displays the mean PVI values for SW and WS productions. As expected, the PVIs for SW words were generally positive (reflecting first-syllable stress), while the PVIs for WS words were generally negative (reflecting second-syllable stress). Means indicated that for each dependent variable children with ASD produced less stress contrastivity than TD children.
Mean PVIs and Standard Deviation for SW Words and WS Words for Both Groups

Notes. PVI: pairwise variability index; SW: strong–weak pattern (BUtterfly, CAterpillar), WS: weak–strong (poTAto, toMAto); D: duration; I: intensity; f 0 : fundamental frequency.
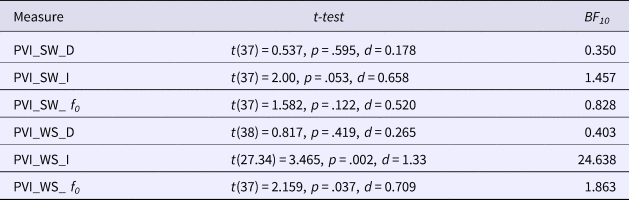
A series of six independent t-tests were conducted with a Bonferroni-corrected alpha of .008. The assumption of equal variances was met for all of these tests except for the dependent variable of PVI_WS_intensity, where we reverted to t-test results where equal variances was not assumed (see adjusted df). Table 4 shows the results of these t-tests. All differences between the ASD and TD groups were statistically non-significant with the exception of the test examining PVI_WS_intensity, which indicated that children with ASD produced less stress contrastivity than their TD peers. Bayesian analyses using JASP with default priors (JASP Team, 2018), too, revealed little evidence to support a difference between the groups across these variables with the exception of PVI_WS_intensity, where there was strong evidence of a group difference (BF10 = 24.638).
Results of t-tests for All Dependent Variables

Discussion
We conducted an acoustic investigation of stress contrastivity in real word productions elicited via a picture naming task in children with and without ASD. Following recent acoustic studies of TD individuals, we examined stress contrastivity in words with different patterns of lexical stress: words beginning with a SW pattern versus words beginning with a WS pattern. We hypothesised that if children with ASD have more difficulties with stress contrastivity by comparison with typical peers we might be more likely to see evidence of this in their WS productions. For speakers of English, there is less opportunity to practise the non-dominant WS pattern which may be associated with unique physiological challenges for children. Thus, WS word production, in particular, may reflect speech motor control/practice issues more so than the production of SW words when it comes to speakers of English.
The findings provided some support for our hypothesis that there may be subtle acoustic differences in the way that children with and without ASD realise stress contrastivity in their production of WS words but not SW words. Children with ASD tended to produce less contrastivity in their production of WS words by comparison with typical peers. In particular, there was a statistically significant group difference in the amount of stress contrastivity produced in WS words in terms of the relative change in intensity across the initial two syllables, accompanied by a large effect size. We acknowledge debate about whether a Bonferroni adjustment for multiple comparisons might be considered conservative but feel that our approach provides an appropriate consideration of the possibility of Type I and Type II error. Moreover, our Bayesian analyses revealed results that were in line with our interpretation of our frequentist analyses.
Earlier, Paul et al. (Reference Paul, Bianchi, Augustyn, Klin and Volkmar2008) reported group differences in the way lexical stress is produced in individuals with and without ASD. They suggested that participant-related perceptual and/or motor issues might be at play. Unlike Paul et al., who used imitation to elicit responses, we used the non-imitation method of picture naming. This enabled us to look at speech production without the immediate influence of speech perception on the part of the participant. The fact that a group difference in production emerged during picture naming in the current study suggests that motor issues might be responsible. Indeed, there is a separate body of research suggesting that (at least some) children with ASD experience motor issues relating to gross, fine, and speech motor control (e.g., Adams, Reference Adams1998; Belmonte, Saxena-Chandhok, Cherian, Muneer, George, & Karanth, Reference Belmonte, Saxena-Chandhok, Cherian, Muneer, George and Karanth2013; Gernsbacher, Sauer, Geye, Schweigert, & Hill Goldsmith, Reference Gernsbacher, Sauer, Geye, Schweigert and Hill Goldsmith2008).
While speech motor issues in (some) children with ASD may relate to impaired execution or difficulties with planning and sequencing movements, it is also possible that (some) children with ASD may lack the social motivation to sound like others (i.e., lack of ‘tuning up’ as described in the discussion by Paul et al., Reference Paul, Bianchi, Augustyn, Klin and Volkmar2008). The fact that the subtle group differences in stress contrastivity we observed only emerged in the production of WS words suggests that speech motor control/practice issues may be a more likely explanation than lack of motivation to tune-up to others’ speech. Presumably, a lack of motivation to tune-up to others’ speech would affect both SW and WS words. However, we only found a statistically significant group difference in the production of WS words. The non-dominant WS pattern of stress is less common than the dominant SW pattern in English. Thus, children may have less practice with the non-dominant WS pattern. Although speculative, it is possible that this lack of practice might interact with speech motor issues in a way that affects those with ASD more than their TD peers. An interesting question is why our acoustic analyses of stress contrastivity in WS words showed a statistically significant group difference only in terms of intensity. Our study cannot answer this question, but this might be a worthy avenue to pursue in future research. It would also be valuable for future studies to include a wider range of SW and WS words when exploring the ideas we have proposed here.Footnote 1 We wish to emphasise that our study only examines one specific aspect of speech production, production of lexical stress, using a particular index of contrastivity. It is possible that the speech of those with ASD differs from that of TD peers in other ways.
The findings we report here have implications for research relying only on perceptual judgements of speech production. Like the earlier studies by Ballard et al. (Reference Ballard, Djaja, Arciuli, James and van Doorn2012), Arciuli and Ballard (Reference Arciuli and Ballard2017), and Arciuli and Colombo (Reference Arciuli and Colombo2016), our findings suggest that, even when word productions are correct via perceptual judgements, there can be fine-grained acoustic differences in the way stress contrastivity is realised. In addition, our findings suggest that these subtle acoustic differences may interact with the stress pattern of target words. Thus, it is valuable to consider multiple stress patterns in order to obtain a reliable estimate of performance across production of different word types.
Conclusion
In this study of how stress contrastivity is realised during speech production, we elicited 320 word productions from children with and without ASD via picture naming. The key finding of the current study is that there are fine-grained acoustic differences in the way that children with ASD produce stress contrastivity by comparison with typical peers. The fact that these subtle differences emerge in the production of WS words, but not SW words, suggests that speech motor control/practice issues may be a more likely explanation than a social emulation account whereby children with ASD lack motivation to ‘tune-up’ to the speech of others around them. This is an exploratory study and additional studies are needed to assess our tentative conclusions. We hope our study spurs further interest in acoustic studies of speech production in children with ASD and TD peers.
Acknowledgement
This work was supported by a Future Fellowship awarded to Joanne Arciuli by the Australian Research Council (FT130101570).