I. INTRODUCTION
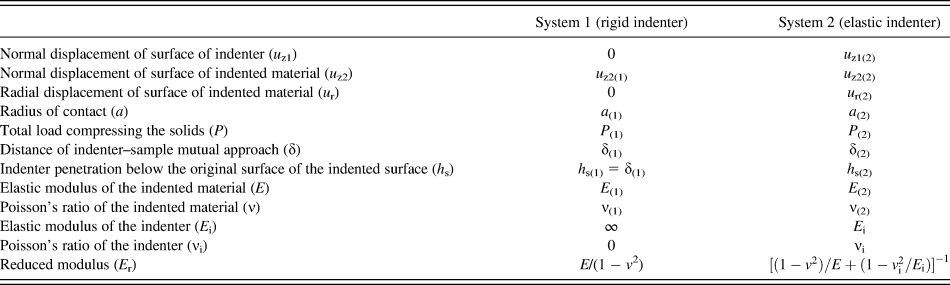
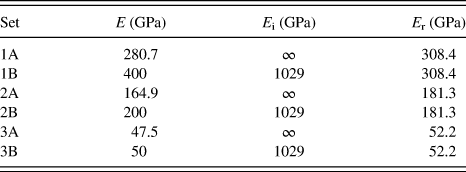
In recent years, instrumented indentation techniques have been increasingly used to determine the uniaxial mechanical properties of bulk materials and coatings through analytical and numerical solutions of the correlation between indentation load–displacement curves and such properties. Since the majority of these solutions are obtained for idealized rigid tips, some adjustments are required to account for the indenter deformation that occurs in actual experiments. This is commonly performed by recourse to the so-called reduced elastic modulus, as defined through Eq. (1) in Sec. II.Reference Oliver and Pharr1–Reference Casals and Alcalá3 A fundamental assumption in the use of the reduced modulus is that two systems (Table I), one with a rigid indenter and the other with an elastic indenter, are equivalent as long as the reduced modulus is the same.
Elastic properties and contact parameters.
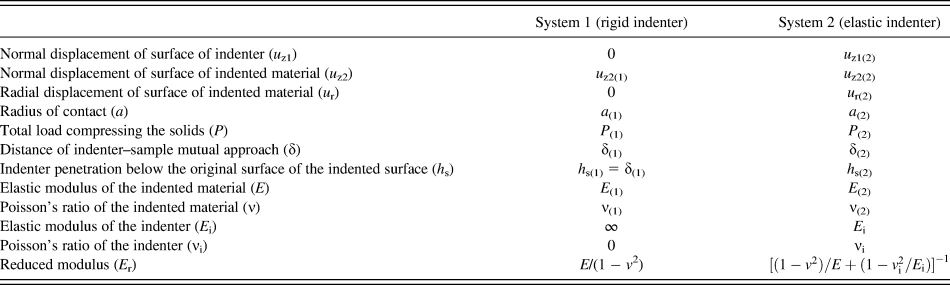
Instrumented indentation tests are carried out with systems in which the indentation load and the indenter tip displacement are continuously registered. At any load stage, the total displacement, as measured by the transducer, is the sum of the true indenter displacement below the original specimen surface and the displacement of the load train of the system (i.e., the system compliance). Upon correction of measured load–displacement curve for machine compliance,Reference Oliver and Pharr1 the resulting curve shall ideally measure the correlation between the applied indentation load (P) and the distance of indenter–sample mutual approach (δ). It is well known from classic linear elastic contact mechanicsReference Johnson4 that δ is not the magnitude of the indenter penetration below the original surface of the elastic half-space (h s) but the total displacement by which two remote points, one in the indenter and the other one in the half-space, approach each other. (Clarification is here needed in that while in our prior investigations, we use variable h s to denote measured penetration depth from the free surface,Reference Casals and Alcalá3, Reference Rodríguez, Souza and Alcalá5 this is only so when dealing with rigid indenter tips.)
Some controversy has been raised on the validity of the reduced modulus assumption,Reference Chaudhri6–Reference Ficher-Cripps9 which evidently translates into the extraction of mechanical properties from indentation P–δ curves. In the case of conical indentation, a conclusion of the experimental studyReference Lim and Chaudhri7 was that the reduced modulus assumption led to serious inaccuracies in the case of contact loadings imposed by elastic (rubber) cones onto rigid half-spaces (soda–lime glass block) or onto materials whose elastic modulus is close to that of the indenter. In these limiting cases, better results were obtained by regarding the indenters as rigid than by recourse to the reduced modulus assumption. The experiments are somewhat unclear in the fact that the elasticity of the indented rubber may be nonlinear as well as concerning the role of friction on the overall behavior. Also, other experimental resultsReference Lim and Chaudhri10 using tungsten carbide cones pressed against elastic blocks of both rubbers and different compositions of polydimethylsiloxane showed that with the exception of the penetration of a 60° cone, the indentation load–depth curves of all the elastic solids were well fitted by the so-called Sneddon’s solution for frictionless indentations with ideally rigid tips. Attention is drawn to the fact that the experiments represent the behavior of an extremely rigid tip, so that they may not be applicable under the large elastic contrasts between indenter tip and material arising in the indentation of metals and ceramics. Additional investigations have further illustrated that the use of the reduced modulus for nonrigid indenter tips underestimates the curvature of the load–depth curve when indenting elastoplastic metals with diamond and sapphire Berkovich tips.Reference Choi, Kraft and Schwaiger11
Correction of the contact area has also been claimed to be necessary due to the deformation of the indenter during penetration.Reference Jeong and Lee8, Reference Troyon and Huang12, Reference Veprek-Heijman, Veprek, Argon, Parks and Veprek13 This may affect in the calibration for the compliance of the indenter apparatus, which is commonly performed by estimating the contact area–δ function from instrumented indentation measurements.Reference McElhaney, Vlassak and Nix14 In this sense, deviation of the determined area function from that of perfect indenter geometry has been previously attributed to indenter deformation during contact.Reference Gong, Miao and Peng15 Although tip defects always exist, systematical analysis of indenter deformation effect on the area function determined by calibration is not available in the literature.
Assuming that the real contact area could be measured with precision, a correction is still necessary in Sneddon’s equation to account for indenter tip deformation. An explicit expression for the elastic unloading of a conical indenter with half apex angle, θ = 70.3°, has been presented as a function of the ratio E/E i and the Poisson’s ratio of the indenter material.Reference Cao, Dao and Lu16
This work provides a detailed analysis on the role of elastic indenter deformation in instrumented indentation measurements as well as on the validity of using of the reduced modulus assumption in its assessment. The investigation comprises finite element simulations for axisymmetric conical (θ = 70.3°) and pyramidal Berkovich indenters. The analysis essentially concerns the shape of the P–δ curve obtained with nonrigid tips; the possible flattening of indenter tips during penetration and the impact of this upon the use of Sneddon’s relation in three-dimensional (3D) pyramidal contacts; and the explicit influence of elastic indenter deformation in the dimensionless relations used to assess mechanical properties from instrumented indentation.
II. THEORETICAL BACKGROUND
The reduced modulus (E r) emerges from the elastic contact analysis by Hertz:

where E and E i are the elastic moduli and ν and ν i are the Poisson ratios of the material and the indenter, respectively. For the same value of E r, identical P–δ curves are attained for both rigid and elastic indenters brought into contact against elastic solids irrespectively of the specific moduli of the indenter and the material. The analysis is obviously restricted to the approximations in the Hertzian analysis, explicitly covering indenters and indented materials whose nonconforming frictionless contact behavior can be described through the linearized (small-strain) elasticity theory.Reference Johnson4
In his analysis of the elastic indentation of a flat surface by a sharp rigid cone of half-apical angle, θ, LoveReference Love17 showed that the mean pressure (p m) on the face of the cone, tip penetration (h s), and applied force (P), respectively, are given by Eqs. (2)–(4).
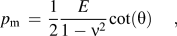
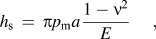

Also following Sneddon’s relation,Reference Sneddon18 it is noted that
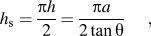
where h is the actual contact depth from the contact boundary (where material sinking-in occurs) to the center of the imprint. (It is noted that other nomenclature is also commonly used for this penetration depth, where h = h c.) Since from Eqs. (4) and (5), h s and P are related through
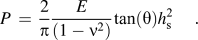
Equations (5) and (6) allow finding of the indentation stiffness
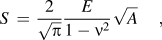
where S = dP/dh s and A is the true projected contact area accounting for material pileup and sinking-in. Equation (7) is usually referred to as Sneddon’s relation. Following these investigations, Eq. (7) has been extensively used in the analysis of the unloading (presumably elastic) stage from instrumented indentation experiments as in the landmark paper by Oliver and PharrReference Oliver and Pharr1; in this sense, a similar formulation can be traced to the work by Bulychev et al.Reference Bulychev, Alekhin, Shorshorov, Ternovskii and Shnyrev19
The work by Hay et al.Reference Hay, Bolshakov and Pharr20 is illustrative in showing that in addition to the vertical displacement (u z) imposed by the indenter tip, inward (negative) radial displacements (u r) are a concomitant to the above elastic analyses by Love and Sneddon. This is unrealistic because a true (physical) indenter cannot assimilate such inward displacements without restrain. Therefore, Hay et al.Reference Hay, Bolshakov and Pharr20 find that for a fixed penetration depth, the actual indentation load for a rigid conical indenter shall be greater than that from the analytical solution because the occurrence of radial (inward) displacements in the material are prevented by the indenter body. The implicit lack of material containment in the analytical solution thus softens the P–h s curve.
Furthermore, it is important to note that for elastic indenter tips, an increase in the original apex angle of the indenter is anticipated with increasing penetration, which is expected to lead to variations in the shape of P–δ curve.Reference Lim and Chaudhri7, Reference Ficher-Cripps9, Reference Cao, Dao and Lu16 Thus, considering the indentation configurations in Table I, θ(1) must be lower than θ(2) so that even in the assumption that E r(1) = E r(2), the two configurations shall render different contact responses [Eq. (6)].
The reduced modulus concept is also used in reverse algorithms for extracting the material properties (i.e., the uniaxial stress–strain characteristics) of elastic–plastic materials from instrumented indentation loading and unloading curves.Reference Dao, Chollacoop, Van Vliet, Venkatesh and Suresh2, Reference Casals and Alcalá3, Reference Rodríguez, Farias and Souza21 These algorithms rely on dimensional analyses of the indentation behavior of elastic–power law plastic solids, where it is taken that for ideally self-similar sharp indentations,

where n is the power law hardening coefficient and Y as yield strength.Reference Cheng and Cheng22Equation (8) is then often simplified using the reduced modulus E r,Reference Dao, Chollacoop, Van Vliet, Venkatesh and Suresh2 so that

Various useful dimensionless, Π, functions derived on the basis of Eq. (9) are given in literature.Reference Dao, Chollacoop, Van Vliet, Venkatesh and Suresh2, Reference Casals and Alcalá3, Reference Cheng and Cheng22 While this approach has been extensively investigated over the years, a systematic analysis remains unavailable to our knowledge on the influence of the reduced modulus assumption in such functions and on how this affects inferred mechanical properties.
III. FINITE ELEMENT ANALYSIS
Finite element simulations were carried out using the commercial code ABAQUS to model the indentation response of elastic and elastic–plastic solids. For conical indentation, a two-dimensional (2D) mesh of 2097 four-node axisymmetric elements of type CAX4R was used. For Berkovich indentation, a 3D mesh of 18,600 eight-node elements type C3D8R was used. The indenters were represented by a 2D mesh of 384 axisymmetric elements in the conical case, combining four-node type CAX4R and three-node type CAX3 elements. In the Berkovich case, the indenter was represented by a 3D mesh of 2416 eight-node elements type C3C8R. To eliminate the size effects induced by the distance to the boundary condition used in modeling the indenter tip, the indenter dimensions were increased maintaining the same geometry to a point where an additional increase did not produce measurable changes in the P–δ indentation curve.Reference Cao, Dao and Lu16
The indented material was modeled as a homogeneous and isotropic solid obeying the J 2-associated flow theory of plasticity with Poisson ratio ν fixed at 0.3. (The reader is directed to the work by Alcalá and Esque-de-los-Ojos,Reference Alcalá and Esqué-De Los Ojos23 for a detailed assessment of the validity of this theory in the modeling of indentation experiments in polycrystalline aggregates.) In these simulations, Y and n are defined through the following relation between the uniaxial stress σ and total uniaxial (elastic plus plastic) strain ε:
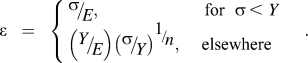
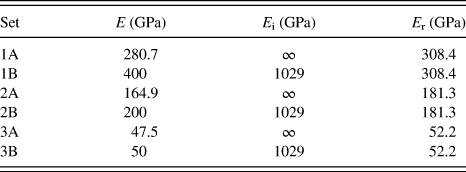
Three combinations of elastic moduli (denoted as sets 1–3 in Table II) were used in the simulations, both for rigid (sets A in Table II) and elastic indenters (sets B in Table II). Additionally, solids with E = 400, 200, and 50 GPa were indented using a rigid tip for the sake of comparison with the results obtained for elastic indenters. Six levels of ratio E r/Y (0, 10, 20, 100, 200, and 1000) for n = 0 were simulated for each of the six combinations of elastic properties shown in Table II, totaling 36 simulations for each indenter (it is noted that E r/Y = 0 implies perfectly elastic indented material). For a better representation of metallic materials, additional simulations were performed for solids with two levels of power law strain hardening coefficient, n, = 0.25 and 0.5, using all elastic combinations in Table II at two levels of ratio E r/Y = 200 and 2000. The elastic (diamond) indenter tips were assumed to have an elastic modulus E i of 1029 GPa (Table II) and Poisson ratio ν i of 0.07 (note that rigid indenters imply E/E i = 0).
Elastic properties of indented materials and indenters.
All simulations were performed for frictionless contacts at large strains and rotations. Such frictionless conditions were assumed by considering previous analyses, where it is found that while the amount of material pileup and sinking at the contact boundary is strongly affected by friction, the mechanical properties calculated from the P–h s curves remain essentially unaffected.Reference Rodríguez, Farias and Souza21, Reference Alcalá and Esqué-De Los Ojos23–Reference Harsono, Swaddiwudhipong and Liu25 The normal load was applied under displacement control. In all cases, a maximum displacement of 5 μm was imposed at the top of the indenter.
IV. RESULTS AND DISCUSSION
A. The role of indenter tip deformation in elastic instrumented indentations
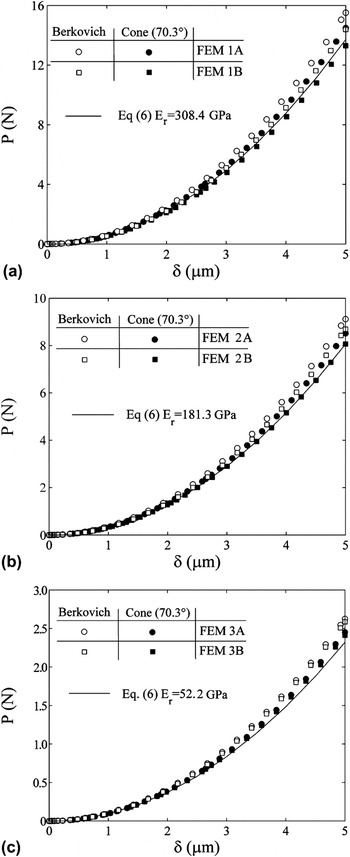
Figure 1 presents the P–δ curves obtained using the finite element method for perfectly elastic materials (E r/Y = 0). For conical and Berkovich indenters penetrating into elastic solids with identical reduced modulus, greater loads were obtained for rigid than for elastic indenters in good agreement with the conceptions in Sec. II. For instance, at fixed δ and identical reduced modulus E r = 308.4 GPa, a load level 9% greater was applied by the rigid tip (see set 1A in Table II) than in the case of the elastic tip (see set 1B in Table II). Similar differences were obtained for E r = 181.3 and 52.2 GPa, where the load increases ≈6% and 2%, respectively, for the rigid tip as compared to the elastic indenter case.
Load–displacement curves predicted by finite element method with rigid and elastic conical and Bekovich indenters. Perfectly elastic indented materials with modulus (a) 1A and 1B; (b) 2A and 2B; and (c) 2A and 2C from Table II are illustrated in the figures.

In spite of the above results, it is remarked that much better agreement between the P–δ curves of elastic and rigid indenters was obtained when the reduced modulus [instead of the direct value of E/(1 − ν 2)] is used to incorporate the deformation of the indenter. Results not shown in Fig. 2 indicated that the penetration of a rigid cone by 5 μm into a surface with E = 400 GPa required 55% more load than the case of the elastic cone (diamond) indenting the same surface. Similarly, greater loads by factors 28% and 7% are also required in the case of the indentation of materials whose elastic moduli are 200 and 50 GPa, respectively.
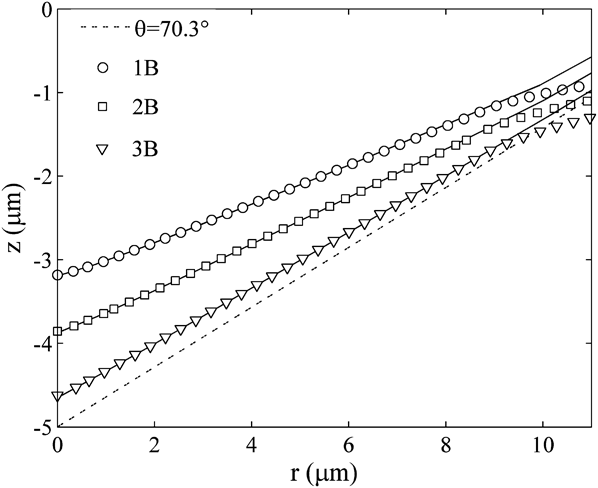
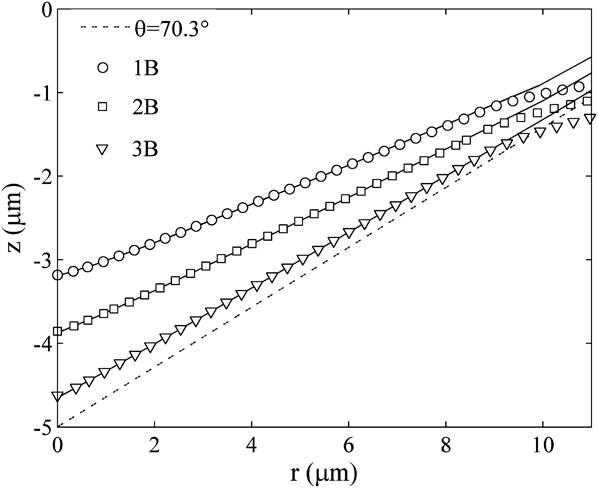
Shape of the contact surface on maximum load of elastic materials from Table II when indented by elastic cone of 70.3°. Solid lines correspond to the deformed indenters shape and the doted line corresponds to an indenter with half apex angle equal to 70.3°.
Analytical solutions are also presented in Fig. 1 [θ = 70.3° and E r in the place of E/(1 − ν 2) in Eq. (6)]. Sneddon’s solution allowing the inward (negative) displacement field u r underestimates load as compared to the simulations for rigid indenters. In indentations performed with elastic indenters, radial displacement of the tip is possible depending on the elastic contrast E/E i between indenter and material. Such a displacement then leads to changes in the apical angle. The present results show that for a fixed penetration of a conical indenter tip, the load applied by elastic indenters was underestimated [Fig. 1(c)] or overestimated [Fig. 1(a)] as compared to the analytical (Sneddon’s) solution using the reduced modulus. Such over- and underestimations depended on ratio E/E i as illustrated by these figures. Note that the analytical solution for a cone with half apex angle equal to 70.3° using E r in the place of E/(1 − ν 2) underestimated the load for both elastic and rigid Berkovich indenters [see Figs. 1(a)–1(c)]. This is taken to illustrate the fact that the reduced modulus represents a mere approximation to a more complex problem. It is finally noted that the loads required to achieve the same penetration depth in these elastic materials are greater for Berkovich than for conical indenters.
Figure 2 illustrates the change in the shape and apex angle of elastic conical indenters pressed against elastic materials. In these indentation processes, the half apex angle of the cone varies from its original value of 70.3° to 84°, 80°, and 75° for the cases 1B, 2B, and 3B, respectively (Table II). While these apical angles are measured directly from the deformed indenter shapes in the simulations, a variation in the angle from the original value of 70.3°, which yields the same contact area–penetration depth function between the indenters, has been indirectly assessed from the variation in such function.Reference Troyon and Huang12, Reference Gong, Miao and Peng15 For instance, Troyon and Huang,Reference Troyon and Huang12 working with fused quartz, estimated that a cone with half apex angle of 74.6° is equivalent to a Berkovich indenter. These authors indicated that this variation over the original value of 70.3° was mainly due to the different flattening responses of the tips.
Recent works have shown that the exponent of the loading segment of the P–δ curves [Eq. (11)] deviates from 2 mainly as a result of the increase in indenter tip roundness.Reference Rodríguez, Farias and Souza26–Reference Mady, Rodríguez, Gómez and Souza28 By fitting the loading segments of the P–δ curves obtained in the finite element simulations to Kick’s law

the mean value of λ obtained in conical and Berkovich indentations was 2.0077 ± 0.0011 and 2.0156 ± 0.0250, respectively. Note that since λ shall remain equal to 2 in Kick’s law irrespectively of the apex angle of the tip (i.e., changes in tip angle would affect K but not λ), the presently found preservation of λ ≈ 2 suggests that there would be no significant flattening or change in indenter shape during penetration.
B. The influence of indenter tip deformation in the variables ruling elastoplastic instrumented indentation
This section concerns evaluation of the influence of the elastic contrast E/E i in the different dimensionless relations that have been previously used in the analysis of instrumented indentation under the assumption of self-similar contact responses (i.e., in the absence of indentation size effects). In what follows, we shall thus examine the influence of the reduced modulus approximation in a selected set of dimensionless relations where the equivalency between Eqs. (8) and (9) is assumed. Then, the deviation from unity in the ratio between each such relations and their respective values for rigid tips (E/E i = 0) is regarded as a measure of the inaccuracies introduced by the reduced modulus assumption.
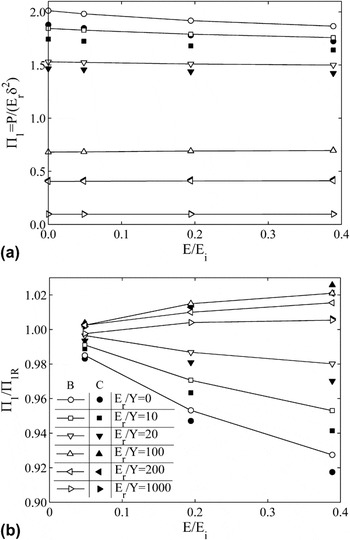
We shall start the discussion by considering dimensionless relation Π1 = P/E rδ2,Reference Dao, Chollacoop, Van Vliet, Venkatesh and Suresh2 which is shown in Fig. 3 for the elastic and elastic–perfectly plastic cases simulated in this work. [Note that in Fig. 3, the rigid indenter condition of E/E i = 0 can be attained for the three different values of E = 50, 200, and 400 GPa used in this work as long as E i → ∞, so that in each of the data points located at E/E i = 0 in Fig. 3(a), there are indeed three different overlapping simulations.] While this figure supports the practice of accounting for indenter deformation through the reduced modulus assumption at large values of E r/Y > 20 (variation smaller than 3% in the dimensionless Π1 relation with E/E i), a deviation occurs as the elasticity of the material becomes more pronounced for E r/Y < 20.
(a) Variation of dimensionless load function Π1 in elastic and elastic-perfectly plastic materials in terms of elastic contrast between indenter and material E/E i. (b) Ratio between the dimensionless load function for elastic tips Π1 and its equivalent for rigid tips Π1R. B indicates Berkovich, and C indicates conical indenters.

Figure 3(b) presents the ratio Π1/Π1R between the values of the dimensionless relation Π1 obtained with elastic indenters and the relation Π1R for rigid indenters. For the elastic–perfectly plastic materials with ratio E r/Y equal to 0, 10, and 20, Π1 decreases when the ratio E/E i increases. For the other materials, Π1 increases when the ratio E/E i increases. Strain hardening plays a role upon these results, as it increases the differences between elastic and rigid indenters. For instance, in the case of a material with E r/Y = 200 and n = 0, Π1/Π1R reached 1.018 at E/E i = 0.39, while, for the same E/E i, Π1/Π1R reached 1.068 and 1.080 for n = 0.25 and n = 0.5, respectively.
For E/E i = 0, the results in the literature already indicate that Π1 decreases when the ratio E/Y increases.Reference Dao, Chollacoop, Van Vliet, Venkatesh and Suresh2, Reference Rodríguez, Souza and Alcalá5, Reference Cheng and Cheng22, Reference Rodríguez, Farias and Souza27 Note that for a given E r, ratio E/Y is lower in systems with rigid than with elastic indenter. (See Table III, where in systems whose E r = 308.4 GPa, ratio E/Y of the indented material is up to 42% larger when indented by an elastic tip than with the rigid tip.) Moreover, the difference between the ratios E/Y for rigid and elastic tips decreases when the reduced modulus decreases. (This difference becomes up to 21% and 5.2% for E r = 181.3 and 52.2 GPa, respectively, see Table III.) As consequence, Π1/Π1R shall be anticipated to be lower than 1 and decreases as the elastic contrast (E/E i) increases because at constant E r/Y, ratio E/Y still gradually increases. The results in Fig. 3(b) incidentally show that this explanation is indeed false for the large values of E r/Y > 100, where Π1/Π1Rincreases with E/E i.
Ratio between elastic modulus (E) and yield strength (Y) of the indented materials.

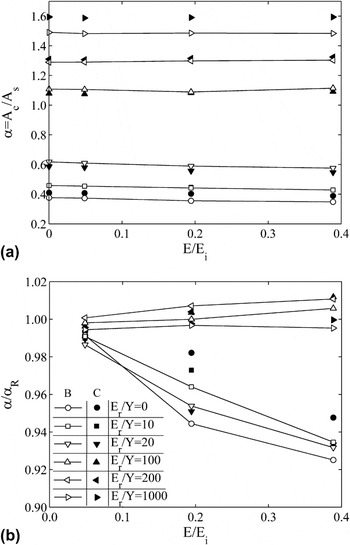
The amount of pileup or sinking-in is quantified by parameter α, defined as the ratio between A and A s (e.g., see Ref. Reference Casals and Alcalá3):

In Eq. (12), A s is the contact area as measured from the original surface (i.e., without pileup or sinking-in). In the absence of elastic deformation in the tip, this contact area A s is thus identical to the cross-sectional area of the indenter at a depth equal to h max. (It therefore strictly exists factor f so that A s = fh s2. In the case of Berkovich indentation, f = 25.56.) Parameter α depends on the mechanical properties and is mainly influenced by n. Reference Casals and Alcalá3
Figure 4(a) gives the values of α calculated as the ratio between A, directly obtained from the finite element analysis, and A s, calculated as A s = 25.56  (i.e., under the assumption that δmax = h max, which is only strictly fulfilled for rigid tips, E/E i = 0). Figure 4(b) shows α exhibiting the same behavior with E/E i as function Π1. A similar trend in terms of E/E i, not shown in Fig. 4, was also obtained for materials that undergo strain hardening (n ≠ 0), where α decreased up to 10% as E/E i increases to the present limit of 0.39.
(a) Quantification of the levels of pileup and sinking-in from parameter α obtained from the finite element simulations with elastic and elastic-perfectly plastic materials indented by conical (C) and Berkovich (B) indenters as a function of ratio E/E i. (b) Ratio α/αR for elastic and rigid indenters.

Accurate instrumented indentation testing relies on prior assessment of machine compliance. This is usually performed by finding the actual correlation between area A s and penetration depth measurements δmax. The resulting function is then used as a replacement for the ideal geometrical function, i.e., A s = 25.56  in the case of rigid Berkovich indentation where h s = δmax. Usually, the A s − δmax function in solids undergoing sinking-in is obtained by assuming the following correlation.Reference Oliver and Pharr29, Reference Sun, Zheng, Bell and Smith30
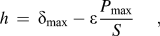
where ε is a geometrical factor that varies depending on m—the exponent of the unloading curveReference Oliver and Pharr29; and S is the contact stiffness allowing contact area estimates under the assumption of Sneddon’s relation with reduced modulus E r. Because of the inaccuracy in the reduced modulus assumption described above, it is found that the use of Eq. (13) leads to errors of about 10% in the estimation of the contact area even in elastic–plastic materials presenting sinking-in (E/E i = 0.39). This error adds to the uncertainties of the procedure, where a fixed value of ε needs to be further assumed in Eq. (13) where the value of ε used in the present analysis strictly adheres to its dependency with m—the exponent of the unloading curve—as originally described in Oliver and Pharr.Reference Oliver and Pharr29
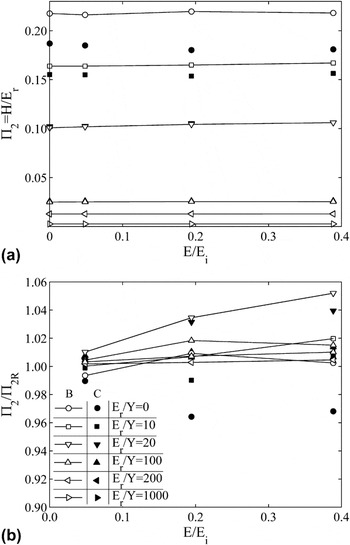
Another dimensionless relation that has been adopted in the analysis of instrumented indentation data is Π2 = H/E r,Reference Dao, Chollacoop, Van Vliet, Venkatesh and Suresh2, Reference Casals and Alcalá3, Reference Rodríguez, Farias and Souza21, Reference Cheng and Cheng22, Reference Cheng and Cheng31 where H is the hardness defined as H = P/A (Fig. 5). Figure 5(b) shows that the differences between Π2 and Π2R were smaller than 6% for the indentation of elastic–perfectly plastic materials. The effect of E/E i on Π2 was more pronounced in work-hardening materials, so that for instance, the value of Π2/Π2R reached 1.19 for E r/Y = 200, n = 0.5 at E/E i = 0.39.
(a) Dimensionless function Π2 = H/E r in elastic and elastic-perfectly plastic indented materials as a function of E/E i. (b) Ratio between dimensionless function for elastic tips Π2 and its equivalent for rigid tips Π2R. B indicates Berkovich, and C indicates conical indenters.

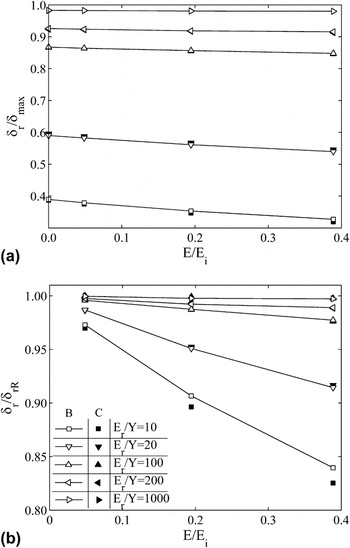
Dimensionless parameters δe/δmax and δr/δmax characterize the unloading instrumented indentation stage, where δe is the intersection with P = 0 of a straight line of slope S drawn from point (P max, δmax), and δr is the residual indentation depth measured upon complete unloading.Reference Dao, Chollacoop, Van Vliet, Venkatesh and Suresh2, Reference Casals and Alcalá3, Reference Rodríguez, Farias and Souza21 Ratio δe/δmax exhibited a slight variation, smaller than 5%, with ratio E/E i for both conical and Berkovich indenters. Nevertheless, ratio δr/δmax was extremely sensitive to the elastic contrast, decreasing by 17% when the ratio E/E i was increased to 0.39 (Fig. 6). This variation in δr/δmax can be explained because part of the elastic recovery during unload corresponds to the recovery of original indenter shape. The effect of E/E i on δr/δmax is thus anticipated to have important consequences in the assessment of the mechanical properties from algorithms based on the energy released during unloading.Reference Cao, Qian, Lu and Yao32
(a) Relationships between δr/δmax and ratio E/E i in elastic and elastic-perfectly plastic materials. (b) Ratio between the residual indentation depth for elastic tips δr and its equivalent for rigid tips δrR. B indicates Berkovich, and C indicates conical indenters.

From the unloading indentation curve, the elastic modulus is usually estimated using the Sneddon’s equation [Eq. (7)], where E/(1 − ν 2) is replaced by the reduced modulus E r and correction factor β is incorporated, as in

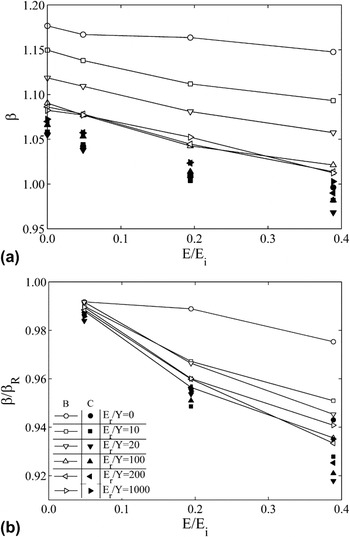
Correction factor (β) has been reported to dependent on (i) indenter geometry and Poisson’s coefficient,Reference Troyon and Huang12, Reference Cao, Dao and Lu16, Reference Hay, Bolshakov and Pharr20, Reference King33 (ii) the level of pileup or sinking-in in case of Berkovich and Vickers indenters,Reference Rodríguez, Farias and Souza27, Reference Rodríguez34 and (iii) the indenter elastic deformation in case of super-hard materials.Reference Cao, Dao and Lu16 Influences of elastic anisotropy of an indented single crystalline unit of material upon the unloading (elastic) indentation behavior [Eq. (14)] measured with Berkovich indenters have also been covered in our recent works.Reference Casals, Ocenasek and Alcalá35, Reference Alcalá, Esque-De Los Ojos and Rodríguez36
Although ratio δe/δmax was rather constant with elastic contrast E/E i, use of the reduced modulus in Eq. (14) is an implicit approximation that leads to errors in this equation. These errors can be analyzed by assuming that β varies with E/E i. Hence, by imputing direct values of P max, δmax, δe/δmax, E r, and A from the present simulations into Eq. (14), it then becomes possible to evaluate the influence of elastic contrast E/E i on β [Fig. 7(a)]. In the case of conical indentation, where the contact area is circular, the correction factor was independent of the mechanical properties of the material and thus remained unaffected by changes in hardness. In this case, β varied 8.2% within the current range of E/E i analyzed in this work. For Berkovich indenters, β depends on the level of pileup or sinking-in and thus becomes affected by the mechanical properties (i.e., ratio E r/Y) as described in Ref. Reference Rodríguez, Souza and Alcalá5. In this case [Fig. 7(a)], we evaluate the value of β at E/E i = 0 for the different elastic–perfectly plastic materials and proceed with its assessment by increasing E/E i to the maximum value of 0.39. In addition to the variation in β induced by a change in mechanical properties, it is currently found that E/E i introduces and additional decrease in β, which does not exceed 7%. Figure 7(b) finally shows that the relative change in β with respect to the value corresponding to rigid indenters, i.e., ratio β/βR, with increasing E/E i is essentially the same for Berkovich and conical indentations.
(a) Correction factor β in terms of ratio E/E i. (b) Ratio between correction factor for elastic tips β and its equivalent for rigid tips βR. B indicates Berkovich, and C indicates conical indenters.

C. Quantification of the influence of indenter tip deformation in the dimensionless functions ruling instrumented indentation and in the extraction of the uniaxial stress–strain characteristics
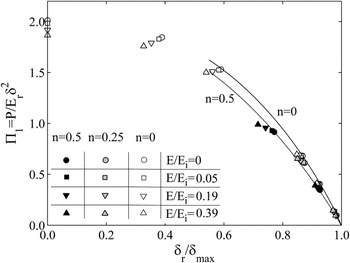
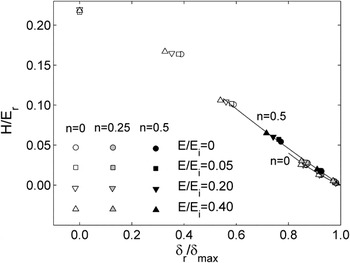
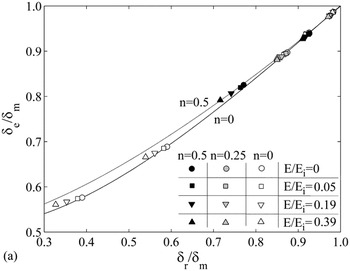
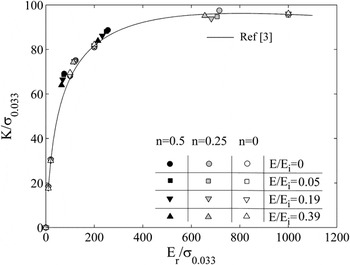
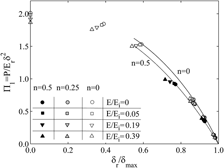
Parametric relationships between dimensionless functions have been proposed to extract mechanical properties from indentation data.Reference Dao, Chollacoop, Van Vliet, Venkatesh and Suresh2, Reference Casals and Alcalá3, Reference Rodríguez, Farias and Souza21, Reference Rodríguez, Farias and Souza27, Reference Cheng and Cheng31 Relationships between Π1 = P/E rδ2 and δr/δmax, Π2 = H/E r and δr/δmax, and δe/δmax and δr/δmax are presented in Figs. 8, 9, and 10, respectively, for materials with different strain hardening responses. Another relationship between the dimensionless functions K/σ0.033 and E r/σ0.033 is useful in the extraction of yield strength,Reference Dao, Chollacoop, Van Vliet, Venkatesh and Suresh2, Reference Casals and Alcalá3 where σ0.033 is an ad hoc representative stress level.
Scaling dimensionless relationships between Π1 = P/E rδ2 and δr/δmax. Binding curves are provided for the relationship between Π1 and h r/h max for a rigid Berkovich indenter pressed against solids with hardening coefficient n = 0 and 0.5 from our previous investigation.Reference Rodríguez, Souza and Alcalá5

Scaling dimensionless relationships between Π2 = H/E r and δr/δmax. Binding curves are provided for the relationship between Π2 and h r/h max for a rigid Berkovich indenter pressed against solids with hardening coefficient n = 0 and 0.5 from our previous investigation.Reference Casals and Alcalá3

Scaling dimensionless relationships between δe/δmax and δr/δmax for Berkovich indentation. The continuous binding curves for hardening coefficient n = 0 and 0.5 are for the rigid Berkovich indenter from our previous investigation.Reference Rodríguez, Souza and Alcalá5

Figures 8–10 show that the variations of the dimensionless functions induced by the increment in E/E i are equivalent to those that result when the value of hardening coefficient n is changed in indentations using rigid indenters (E/E i = 0). This would obviously affect in any methodology where the computation of n is sustained upon dimensionless functions for rigid tips. Incidentally, this is an important difference with respect to spherical indentations, where, although the shape of the indentation curve changes with the increase in E/E i, parametric relations between the dimensionless functions Π1 and Π2 and the ratio δr/δmax are maintained for rigid and elastic indenters if E r is used to account for indenter deformation.Reference Rodríguez, Alcalá and Souza37
From the relationship between K/σ0.033 and E r/σ0.033 (Fig. 11), which is hopefully independent of n,Reference Dao, Chollacoop, Van Vliet, Venkatesh and Suresh2, Reference Casals and Alcalá3 the changes induced in K because of variations in elastic contrast E/E i may readily lead to a change in the estimated representative stress σ0.033.
Scaling dimensionless relationship between K/σ0.033 and E r/σ0.033. The continuous curve corresponds to the rigid conical tip (θ = 70.3°) used in Ref. Reference Dao, Chollacoop, Van Vliet, Venkatesh and Suresh2.

Figure 10 presents the relationship between ratios δe/δmax and δr/δmax, which is well known to spread in terms of n. Reference Casals and Alcalá3, Reference Rodríguez, Souza and Alcalá5, Reference Rodríguez, Farias and Souza21 In Fig. 10, continuous curves for E/E i = 0 at n = 0 and for E/E i = 0 at n = 0.5 are provided as bounds for the present computations through the dimensionless function found in our recent work.Reference Rodríguez, Souza and Alcalá5 The correlation between the two penetration depth ratios and n has been demonstrated to be key in mechanical property assessments, as measurements of δe/δmax and δr/δmax from the P–δ curve permit calculation of hardening coefficient n.Reference Rodríguez, Souza and Alcalá5 In this context, the present simulations for different elastic contrasts between indenter and material show that the variation induced in both δe/δmax and δr/δmax because of indenter deformation does not modify the conclusion in our prior work in that materials whose δr/δmax is greater than 0.7 exhibit a fundamental lack of uniqueness in mechanical property extractions. Hence, a given experiment providing one set of values for δe/δmax and δr/δmax can be regarded to have more than one possible solutions for n. (As described in our investigations, this duality can be resolved through direct measurement of the contact area, see Refs. Reference Casals and Alcalá3, Reference Rodríguez, Souza and Alcalá5, Reference Rodríguez, Farias and Souza21, and Reference Mata and Alcalá38.)
In spite of the ongoing discussion, indenter tip deformation leads to a sufficient variation in the relationship between δe/δmax and δr/δmax so as to significantly affect upon the inferred value of n. In this context, in a perfectly plastic material, this relationship shifted from the anticipated curve at n = 0 to that corresponding to n = 0.5 when ratio E/E i increased. This effect is more pronounced in materials exhibiting large ratios of δr/δmax, where a slight difference in the values of δe/δmax and δr/δmax leads to extreme variations in the inferred n.Reference Casals and Alcalá3, Reference Rodríguez, Souza and Alcalá5, Reference Rodríguez, Farias and Souza21, Reference Casals, Alcalá and Očenášek39
For the sake of illustration (Fig. 10), when ratio δr/δmax is measured as 0.86 for a perfectly plastic material (n = 0, E r/Y = 100, E = 400 GPa at E/E i = 0.39), hardening coefficient is overestimated in 0.55 using the dimensionless function for rigid indenters that has been used in all our prior analyses. Keeping δr/δmax = 0.86 as in the above, application of the dimensionless function obtained for rigid tips (E/E i = 0) to a perfectly plastic material with n = 0 and E = 200 GPa (E/E i = 0.19) yields hardening coefficient n of 0.42. Finally, when the same operation is performed for a material with 50 GPa (δr/δmax = 0.86 and E/E i = 0.05), n is estimated to be 0.34. By lowering ratio δr/δmax to 0.75 (E r/Y = 200, n = 0.5), the absolute error in n decreases to 0.091, 0.047, and 0.041 for the same respective values of E/E i = 0.39, 0.19, and 0.05 as discussed above. The latter errors for δr/δmax = 0.75 can be essentially neglected when compared to the influence of the experimental scatter in the inferred n. Reference Rodríguez, Souza and Alcalá5 Such errors are also comparable to the underestimation in n by 0.1, which has been anticipated to occur when neglecting frictional effects between indenter and material.Reference Rodríguez, Souza and Alcalá5, Reference Mata and Alcalá24, Reference Harsono, Swaddiwudhipong and Liu25 Incidentally, the aforementioned results provide a clear-cut explanation for our recent experimental evaluation of strong overestimations in n from our methodology for mechanical property extractions.Reference Rodríguez, Souza and Alcalá5
In view of the current results, a sensible future line of work concerns finding of various dimensionless functions between δe/δmax and δr/δmax at different values of elastic contrast E/E i. In the assumption that these functions were available, one could thus simple use the Oliver and Pharr approximationReference Oliver and Pharr29 to obtain a rough estimate of E. This will provide the value of E/E i that is pertinent to the experiments at hand and allows use of the actual correlation between δe/δmax and δr/δmax ruling the experiment. In the current absence of these dimensionless functions, one can obtain an approximation of n by examining first the experimentally obtained value of δr/δmax. If this ratio is smaller than, say, 0.82, one can simply take the rigid indenter solution (E/E i = 0) for the correlation between δe/δmax and δr/δmax and extract the n value through the explicit formulations given in Refs. Reference Rodríguez, Souza and Alcalá5, Reference Rodríguez, Farias and Souza21, and Reference Rodríguez34. If δr/δmax > 0.80, one can roughly decrease the inferred n under the above rigid indenter assumption by an amount of 0.35–0.40.
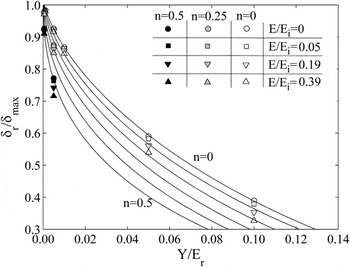
Another issue under investigation concerns extraction of yield strength from the dimensionless relationship between the ratios K/σ0.033 and E r/σ0.033 in Fig. 11 and in the relationship between the ratios δr/δmax and Y/E r in Fig. 12. For a fixed value of hardening coefficient, the variation in ratio δr/δmax because of indenter deformation is found to lead to an overestimation of the yield strength. For instance, for fixed values of E r and n, use of the relationship between ratios δr/δmax and Y/E r translated into an overestimation of yield strength by 5% for E/E i = 0.05, by 13% for E/E i = 0.19, and by 22% for E/E i = 0.39 (Fig. 12). These are relatively minor errors when compared to those introduced by experimental scatterReference Rodríguez, Souza and Alcalá5 because in metals and ceramics, E/E i is usually smaller than 0.17.
Scaling dimensionless relationships between δr/δmax and Y/E r. The continuous curves correspond to the five relationships between h r/h max and Y/E r for rigid Berkovich indenters where hardening coefficient n is varied from 0 to 0.5.Reference Rodríguez34

The relationship between Π2 = H/E r and δr/δmax is presented in Fig. 9. While preliminary investigations suggested that a single unique relation develops between these two parameters,Reference Dao, Chollacoop, Van Vliet, Venkatesh and Suresh2, Reference Cheng and Cheng31 more recent studies show that the correlation splits in terms of n.Reference Casals and Alcalá3 The results in Fig. 9 indicate that the influence of E/E i upon Π2 is rather mild as compared to that introduced into other dimensionless functions.
The level of pileup or sinking-in (as given by parameter α) has been prescribed in terms of h r/h max and hardening coefficient n.Reference Casals and Alcalá3 Knowledge of α is crucial in contact area assessments so that its accurate measurement thus affects in further estimations of hardness and elastic modulus. Even if n is known a priori, the decrease of the ratio δr/δmax induced at increasing elastic contrasts E/E i leads to an underestimation of the contact area. This is because of the known increase in α with increasing h r/h max.Reference Casals and Alcalá3
D. Comparison between the indentation response of pyramidal and conical tips
The indentation behavior measured with pyramidal Berkovich and Vickers indenters has been usually approximated to that of a conical indenter with a half apex angle θ equal to 70.3° because the latter gives the same depth to area relationship as the above pyramids. Indentations with Berkovich tips have been found to be either more rigid or less rigid than those with conical indentersReference Sakharova, Fernandes, Antunes and Oliveira40, Reference Swaddiwudhipong, Hua, Tho and Liu41 depending on the mechanical properties of the indented material. Our previous findingsReference Casals and Alcalá3 also illustrated on the above assumption on the equality between conical and pyramidal indentations by considering the influence of conical, Berkovich, and Vickers indenters in the dimensionless functions ruling the indentation process. As shown in Figs. 3–8 at increasing E/E i, the differences between the equivalent conical indenter and the Berkovich indenter increase. For the same properties of indented material (E/E i = 0), the indenter load was smaller, up to 7.1%, for the cone than for the Berkovich indenter. The differences further increase, up to 8.2%, for elastic indenters.
For elastic materials indented by rigid tips, the contact area was 8% greater for conical than for Berkovich indenters. The differences in contact areas increase up to about 10% for the elastic indenters. In elastic–plastic material responses, larger contact areas were obtained for the Berkovich indenter as compared to the conical tip. The largest differences were of about 5% for E r/Y = 1000.
The difference between the unloading dimensionless function δr/δmax versus δe/δmax for conical and Berkovich indenters was of about 2% for E/E i = 0. This difference increases up to about 3% as the elastic contrast between indenter and material, E/E i, increases to the present upper limit of 0.39. It is recalled that these variations introduced large uncertainties in the estimated n value (Sec. IV. C).
V. CONCLUDING REMARKS
This investigation has provided a systematic assessment of the influence of indenter tip compliance on the analysis of the P–δ curves obtained through instrumented indentation experiments. In doing so, extensive finite element simulations have been performed where the elastic contrast E/E i between indenter and material is varied from 0 (perfectly rigid indenter) to 0.05, to 0.19, and to 0.39. The analysis is performed for elastic and rigid materials exhibiting perfect plasticity (as given by strain hardening parameter n = 0) as well as marked power law strain hardening (n > 0). The above ranges of mechanical properties are assumed as they represent the response of essentially all metals and ceramics indented by diamond tips. The following are the main findings from the investigation.
(i) The so-called Sneddon’s relation [Eq. (14)], which is conventionally used in the extraction of the elastic modulus of the material E from instrumented indentation unloading data requires correction for indenter tip compliance. This is so even when the reduced modulus E r is used in Eq. (14) to account for the mutual elastic response of indenter/material system [Eq. (1)]. Correction to Sneddon’s relation is herein performed by assuming dependency of factor β in Eq. (14) to indenter tip deformations. It is found that β decreases with E/E i to a maximum of 8.2% (Fig. 7). This variation needs to be taken into account when indenting elastically stiff solids such as some crystalline ceramics as alumina, whose E is in the range of 400 GPa (E/E i ∼ 0.35). It is noted that since both conical and Berkovich tips are modeled in this work, the above variation in β already incorporates the possible changes in this parameter because of the prevailing framework where pyramidal tips are approximated by the “equivalent” conical geometries for which Eq. (7) was indeed derived.
(ii) The deformation of conical and pyramidal (Berkovich) indenters during contact is amenable to analysis through a correction of the half-apical angle from the original undeformed value (i.e., θ = 70.3° for the conical tip). It is thus found that tip flattening—a hypothetical mechanism by which indenters may be assumed to change shape during contact—plays a negligible role upon the indentation behavior. The maximum variation estimated in tip angle involves change from θ = 70.3° to 84°.
(iii) A detailed analysis has been performed on the influence of indenter tip deformation on key dimensionless relations ruling instrumented indentation experiments. In this context, it is found that the reduced modulus approximation leads to significant alterations in such relations. It is therefore explicitly shown that while this practice is better than neglecting indenter tip deformations, it is far from being accurate.
(iv) Indenter tip compliance is also shown to play a key role in the extraction of the uniaxial stress–strain characteristics of the indented material. In this sense, it is found that the ratio between the residual indentation depth upon complete unloading and the maximum indenter displacement δr/δmax decreases to an utmost value of 17% when compared to that exhibited by ideally rigid tips. This aspect in conjunction with the aforementioned inaccuracies introduced by the reduced modulus approximation leads to an overestimation of hardening coefficient n of, say, 0.3–0.4 for δr/δmax > 0.80. That is to say that in perfectly plastic solids (n = 0), the extracted n value can be as large as 0.40. The influence of indenter tip compliance in the extraction of n can be however neglected when the indented material exhibits δr/δmax < 0.80. Experimental support to these findings is given in our recent work,Reference Rodríguez, Souza and Alcalá5 where significant overestimations are found when n is inferred from instrumented indentations. Guidelines and possible research lines are discussed in the paper to minimize the influence of indenter deformation in such mechanical property extractions.
(v) Contact area estimates are usually used in the calibration of indenter systems to account for machine compliance. Interestingly, it is found that the contact area estimated by neglecting indenter tip compliance [Eq. (12)] may be significantly affected by this assumption, especially when elastically stiff solids are used in the calibration. The present work interestingly calls for the complementary use of soft and elastically compliant materials exhibiting sinking-in effects (such as well-annealed copper single crystals of high purity) when performing calibration of machine compliance to ensure that the results are not affected by indenter tip deformations. In doing so, our previous analyses of single crystal indentations with Berkovich tips may be instrumental in finding the equivalent value of E of the indented single crystal (e.g., Ref. Reference Alcalá, Esque-De Los Ojos and Rodríguez36). It is finally noticed that the increase in elastic contrast E/E i enhances the differences between the indentation responses measured with actual pyramidal (Berkovich) indenters and their conical equivalent.
ACKNOWLEDGMENTS
This research was sponsored by the CNPq under Contract No. 141259/2007-8 and by the Spanish Ministry of Education and Science through Project MAT2008-01647/MAT.