Coloured, toxic industrial waste is increasingly becoming a social and environmental problem. The contaminants may spread through living organisms via aquatic pathways (Ngulube et al., Reference Ngulube, Gumbo, Masindi and Maity2017), necessitating the development of numerous techniques to eliminate dyes from wastewater (Yang et al., Reference Yang, Li, Li and Yang2018). Adsorption is among the methods used for water treatment because of its low start-up costs, straightforward design and ease of operation and implementation, even in small plants (Mu & Wang, Reference Mu and Wang2016). Because of stringent laws concerning the removal of dyes from wastewaters before their discharge into the aquatic environment and the cost of conventional adsorbents, development of new, low-cost adsorbents with improved adsorption properties has become commonplace (Yagub et al., Reference Yagub, Sen, Afroze and Ang2014).
Various abundant, naturally occurring materials have been examined as possible adsorbents for dye treatment (Santos et al., Reference Santos, Oliveira and Boaventura2016; Sarma et al., Reference Sarma, Gupta and Bhattacharyya2016). There is increasing focus on natural adsorbents, and preferably the development of adsorbents demonstrating both low costs and high adsorption capacities for removing inorganic contaminants from polluted waters. Although a variety of sorbents have been used for water decontamination, naturally available clays have been applied in most developing countries (Adebowale et al., Reference Adebowale, Olu-Owolabi and Chigbundu2014; Gamoudi & Srasra, Reference Gamoudi and Srasra2018; Kausar et al., Reference Kausar, Iqbal, Javeda, Aftab, Nazli, Bhatti and Nouren2018). It is extremely important to choose ta echnique for water decontamination that is cheap and requires minimal workload. Using clay minerals and soils fits well with the above-mentioned requirements.
Halloysite clay is an inexpensive adsorbent applied for the decolourization of dyed wastewater. Halloysite (Al2Si2O5(OH)4·nH2O, where n is 0 in kaolinite and up to 4 in halloysite) is a dioctahedral 1:1 clay mineral belonging to the kaolin group (Berthier, Reference Berthier1826). It has a similar structure to kaolinite, but it is rolled in tubes with diameters of ~50 nm and lengths of ~1000 nm (Słomkiewicz et al., Reference Słomkiewicz, Szczepanik and Garnuszek2015). Halloysite clay displays greater adsorption capacity for both acidic and basic dyes because of the presence of a negatively charged SiO2 outermost surface and positively charged Al2O3 inner surface; thus, it has effective bivalent adsorbing capacity (Zhao et al., Reference Zhao, Abdullayev, Vasiliv and Lvov2013).
Most previous studies have focused on an individual dye using synthetic solutions. The objectives of the present study were to evaluate the adsorption capacity of halloysite clay for two anionic and two cationic dyes, Direct Red 81 (DR81), Methyl Orange (MO), Methylene Blue (MB) and Crystal Violet (CV), which are used in the textile industry, and to evaluate the influences of several parameters on the adsorption capacity of the clay. The adsorption kinetics and isotherms were studied in order to determine the adsorption capacity of the clay. This provided an opportunity to perform a comparative analysis on how the halloysite material adsorbs variously charged dyes under the same experimental conditions. There have been few studies that test adsorbent materials on real, coloured industrial effluents. In the present study, halloysite was tested on real industrial wastewater in order to ascertain the feasibility of the adsorbent under real conditions.
Materials and methods
Materials
The halloysite nanoclay–kaolin clay was purchased from Sigma Aldrich (South Africa). MO, MB, CV, HCl, KCl and NaOH pellets were purchased from Rochelle Chemicals (South Africa). DR81 was purchased from Sigma Aldrich (South Africa). Real industrial effluent was obtained from an operator in the printing and ink industry.
Batch removal studies
Deionized water (ELGA, Micra Veolia Water Solution and Technologies, UK) was used to prepare dye solutions by dissolving appropriate amounts, accurately weighed on an electronic balance (RADWAG electronic balance, Wagi Elektroniczen, Poland), of dry powder dye to prepare a stock solution (1000 mg/L). Experimental solutions were obtained by serial dilutions to obtain the working solutions at desired concentrations. The final concentrations of the dyes were estimated for each sample absorbance at the wavelength corresponding to the maximum absorption peak (λmax = 510, 505, 664 and 590 nm for DR81, MO, MB and CV, respectively) using a Vis spectrophotometer (Thermoscientific Orion Aqua Matte 7000, China) using a constructed calibration graph from prepared standard solutions. Batch adsorption experiments were performed in 250 mL glass Erlenmeyer flasks containing 50 mL of dye solution of desired concentrations at various pH values (2, 4, 6, 8, 10 and 12), initial dye concentrations (1, 5, 10, 20, 30 and 40 mg/L), temperatures (25°C, 35°C, 45°C and 55°C), contact times (10, 15, 20, 30, 60 and 90 min) and adsorbent dosages (0.1, 0.2, 0.4, 0.8, 1.0 and 2 g). The solution pH was adjusted using either 0.1 M HCl or 0.1 M NaOH solution. The solutions were shaken on a reciprocating table shaker (Labotec, Model 207, South Africa) at 250 rpm. After the equilibration time, the solutions were allowed to settle for 30 min and the absorbance of the supernatant solution was recorded. All of the experiments besides those of temperature variation were carried out at room temperature (25 ± 3°C). In order to verify the reproducibility of the results, the experiments were carried out in triplicate and the mean values were reported.
Characterization
X-ray diffraction (XRD) traces of halloysite were acquired using a PANalytical X'Pert PRO powder diffractometer in θ–θ configuration with an X'Celerator detector and variable divergence and fixed receiving slits with Fe-filtered Co-Kα radiation (λ = 1.789 Å). The phases were identified using X'Pert Highscore Plus software. The relative phase amounts (wt.%) were estimated using the Rietveld method (Autoquan program). Fourier-transform infrared (FTIR) spectroscopy was used to determine the functional groups of halloysite. A powdered sample of the adsorbent material was analyzed using ALPHA II's Platinum attenuated total reflection (ATR) single reflection diamond module with the ATR method of analysis. The FTIR spectra were recorded using a FTIR spectrometer (Bruker, Alpha, USA) with a scan range of 450–4500 cm–1. Transmission electron microscopy (TEM) images were acquired using a JEM-2100F Field Emission microscope (JEOL, Japan). The point of zero charge (PZC) was determined using the solid addition method described by Izuagie et al. (Reference Izuagie, Gitari and Gumbo2016). The Brunauer–Emmett–Teller (BET) specific surface area was determined by N2 adsorption (Micromeritics Tristar II, Norcross, USA).
Adsorbent regeneration
The regeneration potential of halloysite was evaluated with 0.01 M NaOH. An adsorption experiment was performed using 2 g of clay, 50 mL of solution and a 10 mg/L concentration of each dye. The amount of dye adsorbed was noted and the adsorbent was dried in the oven for 12 h at 105°C. The adsorbent was then dispersed in 50 mL of 0.01 M NaOH solution and the dispersion was centrifuged at 50,000 rpm for 15 min. The adsorbent was washed by 50 mL MilliQ water, dried in an oven for 12 h at 105°C and cooled in a desiccator. The dried adsorbent was used for another adsorption experiment following the procedure described above. The same procedure using the same adsorbent was repeated three times.
Results and discussion
Characterization
X-ray diffraction results
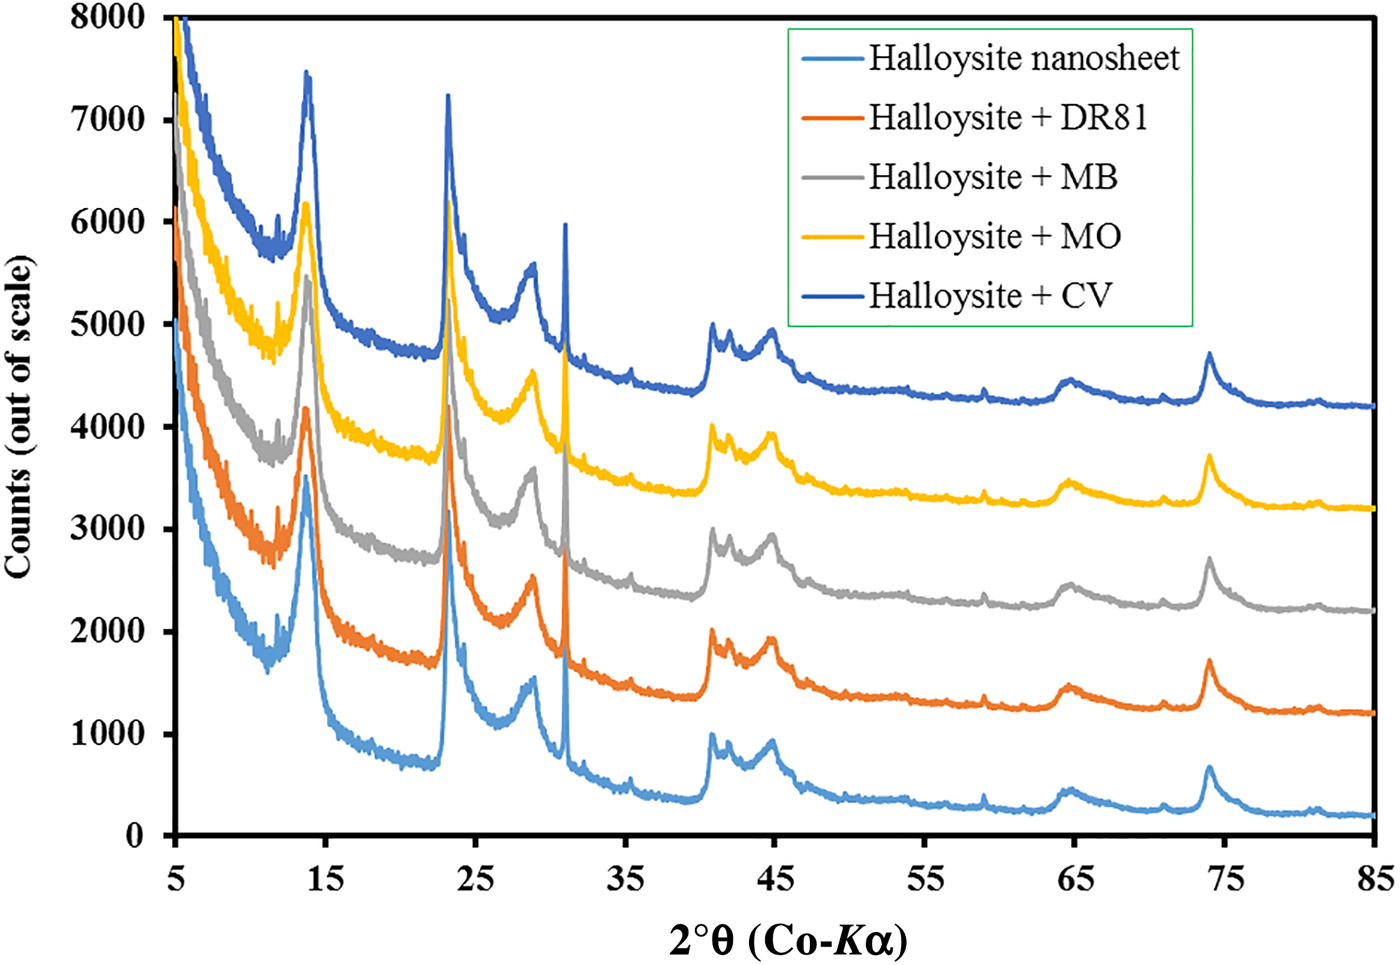
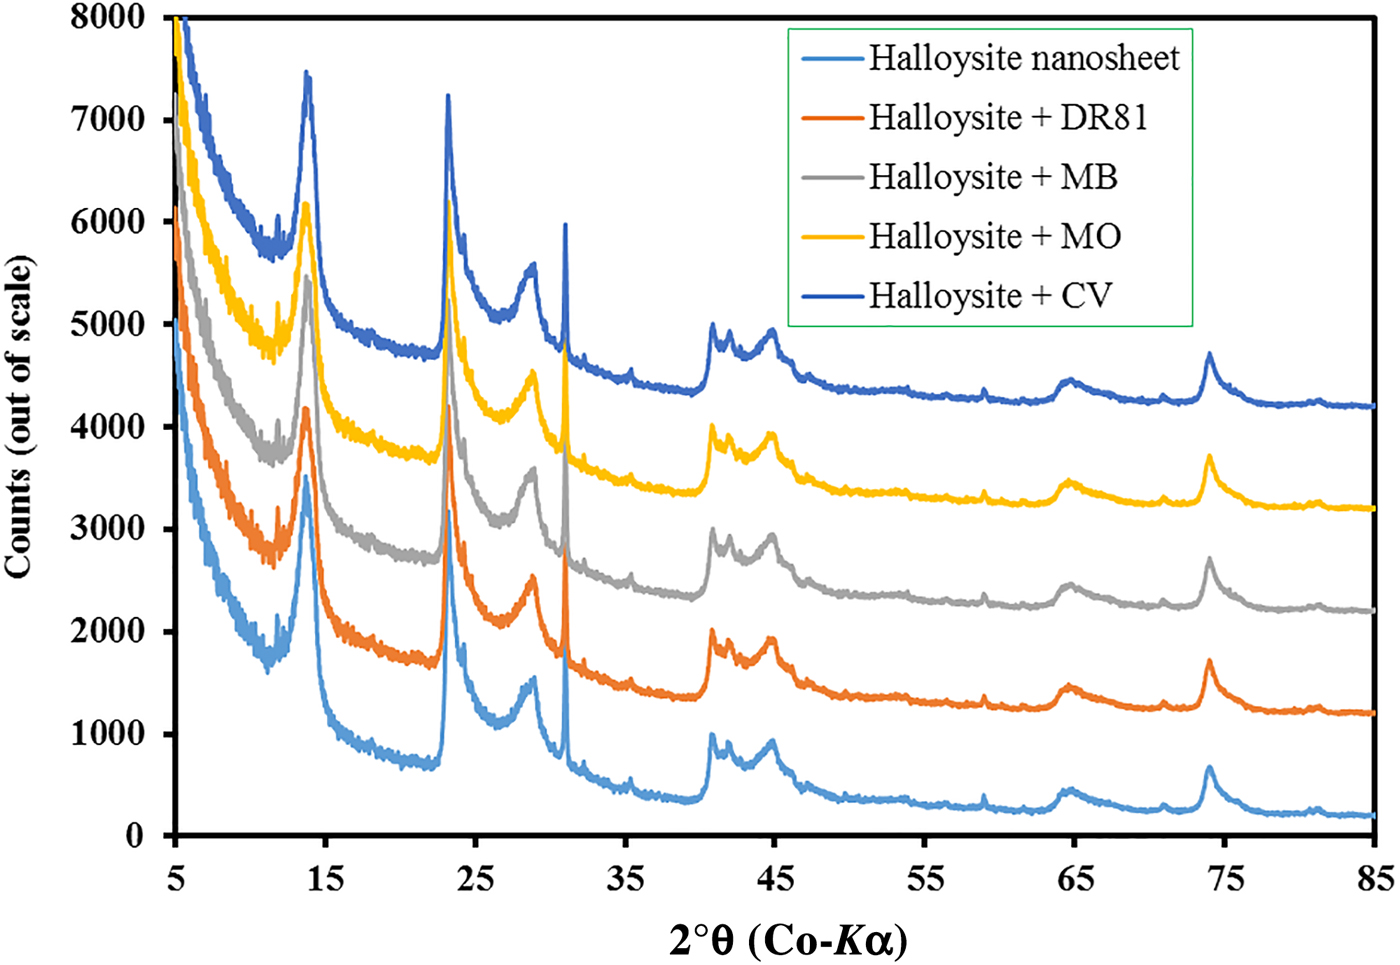
The XRD traces of the original halloysite and the halloysite after adsorption of DR81, MO, MB and CV dyes are shown in Fig. 1. There is no significant difference in the traces after adsorption of the dyes. The diffractograms showed sharp peaks at 13.95, 23.23 and 31.02°2θ. The results agree with previous reports on halloysite nanotubes (Jiang et al., Reference Jiang, Huang and Liu2015). The peaks identified are characteristic of quartz (SiO2), kaolinite (Al2Si2O5OH4) and halloysite (Al2Si2O5OH4) (Zhang et al., Reference Zhang, Fua and Yang2012). The similarity of raw halloysite and dye-adsorbed halloysite diffractograms indicates that the dye-adsorption process did not alter the crystallography or major mineral phases of the sample.
XRD traces of the original halloysite and the halloysite after adsorption of DR81, MO, MB and CV dyes.
FTIR results
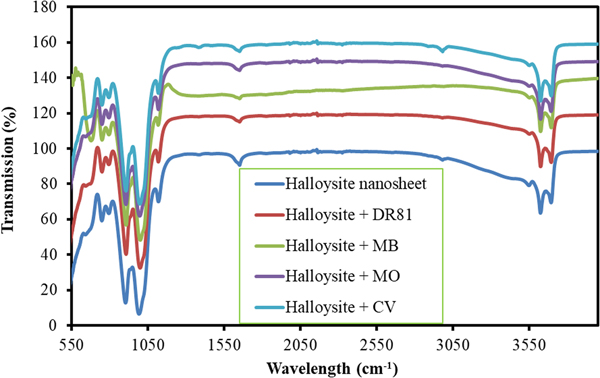
The FTIR spectra of raw halloysite and the halloysite after adsorption of DR81, MO, MB and CV dyes are shown in Fig. 2. The spectra display bands in the OH-stretching region (3700 cm–1) (Luo et al., Reference Luo, Zhao, Zhang, Liu, Yang and Liu2010) and bands associated with stretching and bending vibrations of the aluminosilicate framework (~1200 cm–1) typical of kaolin minerals (Prokop et al., Reference Prokop, Maziarz and Matusik2015). The bands at 3696 and 3623 cm–1 are due to the stretching vibrations of hydroxyl groups at the surfaces of the nanotubes (Xie et al., Reference Xie, Qian, Wu and Ma2011). Fourier-transform infrared analysis is an important tool for identifying the characteristic functional groups that might be responsible for dye binding (D'Souza et al., Reference D'Souza, Devi, Divya and Naik2008). There are no significant differences among the spectra before and after adsorption. Therefore, the functional groups (hydroxyls and aluminosilicate framework) noted in the FTIR spectra may not have been involved in the dye-removal process.
FTIR spectra of the original halloysite and the halloysite after adsorption of DR81, MO, MB and CV dyes.

TEM results
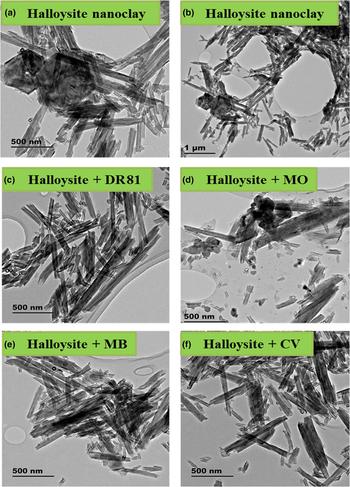
The TEM images of the original halloysite and the halloysite after adsorption of DR81, MO, MB and CV dyes are shown in Fig. 3. The original halloysite consists mainly of halloysite nanotubes, some of which exhibit hollow, rod-like structures (Joussein et al., Reference Joussein, Petit, Churchman, Theng, Righi and Delvaux2005; Ahmed et al., Reference Ahmed, Rasul, Martens, Brown and Hashib2010). The halloysite nanotubes are 500–700 nm long, and their inner and outer diameters are 40–60 nm. The nanotubes contain empty lumens, with some rod structures being inside the empty lumens (Fig. 3a,b). The nanotubes of halloysite after adsorption of dyes contain additional material on the external walls (Fig. 3c–f). Moreover, the halloysite maintains its tubular structure even after dye adsorption.
TEM images of the original halloysite (a,b) and the halloysite after adsorption of (c) DR81, (d) MO, (e) MB and (f) CV dyes.

SEM results
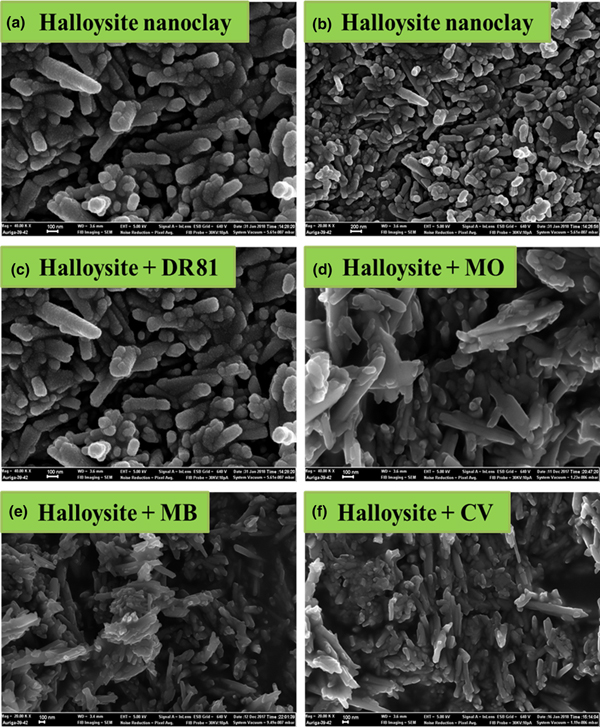
The SEM images of the original halloysite and the halloysite after adsorption of DR81, MO, MB and CV dyes are shown in Fig. 4. The halloysite consists of agglomerates of nanotubes with some irregularities in their diameters and wall thicknesses and a fibrous morphology (Kamble et al., Reference Kamble, Ghag, Gaikawad and Panda2012). The original halloysite has an uneven surface, which nevertheless is smoother compared to its counterpart after dye adsorption. After dye adsorption, the surface morphology changed considerably, which indicates that dye molecules were adsorbed onto the surface and interaggregate pores, because the halloysite surface is more uniform, especially after adsorption of MB and CV dyes (Fig. 4e,f). Previous studies also revealed that the surface of the adsorbent became more homogenous compared to the original materials (Sarma et al., Reference Sarma, Gupta and Bhattacharyya2016). In addition, the halloysite has a different morphology after adsorption of MO and CV (Fig. 4d,f). The images show the rod-like structures of the halloysite, clearly confirming the tubular nature of the clay. Figure 4d shows a homogenous surface consisting of fluffy flakes of various sizes and shapes. The fibrous surface topography of the clays is expected to increase the degree of unsaturation of the surface with dangled bonds and free valences, thus increasing the total specific surface area of the clay (Ngulube et al., Reference Ngulube, Gumbo, Masindi and Maity2017).
SEM images of the original halloysite (a,b) and the halloysite after adsorption of (c) DR81, (d) MO, (e) MB and (f) CV dyes.

BET results
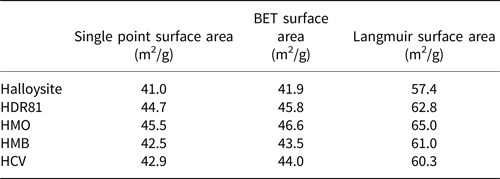
The large adsorption capacities of clay materials are largely due to their large specific surface areas (Cadena et al., Reference Cadena, Rizvi and Peters1990). The specific surface area of a clay is directly proportional to its adsorption capacity (Santos et al., Reference Santos, Oliveira and Boaventura2016; Sarma et al., Reference Sarma, Gupta and Bhattacharyya2016). The halloysite has a BET specific surface area of 41.94 m2/g (Table 1), which is greater than or comparable to other clays (Park et al., Reference Park, Ayoko and Frost2011; Gu et al., Reference Gu, Gao, Luo, Lu, Ye and Liu2014; Sari & Tuzen, Reference Sari and Tuzen2014). Comparison between the original halloysite (H) and its counterparts after dye adsorption (HDR81, HMO, HMB and HCV) showed an increase in the specific surface area after dye adsorption, with the greatest surface area being for HMO. A large specific surface area is associated with significant soil–water contaminant interaction, which indicates high reactivity (Pennel, Reference Pennell and Scott2016). Theoretical relationships for surfaces of various particle geometries show that surface area is controlled by the smallest particle size. With decreasing particle size, the specific surface area increases and the small particles tend to have platy and rod-like geometries (Santamarina et al., Reference Santamarina, Klein, Wang and Prencke2002). After adsorption of the four dyes, there is a clear change in the shape of the particles (Fig. 4), particularly with the adsorption of DR81 showing platy geometries; hence, this might have increased the specific surface area after dye adsorption. The kaolinite pores are more open, and this leads to a greater pore diameter of the slit-shaped pores in the structure (Boukhemkhem & Rida, Reference Boukhemkhem and Rida2017). As explained previously, the fibrous surface topography of the clays is expected to increase the degree of unsaturation of the surface with dangled bonds and free valences, thus increasing the total surface area of the clay (Ngulube et al., Reference Ngulube, Gumbo, Masindi and Maity2017).
Specific surface areas of the original halloysite (H) and the halloysite after adsorption of DR81 (HDR81), MO (HMO), MB (HMB) and CV (HCV) dyes.

Batch dye adsorption studies
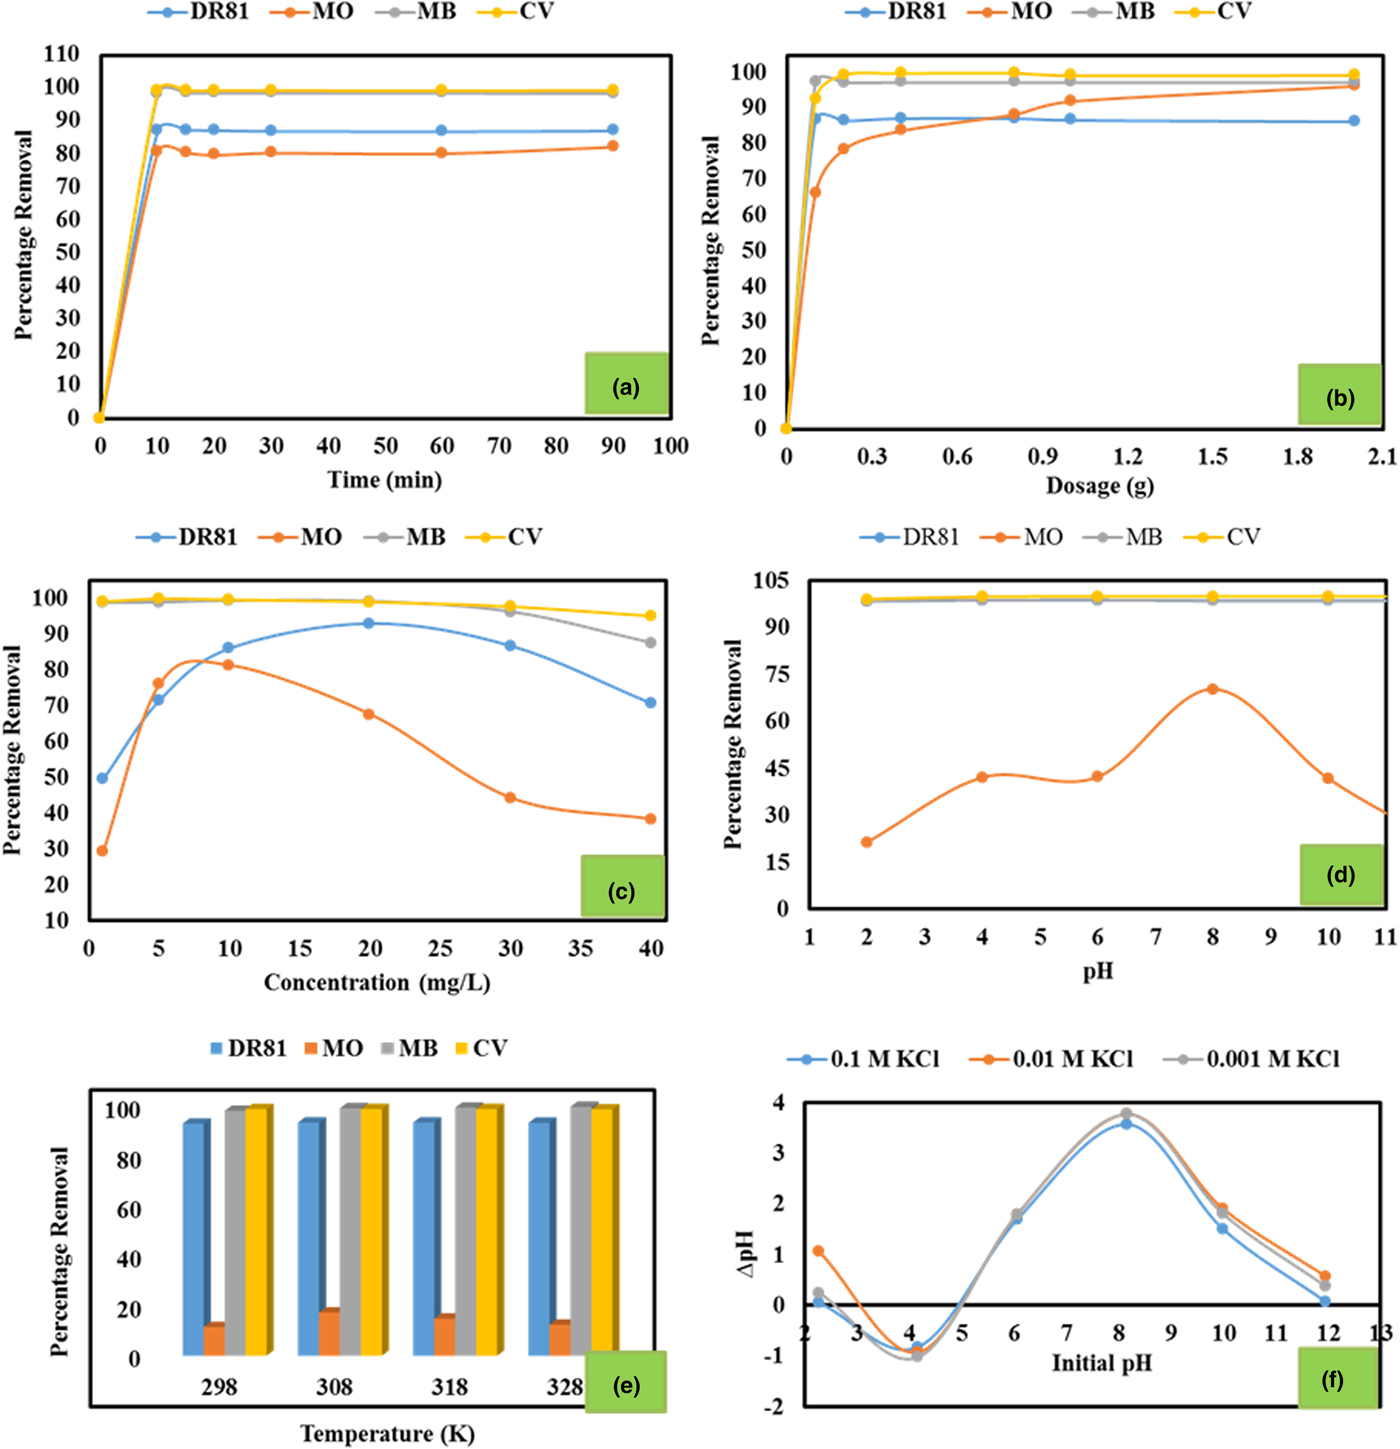
The effect of contact time, adsorbent dosage, initial concentration, pH, temperature and PZC on the adsorption of dyes is shown in Fig. 5.
Removal of DR81, MO, MB and CV dyes by halloysite as a function of (a) contact time, (b) halloysite dosage, (c) initial dye concentration, (d) pH, (e) temperature and (f) PZC.

Effect of time
The kinetics of the adsorption determine the optimum time at which equilibrium is attained. Depending on wastewater-process design, this information may be used in wastewater-treatment plants. The results of kinetic tests are shown in Fig. 5a. The adsorption of all dyes was comparable for all of the contact times used. The removal of MB and CV was almost complete (98–99%), that of DR81 was slightly lower (86–87%) and finally that of MO was the lowest (79–80%). The near-constant percentage of removal after 30 min indicates that the adsorbent was approaching its optimum performance; hence, 30 min was selected as the optimum contact time for subsequent experiments.
Effect of adsorbent dose
The effect of adsorbent dosage is illustrated in Fig. 5b. With increasing adsorbent dose, the percentage of removal of the dyes increased, similarly to previous studies (Ciesielczyk et al., Reference Ciesielczyk, Bartczak, Zdarta and Jesionowski2017). Increasing adsorbent dosage at a constant volume and dye concentration leads to the saturation of adsorption sites. Due to the formation of aggregates at higher doses, there might be a decrease in adsorption capacity because aggregation would lead to a decrease in total surface area of the adsorbent and increased diffusion path length (Sarma et al., Reference Sarma, Gupta and Bhattacharyya2016).
Effect of initial dye concentration
The effect of initial dye concentration is shown in Fig. 5c. By increasing initial dye concentration to 20 mg/L, the percentage of removal of DR81 and MO increased, decreasing at higher concentrations. However, the percentage of removal of CV and MB showed a different trend, decreasing gradually with increasing initial dye concentration from 1 to 40 mg/L. This observation is in accord with previous studies (e.g. Anirudhan & Ramachandran, Reference Anirudhan and Ramachandran2015) in which the concentration of the dye was a driving force for overcoming the mass transfer resistance of dye molecules between the solid and the aqueous phases. At low dye concentrations, there are more active sites available for adsorption; hence, at this stage, adsorption is independent of initial concentration. However, with increasing concentration, the available sites are occupied and ultimately a decrease in dye removal is observed (Ogunmodede et al., Reference Ogunmodede, Ojo, Adewole and Adebayo2015).
Effect of pH
The pH affects the adsorption of dyes because it affects the surface characteristics of the adsorbent (Ngulube et al., Reference Ngulube, Gumbo, Masindi and Maity2018). The pH of a solution determines the degree of protonation of exchange sites of the adsorbate due to variable charge, thereby influencing the specific charge of exchange sites and eventually the adsorption tendency of the adsorbent (Tomar et al., Reference Tomar, Prasad and Kumar2014). In the present study, the pH had a negligible influence on the removal of the DR81, MB and CV dyes in the pH range 2–12 (Fig. 5d), in accordance with previous studies (Santos et al., Reference Santos, Oliveira and Boaventura2016). For MO, maximum removal (70.24%) was observed at pH 8, being lower than 40% for the remaining pH values. The MO molecules have different charges at different pH values (Subbaiah & Kim, Reference Subbaiah and Kim2016). The dissociation constant (pKa) for MO is 3.46 (Arshadi et al., Reference Arshadi, Mousavini, Amiri and Faraji2016); hence, the MO species will mainly exist as monovalent anions at this equilibrium pH. Below and above this pH, the MO will go through a protonation process that will determine its charge. Due to the protonation reaction (≡RN(CH3)2 + H+ → ≡RNH+(CH3)2), MO is positively charged at pH < 3.76 (Yao et al., Reference Yao, Bing, Feifei and Xiaofeng2011). In addition, the halloysite surface is also positively charged; hence, adsorption is limited because of repulsive forces between the surface and the positively charged MO particles. With increasing pH, the MO has fewer positive charges. Hence, the enhanced MO adsorption on halloysite is attributed to hydrogen bonding, electrostatic attraction and strong surface complexation (Xiang et al., Reference Xiang, Zhang, Zhang, Tang and Wang2014). At alkaline pH up to 12, the electrostatic repulsion and OH– competition lead to a decrease in the adsorption of anions (Cheah et al., Reference Cheah, Hosseini, Khan, Chuah and Choong2013).
Effect of temperature
Generally, temperature has a significant effect on reaction rate. With increasing temperature, chemical reaction rate also increases (Mekatel et al., Reference Mekatel, Amokrane, Aid, Nibou and Trari2015). Therefore, temperature might affect adsorption. An increase in adsorption capacity with temperature indicates an endothermic reaction whereas a decrease in adsorption capacity with increasing temperature indicates an exothermic process (Zulfikar, Reference Zulfikar2013). In the present study, temperature variations did not affect significantly the removal of all four dyes, indicating that there is no need to adjust temperature in order to effectively remove dyes from aqueous solutions using halloysite (Fig. 5f).
Point of zero charge studies
The PZC determines the type of surface-active centres on the adsorbent, which affect the adsorption processes (Yagub et al., Reference Yagub, Sen, Afroze and Ang2014). Adsorption of positively charged dyes is enhanced at pH > PZC due to the presence of functional groups such as hydroxyl ions on the surface, whereas adsorption of negatively charged dyes is enhanced at pH < PZC, because the surface of the adsorbent is positively charged (Ngulube et al., Reference Ngulube, Gumbo, Masindi and Maity2017). When the pH is higher than the PZC, the surface charge of halloysite is negative, while it is positive when the pH is lower than the PZC. The PZC of the halloysite used in this study is 5 (Fig. 5f). It would be expected that the adsorption of MB and CV would be greatest at pH > 5 and those of DR81 and MO would be greatest at pH < 5. However, the variation of pH did not affect the removal of the dyes, except for MO (Fig. 5d), suggesting that the adsorption of the remaining three dyes was not predominantly dependent on the surface charges of halloysite.
Treatment of real industrial effluent
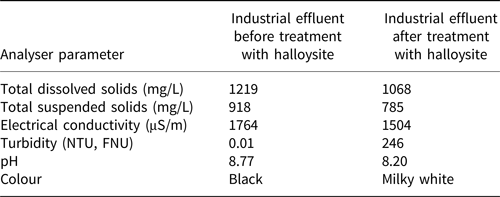
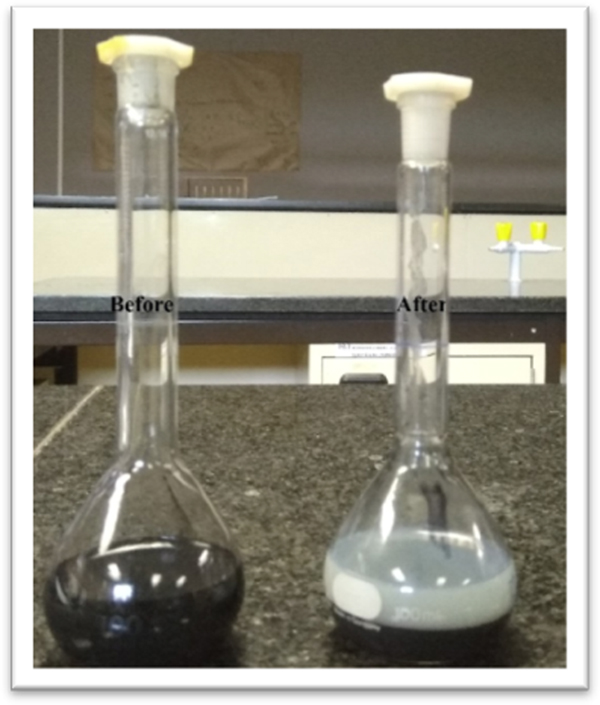
The physical characterization of textile mill raw wastewater has been carried out for colour, total dissolved solids, electrical conductivity, turbidity, total suspended solids and pH. The results of the wastewater characteristics before and after treatment with halloysite nanoclay are presented in Table 2 and the progress of the reaction is illustrated in Fig. 6. The wastewater is classified as ‘high-strength wastewater’ (Benefield, Reference Benefield2002). After treatment with halloysite clay at the optimum conditions determined from the batch study, the wastewater could be characterized as medium-strength wastewater. The dye-removal rates were 79.25%, 90.01%, 92.22% and 92.22% for DR81, MO, MB and CV dyes, respectively. The colour of the textile wastewater changed from black to milky white after treatment (Fig. 6).
Characterization of actual industrial effluent.

FNU = Formazin Nephelometric Unit; NTU = Nephelometric Turbidity Unit.
Real industrial effluent before and after treatment with halloysite nanoclay.

Adsorption kinetics studies
Adsorption kinetics are important in determining the effectiveness of adsorption. In this study, two models were used to predict the adsorption kinetics of DR81, MO, MB and CV onto halloysite.
The pseudo-first-order model
The linear form of the pseudo-first-order model was described by Ho & McKay (Reference Ho and McKay1998) and it can be expressed as:
 $$\log (q_e-q_t) = {\rm log}\lpar {q_e} \rpar -\left( {\displaystyle{{{\rm k}_1t} \over {2.303}}} \right)$$
Where q e (mg/g) is the adsorption capacity at equilibrium, q t (mg/g) is the adsorption capacity at time t and k1 (1/min) is the rate constant.
Pseudo-second-order model
The pseudo-second-order model, which has been applied for analysing chemisorption kinetics on solid phases from liquid solutions (Ho, Reference Ho2006), is expressed linearly as:
 $$\displaystyle{t \over {q_t}} = \left( {\displaystyle{1 \over {q_e}}} \right)t + \left( {\displaystyle{1 \over {{\rm k}_2q_e^2}}} \right)\; $$
where k 2 is the rate constant (g/mg/h) and  ${\rm k}_2q_e^2 $ (mg/g/h) is the initial adsorption rate.
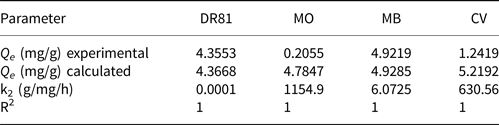
The fitting between experimental data and the model-predicted values was expressed by the coefficient of determination, R2. The curves of the plots are given in the Supplementary Material, and the calculated kinetic parameters and the corresponding linear regression correlation coefficient R2 values are summarized in Table 3. There is good agreement between experimental and calculated q e values for DR81 and MB dyes. The coefficients of determination for the pseudo-second-order kinetics model (R2) are all equal to 1, indicating the applicability of this kinetic model and the second-order nature of the adsorption process of the dyes onto halloysite clay. These results imply that the chemisorption mechanism may play an important role in the adsorption of DR81, MO, MB and CV dyes.
The pseudo-second-order parameters for the adsorption of DR81, MO, MB and CV dyes onto the halloysite clay.

Adsorption isotherm studies
An adsorption isotherm describes the relationship between the amount of adsorbate adsorbed by the adsorbent and the remaining adsorbate concentration in the solution at equilibrium. Adsorption equilibrium studies were performed using two adsorption isotherms.
The Langmuir isotherm describes the formation of a monolayer adsorbate on the outer surface of the adsorbent, beyond which no further adsorption takes place (Langmuir, Reference Langmuir1918). The isotherm is expressed by the following equation:
 $$\displaystyle{{C_e} \over {q_e}} = \left( {\displaystyle{1 \over {Q_m}}} \right)C_e + \displaystyle{1 \over {Q_m{\rm b}}}\; \; $$
where C e is the equilibrium concentration (mg/L), Q e is the amount adsorbed at equilibrium (mg/g), b represents the Langmuir isotherm constant (L/mg) and Q m is the maximum adsorption capacity (mg/g) for complete monolayer coverage.
The separation factor (R L) was calculated from the following equation:
 $${\rm \;} R_{L\;} = \; \displaystyle{1 \over {\lpar {1\; +{\rm b}C_{o}} \rpar }}$$
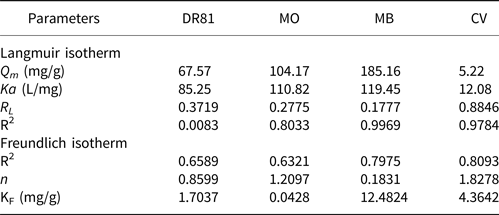
where C o is the initial concentration (mg/L). R L values between 0 and 1 indicate favourable adsorption (0 indicates irreversible adsorption, 1 suggests linear adsorption), while a value greater than 1 indicates unfavourable adsorption.
The Freundlich isotherm is commonly used to describe heterogeneous systems (Freundlich, Reference Freundlich1906). The model is represented in linear form via the following equation:
 $${\rm log}Q_e = \; {\rm nlog}C_e + {\rm log}{\rm K}_{\rm F}\; $$
where KF (mg/g) and n are the Freundlich constants describing the adsorption capacity and intensity, respectively. The constants n and KF are determined from the slope and the intercept, respectively, of the plot logQ e versus logC e. Values of n between 1 and 10 indicate favourable adsorption (Kadirvelu & Namasivayam, Reference Kadirvelu and Namasivayam2000).
The equation parameters of the equilibrium models give insight into the adsorption mechanism, surface properties and affinity of the adsorbent for the adsorbates. The Langmuir isotherm yielded high coefficients of determination for MO, MB and CV dyes, this being the best-fitting model for adsorption of the dyes onto halloysite (Table 4). In contrast, the Freundlich isotherm yielded low correlation coefficients for all of the dyes, hence the parameters of the Langmuir isotherm were used to describe the mechanism of adsorption. In accordance with this study, Hajjaji et al. (Reference Hajjaji, Andrejkovičová, Pullar, Tobaldi, Lopez-Galindo, Jammousi and Labrincha2016) used the Langmuir isotherm model parameters to fit their results, suggesting that the adsorption corresponds to monolayer coverage of MB molecules over the kaolinite surface. The dimensionless equilibrium separation factor, R L, for all of the dyes was <1, indicating that dye adsorption was a favourable process.
Parameters of the Langmuir adsorption isotherms for the adsorption of DR81, MO, MB and CV dyes onto the halloysite clay.

Thermodynamic study
The enthalpy ∆H° (kJ/mol) and entropy ∆S° (J/mol/K) of the adsorption were determined using Eqs 6 and 7.
The standard free energy change during adsorption, ΔG°, was calculated from the following equation:
 $$\Delta G^\circ = \; -{\rm R}T \!\ln \!{\rm Ka}$$
where ΔG is the free energy of sorption (kJ/mol), T is the temperature in K, R is the universal gas constant (8.314 J/mol/K) and Ka is the sorption equilibrium constant.
The sorption equilibrium constant Ka can be expressed in terms of enthalpy change (ΔH) and entropy change (ΔS) as a function of temperature:
 $${\rm lnKa} = \displaystyle{{\Delta H^\circ} \over {{\rm R}T}} + \displaystyle{{\Delta S^\circ} \over {{\rm R}T}}\; $$
where ΔH° is the heat of sorption (kJ/mol) and ΔS° is the standard entropy change (kJ/mol/K).
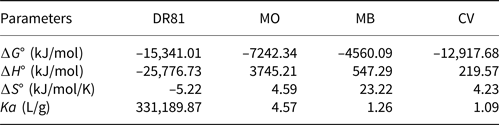
The calculated values for the thermodynamic parameters are listed in Table 5. The enthalpy of activation, ∆H°, is positive for all of the dyes except for DR81, indicating that the adsorption of MO, MB and CV dyes on the halloysite clay is endothermic, whereas that of DR81 dye is exothermic. The adsorption of all the dyes was spontaneous, as symbolized by the negative free energy of sorption values (–∆G°). The negative value of entropy change, ∆S°, for DR81 indicates that no significant changes occurred at the activation stage. A negative value of ΔS° suggests that the adsorption process involves an associative mechanism. The adsorption occurs through the formation of an activated complex between the adsorbate and adsorbent, thus representing the activation stage at that level of reaction. Spontaneous adsorption of chemical species on stevensite was also reported by Hajjaji et al. (Reference Hajjaji, Beraa, Coppel, Laurent and Caminade2018). However, in the case of MO, MB and CV, the entropy change values were positive, indicating that there was a change in the internal structure of the halloysite during adsorption (Ofomaja et al., Reference Ofomaja2010).
Thermodynamic parameters for the adsorption of DR81, MO, MB and CV dyes onto the halloysite clay.

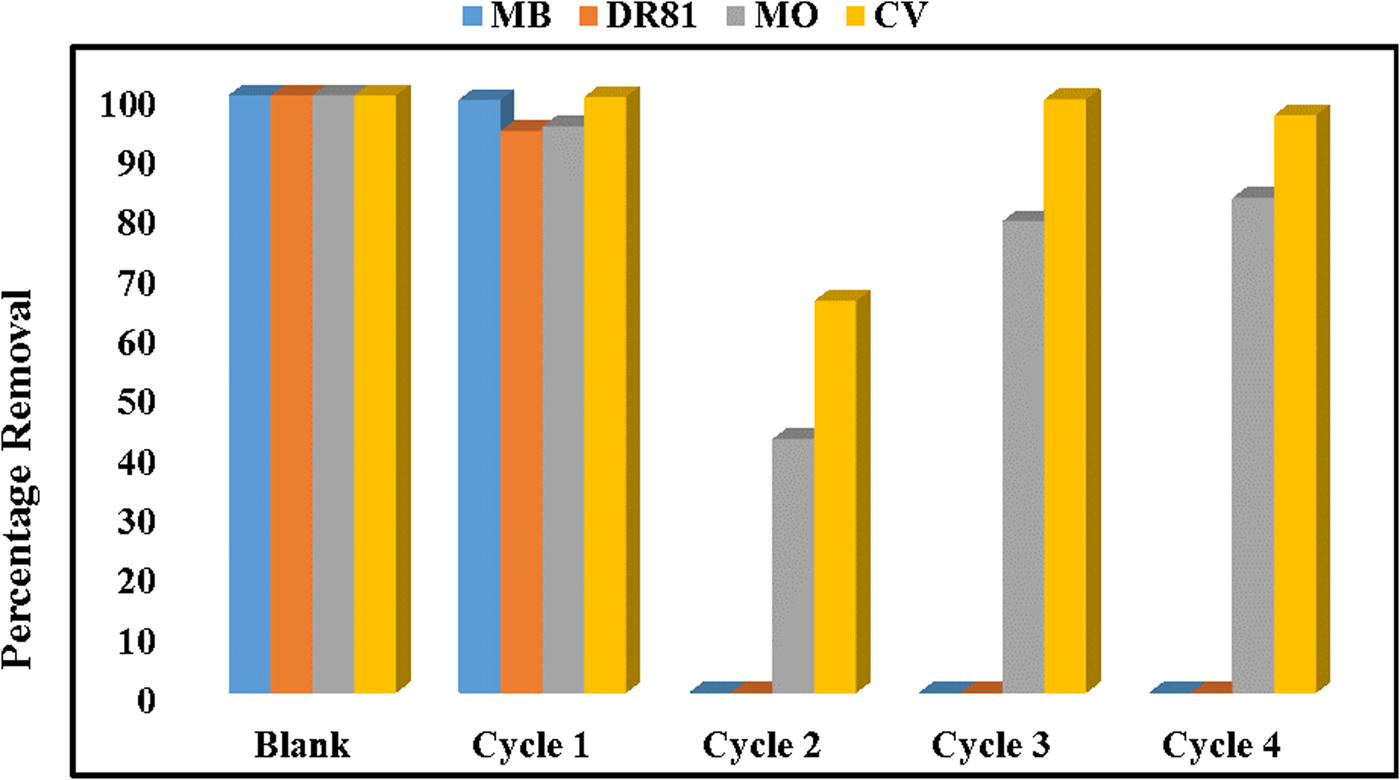
Regeneration studies
The results of the regeneration of the halloysite clay for the removal of acidic and basic dyes from aqueous solutions are shown in Fig. 7. The spent adsorbent has less adsorption capacity than the original adsorbent. The halloysite displayed a similar trend after adsorption of MB and DR81 dyes, whereas this trend was different after adsorption of CV and MO dyes. After one adsorption cycle with MB and DR81 dyes, the spent adsorbent lost its capacity to remove dyes on successive cycles. By contrast, after one adsorption cycle, the adsorption capacity for CV and MO dyes decreased after the first regeneration cycle, but for successive cycles, the dye removal increased as the halloysite was regenerated. This behaviour indicates that the adsorption of CV and MO dyes is chemical in nature. The adsorption was reversible and the adsorbed CV and MO dyes were almost completely recovered with the alkaline solution. A probable explanation for this behaviour would be that MO is an acidic dye causing electrostatic interactions with the alkaline solution and hence reversible reactions. CV is a water-soluble organic compound with a violet cation. Adding NaOH converts the cation into a carbonyl base, and the polarity of oxygen also makes the α-hydrogens of carbonyl compounds much more acidic, causing possible acid–base electrostatic attractions (Cannon et al., Reference Cannon, Gammon and Hunsberger1994).
Regeneration of the halloysite clay.

Dye-adsorption mechanisms
The adsorption studies and characterization might allow the proposition of mechanisms for the adsorption of the anionic and cationic dyes on the halloysite clay. For clays, it is expected that the solution pH and ultimately the PZC influence the adsorption of anionic and cationic molecules depending on the extent of protonation of the adsorbate and the adsorbent. According to the PZC results, it is anticipated that the adsorption of MB and CV would be greatest at pH > 5 and that of DR81 and MO would be greatest at pH < 5. However, Fig. 5d shows that the variation of pH had a negligible influence on the percentage of removal of the dyes, except for MO. This might suggest that the solution pH did not cause notable protonation of the ions in solution and subsequently the impact of pH on the dye uptake process was negligible. Similarly the FTIR spectra did not show any notable activity or change of the functional groups before and after adsorption of the dyes (Fig. 2).
Nonetheless, the overall observation was that, of the four dyes, MO had the lowest percentage of dye removal. The molecular size of the adsorbates also affects adsorption. Large molecules might not be adsorbed because their size prevents their diffusion into the pores of the adsorbent. The chemical formulae and molecular weights of DR81, MB, CV and MO are C29H19N2O8S2 (675.598 g/mol), C16H18N3ClS.xH2O (319.850 g/mol), C25N3H30Cl (407.979 g/mol) and C14H14N3NaO3S (327.334 g/mol), respectively. Hence, MO has the second smallest molecule, and if molecular size had affected the adsorption of the dyes, MO would have presented a greater percentage of removal compared to MB and DR81.
As the dye uptake could not be explained in terms of molecular size, pH variation or characterization results, the adsorption mechanism will have to be discussed in light of the isotherm and kinetic modelling results. The pseudo-second-order model showed the best fit with the experimental data for all four of the dyes, whereas the Langmuir isotherm model described accurately the adsorptions of MB, CV and MO, but not that of DR81. Hence, the adsorption mechanisms may involve complexation or ion exchange between the dye ions and the surface ions or SiO2 or Al2O3 groups on the clay surfaces. The halloysite clay displayed relatively high Langmuir adsorption capacities for all of the dyes and therefore most of the dye ions might have been held in a monolayer on the clay surface.
According to Errais et al. (Reference Errais, Duplaya, Elhabiri, Khodja, Ocampo, Baltenweck-Guyot and Darragi2012), depending on the type of clay, the possible processes involved in dye adsorption can be summarized in the following processes:
Process 1: The polyvalent metal cations (Si4+ and Al3+) found on edge sites of the clay contribute to the surface charge being positive, hence forming bridges between the particles of the clay and organic anions, allowing anionic dyes such as DR81 to be adsorbed.
Process 2: In basic pH conditions and at the particle edges of dissociated aluminol groups, OH groups may be substituted by anions (Errais et al., Reference Errais, Duplaya, Elhabiri, Khodja, Ocampo, Baltenweck-Guyot and Darragi2012).
Process 3: Halloysite is a kaolinite clay and these clays have a net layer charge of zero (Sarma et al., Reference Sarma, Gupta and Bhattacharyya2011). However, a small net negative charge may arise from broken edges on the clay crystals. This negative charge may be responsible for holding the cations to the clay surface through coulombic interactions. The charge on the edges is due to protonation or deprotonation of surface hydroxyl groups (Kausar et al., Reference Kausar, Iqbal, Javeda, Aftab, Nazli, Bhatti and Nouren2018).
In general, the uptake of dye molecules by clay minerals is due to the trapping of dye molecules by exchangeable ions and the protonated edges of the clay layers.
Comparison with other studies
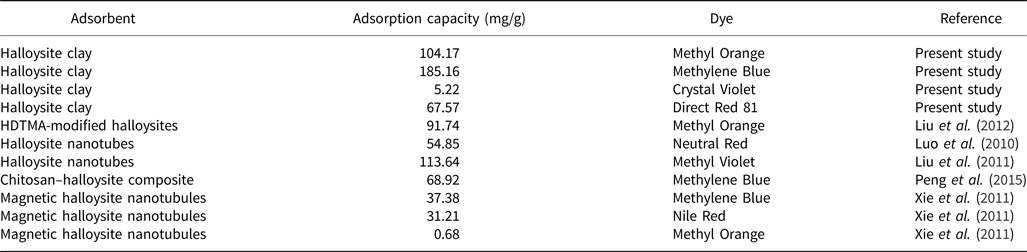
Table 6 illustrates the comparison of the adsorption capacity of halloysite with other clay-based adsorbents. The adsorption capacity of the halloysite clay used for this study for MO, MB and DR81 dyes is greater than the capacities of other halloysite clays, whereas the capacity for the removal of CV dye is notably lower. This difference might be attributed to the various operational parameters used during the adsorption experiments and to the various chemical modifications performed on the clay before use. Thus, the halloysite used may be considered as an effective option for the removal of both acidic and basic dyes from aqueous media.
Adsorption capacities for various adsorbent materials used to remove dyes.

HDTMA = hexadecyltrimethylammonium.
Conclusion
The removal of DR81, MO, MB and CV dyes from aqueous solution was carried out using a halloysite clay as an adsorbent. The optimum contact time for the interaction of the adsorbent with dye effluent was 30 min. The pseudo-second-order kinetic model described sufficiently the adsorption, yielding a perfect coefficient of determination (R2 = 1) for all of the dyes. The Langmuir model described the adsorption process better than did the Freundlich model in the order MB > CV > MO > DR81 in terms of the R2 values. The untreated halloysite clay is an effective material for adsorbing acidic and basic dyes at a normal temperature and pH of solution. The results have established the potential for the halloysite clay to be used as an adsorbent for the removal of dyes from wastewater in the textile industry.
Supplementary material
To view supplementary material for this article, please visit https://doi.org/10.1180/clm.2019.27
Author ORCIDs
T. Ngulube, 0000-0003-0725-2203.
Acknowledgements
The authors thank the University of Venda, National Research Foundation (NRF), Water Research Commission (WRC) for funding.