INTRODUCTION
The cuticles of most herbage species that are used as feedstuffs for horses contain remarkable quantities of predominantly odd-chain aliphatic alkanes as compounds in integrated and superimposed waxes (Dove et al. Reference Dove, Mayes and Freer1996; Koch & Ensikat Reference Koch and Ensikat2008). Plant and even-chain synthetic alkanes can be used to estimate feed intake and apparent digestibility (Mayes et al. Reference Mayes, Lamb and Colgrove1986; Ordakowski et al. Reference Ordakowski, Kronfeld, Holland, Hargreaves, Gay, Harris, Dove and Sklan2001; Smith et al. Reference Smith, Mayes, Hollands, Cuddeford, Yule, Malo Ladrero and Gillen2007), but seem to be unsuitable when faeces quantity is unknown. Particularly in digestion trials, it is necessary to correct faecal alkane concentrations because faecal recovery is irregular and often incomplete, although horses have the highest rates among livestock species (Ferreira et al. Reference Ferreira, Celaya, García, Rodrigues and Osoro2009). Faecal output quantification by total collection can impair animal welfare, restrict exercise, and can affect the estimation of digestibility (Pagan et al. Reference Pagan, Harris, Brewster-Barnes, Duren and Jackson1998). Moreover, it is hard to implement in horses kept in groups or on a pasture.
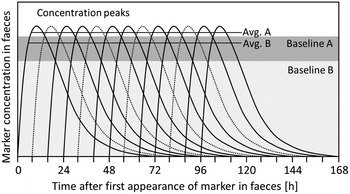
A link may exist between the interval of mealtimes or bolus administration, gut passage dynamics, and resulting faecal concentration patterns, regardless of marker type and animal species (Haenlein et al. Reference Haenlein, Smith and Yoon1966; Cuddeford & Hughes Reference Cuddeford and Hughes1990; Dove & Mayes Reference Dove and Mayes1991; Giráldez et al. Reference Giráldez, Lamb, López and Mayes2004; Molina et al. Reference Molina, Matamoros and Pell2004; Smith et al. Reference Smith, Mayes, Hollands, Cuddeford, Yule, Malo Ladrero and Gillen2007). Figure 1 provides a hypothetical explanation of the development of diurnal alkane concentration patterns in faeces after repeated administration by feed or bolus. Every single meal or bolus results in a specific excretion curve, as shown by Hyslop (Reference Hyslop and Alliston2003) and Rosenfeld et al. (Reference Rosenfeld, Austbø and Volden2006) in horses, that spans approximately 72 h after first appearance of the marker in faeces (Pagan et al. Reference Pagan, Harris, Brewster-Barnes, Duren and Jackson1998). Single curves continuously follow and partly overlay one another. A specific diurnal pattern is the result of overlapped decreasing curves starting from every meal or dose of the 3 days before, and increasing curves starting from meals or doses of the actual day, considering the specific transit time of the marker. Numerous additional factors, such as diet composition (Van Weyenberg et al. Reference Van Weyenberg, Sales and Janssens2006), variable profiles of alkanes in feedstuffs (Dove et al. Reference Dove, Mayes and Freer1996), exercise (Pagan et al. Reference Pagan, Harris, Brewster-Barnes, Duren and Jackson1998), short-term stress and individual gut peristalsis may also alter marker passage and contribute to individual characteristics of alkane concentration patterns in faeces.
Hypothetical explanation of marker concentration dynamics in faeces after repeated administration by feed (3 times a day) or bolus (2 times a day). Each curve follows a mealtime or bolus administration in consideration of the marker's transit time; however, dashed curves do not appear for bolus administration. The baselines A and B indicate the basic concentration of feed markers (A) or bolus markers (B). The horizontal lines for average (Avg.) A and B indicate the average concentration of A or B after repeated administration.

It was hypothesized that (i) during specific timeframes within the day, dry matter (DM) and alkane concentrations of spot samples of faeces accurately reflect their average; (ii) this context can be used to compensate incomplete alkane faecal recovery (AFR); and (iii) this context can be used to estimate DM intake (DMI) and apparent digestibility (DMD) without correction for unbalanced AFR.
The aim of the current study was to test the above-mentioned hypotheses in horses with typical mealtime feeding of a hay-based diet.
MATERIALS AND METHODS
Animals and diets
Five Saxonian Warmblood horses (three mares and two geldings), with an average body weight of 555 ± 60·8 kg, were used in the current study. The horses' ages ranged from 13 to 17 years.
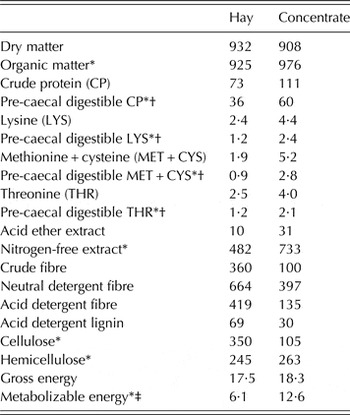
The horses received meadow hay (12·0 kg/day) and crushed oats-barley mix (1 : 1) dependent upon individual rates of exercise (0·9 ± 0·38 kg/day). The chemical composition of offered feedstuffs is provided in Table 1. The nutritive value of the diets was assessed on the basis of metabolizable energy (ME) according to Kienzle & Zeyner (Reference Kienzle and Zeyner2010), as well as of pre-caecal digestible crude protein (pcdCP) and pre-caecal digestible amino acids (pcdAA) lysine (pcdLYS), methionine + cysteine (pcdMET + CYS) and threonine (pcdTHR) according to Zeyner et al. (Reference Zeyner, Kirchhof, Susenbeth, Südekum and Kienzle2015). Feeding levels, expressed as a manifold of maintenance, were 1·32 ± 0·045 (ME), 1·30 ± 0·079 (pcdCP), 1·07 ± 0·063 (pcdLYS), 1·29 ± 0·073 (pcdMET + CYS) and 0·86 ± 0·052 (pcdTHR) following official recommendations of GfE (2014). The horses had free access to tap water. Meals were offered three times a day (at 07.00, 15.00 and 21.30 h) in equal amounts and were consumed entirely.
Analysed chemical composition of feedstuffs offered during the experiment

Nutrient values are given in g/kg dry matter (DM), energy contents in MJ/kg DM.
* Calculated on the basis of analysed nutrient or energy contents.
† Calculations refer to: Zeyner et al. (Reference Zeyner, Kirchhof, Susenbeth, Südekum and Kienzle2015).
‡ Calculations refer to: Kienzle & Zeyner (Reference Kienzle and Zeyner2010).
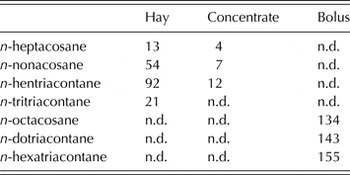
The concentration of plant alkanes in diet components and quantities of synthetic alkanes in boluses are shown in Table 2.
Analysed concentration of plant alkanes in diet components, and quantities of synthetic alkanes in boluses

n.d., not detectable.
Alkane concentrations are given in mg/kg dry matter (DM), alkane quantities in boluses in mg (in DM).
Bolus preparation
Throughout the experimental period, horses were offered a bolus containing similar amounts of n-octacosane (C28), n-dotriacontane (C32) and n-hexatriacontane (C36) by hand twice a day (07.00 and 21.30 h). Dosages were as described in Smith et al. (Reference Smith, Mayes, Hollands, Cuddeford, Yule, Malo Ladrero and Gillen2007). For the preparation of boluses, crystalline alkanes (Sigma Aldrich Chemie GmbH, Steinheim, Germany) were weighed into gelatine capsules separately, then embedded into a pastry made of oat flakes, wheat flour, sugar beet syrup (mixed by weight: 1 : 0·6 : 1) and water, and were subsequently baked for 20 min at 180 °C. All horses consumed the boluses completely.
Animal management and experimental design
Horses from the Reitgestüt Knauthain GmbH, Leipzig (Saxony, Germany) were used in the current experiment and were kept and cared for in accordance with the Federation of Animal Science Societies' Animal Care Guidelines (FASS 2010). During the experiment in October and November 2012, horses were housed in single boxes fitted with rubber mats. To ensure a hygienic setting, excreted urine was removed immediately. The horses had free exercise in a ‘paddock’ with a concrete floor, or by being ridden, for approximately 1 h/day.
The animals were adapted to test conditions 5 days prior to quantitative collection of faeces. Samples of feedstuffs were obtained once a day and combined to bulk samples specific for diet components. Over 3 days, every defecation was collected, a sample taken and stored at –20 °C. Additionally, aliquot sub-samples (0·05) were combined to bulk samples for individual horses.
Alkane analysis
Lyophilized samples of feedstuffs and faeces were ground to pass through a 0·5 mm sieve in a standard laboratory sample mill. To reduce alkane loss during sample preparation, sub-samples of boluses (n = 10) had been pre-milled with water-cooling, then parted and milled with the aid of liquid nitrogen at a constant – 196 °C using a Retsch® CryoMill (Retsch® GmbH, Haan, Germany; settings: 25 ml cup, one 14 mm steel ball, 2 min for each iteration). All samples were dried to constant weight to determine total DM content. Alkane extraction and gas-chromatographic analysis (GCA) were conducted as described in Elwert et al. (Reference Elwert, Kluth and Rodehutscord2004). Briefly, samples of feedstuffs, boluses and faeces underwent saponification in ethanolic potassium hydroxide (4 h at 90 °C), hot extraction of lipophilic compounds (at 75 °C), and purification through silica-gel columns. The GCA was performed using a Shimadzu GC-2010 FID unit (Shimadzu Corp., Kyoto, Japan) with on-column injection onto an Rtx®-1 w/Integra-Guard™ column (Restek Corp., Bellefonte, PA, USA). Alkane concentrations were calculated from peak area ratios of target alkanes and internal standards n-docosane and n-tetratriacontane, which had been added to each sample tube before chemical preparation. The retention times of alkane peaks, as well as any device-specific discrimination, were determined using a standard solution of homologous alkanes between n-docosane and n-octatriacontane. The peak areas had additionally been corrected for any discrimination of higher-molecular alkanes that might have occurred during solvent extraction (Oliván & Osoro Reference Oliván and Osoro1999).
Additional chemical analyses
The gross energy content of feedstuffs and faeces bulk samples was obtained by bomb calorimetry (C7000 Oxygen Bomb Calorimeter, IKA® Werke, Staufen, Germany). Dry matter, ash, crude protein (CP), acid ether extract, crude fibre, neutral detergent fibre, acid detergent fibre and acid detergent lignin were determined according to official methods (VDLUFA 2012, methods no. 3·1, 4·1·1, 5·1·1 B, 6·1·1, 6·5·1, 6·5·2, 6·5·3 and 8·1). Amino acids were analysed using ion exchange chromatography (Biochrom 30, Biochrom Ltd., Cambridge, UK) according to the protocol of VDLUFA (2012, method no. 4·11·1). Contents of organic matter (OM), cellulose, hemicellulose and nitrogen-free extract were calculated upon that basis. Neutral detergent insoluble CP was determined according to Licitra et al. (Reference Licitra, Hernandez and Van Soest1996), the Cornell Net Carbohydrate Protein Model, and used to calculate quantities of pcdCP and pcdAA according to Zeyner et al. (Reference Zeyner, Kirchhof, Susenbeth, Südekum and Kienzle2015).
Calculations
Each day of the collection period was divided into 12 equal timeframes beginning with the first meal, or bolus administration, at 07.00 h. Feeding periods, or administration periods, were defined as the period between a meal or marker dose and the following meal or dose, respectively.
Alkane faecal recovery was calculated according to Eqn (1) and balanced over 3 days of sampling:
 $${\rm AFR}_{i,j} = \displaystyle{{\sum {{\rm SFQ \,\times\,} F_{i{\rm,} j}}} \over {H{\rm \,\times\,} H_i {\rm \,+\,} C{\rm \,\times\,} C_i {\rm \,+\,} D_j}} $$
where SFQ is single faeces quantity, H and C are total received quantities of hay and concentrate (kg DM), F i , Hi and C i are concentrations of plant alkane i in faeces, hay and concentrate (mg/kg DM), F j is the concentration of synthetic alkane j in faeces (mg/kg DM) and D j is the total quantity of j offered by boluses (kg).
Dry matter intake and faecal DM output (DMO) were recorded during adaption and quantitative collection, respectively. This was used to calculate DMD and was again balanced over 3 days of sampling.
Dry matter intake of diet (Eqn (2)) and hay (Eqn (3)) was estimated using the alkane-pair technique proposed by Mayes et al. (Reference Mayes, Lamb and Colgrove1986). Twelve possible combinations between plant alkanes n-heptacosane (C27), n-nonacosane (C29), n-hentriacontane (C31) and n-tritriacontane (C33), and synthetic alkanes (C28, C32 and C36) were tested. For estimation of hay DMI, concentrate DMI was assumed to be known.
 $${\rm DMI(kg/d)} = \displaystyle{{D_j} \over {(F_j {\rm /}F_i ){\rm \,\times\, (}h{\rm \,\times\,} H_i {\rm \,+\,} c{\rm \,\times\,} C_i {\rm )\;}}} $$
 $${\rm DMI(kg/d)} = \displaystyle{{(F_i {\rm /}F_j ){\rm \,\times\,} D_j - I_{\rm c} {\rm \,\times}\, C_i} \over {H_i {\rm \;}}} $$
where F i , Hi and C i are concentrations of plant alkane i in faeces, hay and concentrate (mg/kg DM), h and c are relative proportions of hay and concentrate in the diet, I c is the known concentrate intake (kg DM/day), Fj is the concentration of synthetic alkane j in faeces (mg/kg DM), and D j is the quantity of j offered by boluses (mg/day).
Dry matter intake of the diet was also calculated (Eqn (4)) from separate estimates of DMD and DMO, using the product of SFQ and the daily defecation frequency (DDF) for the latter:
 $${\rm DMI(kg/d)} = \displaystyle{{{\rm SFQ \times DDF}} \over {{\rm 1} - {\rm DMD}}}$$
Additionally, DMO was estimated using the quotient of dose rate (mg/day) and faecal concentration (mg/kg DM) of synthetic alkanes.
Apparent digestibility of dietary DM, energy, OM (OMD) and proximate nutrients was estimated using individual plant alkanes as given in Eqns (5) and (6), respectively. For the latter calculation, only samples of timeframe one (07.00 to 08.59 h) were used.
 $${\rm DMD} = 1 - \displaystyle{{h{\rm \,\times\,} H_i {\rm \,+\,} c{\rm \,\times\,} C_i} \over {F_i}} $$
 $${\rm OMD} = {\rm 1} - \displaystyle{{h{\rm \,\times\,} H_i {\rm \,+\,} c{\rm \,\times\,} C_i} \over {F_i}} \times \displaystyle{{F_n} \over {h{\rm \,\times\,} H_n {\rm \,+\,} c{\rm \,\times\,} C_n}} $$
where F i , H i and C i are concentrations of plant alkane i in faeces, hay and concentrate (mg/kg DM), h and c are relative proportions of hay and concentrate in the diet, and F n , H n and C n are concentrations of energy, OM or nutrients in faeces, hay and concentrate (mg/kg DM).
Statistical analyses
Statistical analyses were performed with SAS 9·4 analytical software (SAS Institute Inc., Cary, NC, USA) using the MIXED procedure. Least squares means (LSM) of SFQ, daily faeces quantity (DFQ) and DDF were established regarding differences between animals, days and feeding periods within the days (Model 1). Subsequently, LSM of SFQ and zootechnical variables DMI, DMO and DMD were estimated for defined timeframes (Model 2), and the latter were compared with corresponding measured counterparts. In Model 2, the effect of timeframe was substituted by a fixed marker effect in the case of estimates of OMD, energy and nutrient digestibility because it was estimated only for one selected timeframe. Differences with P < 0·05 were considered to be significant.
For statistical analysis, the following models were used:
 $$\eqalign{y_{ijk} = \mu + \alpha _i + \beta _j + \gamma _k + a \times {\rm covariable}_{ijk} + \underline{e}_{\,ijk}} $$
where y ijk are measurements of SFQ, DFQ and DDF as a function of factors i, j and k; μ is the general mean; α i is the fixed effect of animal i (i = 1,…, 5); β j is the fixed effect of day j (j = 1, 2, 3); γ k is the fixed effect of feeding period k (k = A, B, C for plant alkanes: A: 07.00–14.59 h, B: 15.00–20.59 h and C: 21.00–06.59 h, and k = A, B for synthetic alkanes: A: 07.00–20.59 h and B: 21.00–06.59 h); covariable ijk is the linear effect of either DDF (for SFQ and DFQ analysis) or SFQ (for DDF analysis) with regression coefficient a; e ijk is the random residual effect.
 $$y_{ijk} = \mu + \alpha _i + \beta _j + \alpha \beta _{ij} + \underline{a}_k + \underline{e}_{\,ijk}$$
where y ijk are measurements of SFQ or estimates of zootechnical variables as a function of factors i, j and k; μ is the general mean; α i is the fixed effect of day i (i = 1, 2, 3); β j is the fixed effect of timeframe or marker j (j = 1,…, 13: 1: 07.00–08.59 h, 2: 09.00–10.59 h, 3: 11.00–12.59 h, 4: 13.00–14.59 h, 5: 15.00–16.59 h, 6: 17.00–18.59 h, 7: 19.00–20.59 h, 8: 21.00–22.59 h, 9: 23.00–00.59 h, 10: 01.00–02.59 h, 11: 03.00–04.59 h, 12: 05.00–06.59 h, 13 denotes the measured values for DMI, DMO and DMD, respectively, or j = 1,…, 5: 1–4: plant alkanes, 5 denotes the measured values for OMD, energy and nutrient digestibility, respectively); αβ ij is the interaction between α i and β j ; a k is the random effect of animal k (k = 1,…, 5) with consideration of repeated records; e ijk is the random residual effect.
RESULTS
Patterns of faecal quantity and faecal alkane concentrations
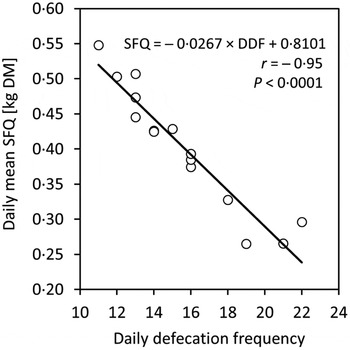
In the current study, 5·9 ± 0·44 kg DM faeces was defecated daily, ranging from 5·0 to 6·6 kg DM. The SFQ was 0·39 ± 0·120 kg DM, and ranged from 0·08 to 0·80 kg DM. The SFQ and DFQ did not differ significantly between days or horses. The former was similar in feeding periods A and B, but differed in comparison with period C (P < 0·01), as mealtimes were distributed unevenly throughout the days. The DDF was 16 ± 3·3 times on average, in a range between 11 and 22 times. It differed between days (P = 0·016) and horses (P = 0·058) by tendency, and significantly between feeding periods (P < 0·001). The SFQ and the DDF were negatively correlated, as shown in Fig. 2, and had therefore been used to calculate DMO.
Relationship between daily mean single faeces quantity (SFQ) and the individual daily defecation frequency.

Alkane faecal recovery was 82 ± 4·1 (C36), 91 ± 10·5 (C27), 98 ± 10·1 (C33), 99 ± 6·3 (C32), 101 ± 9·8 (C29), 105 ± 8·8 (C31) and 108 ± 11·1% (C28).
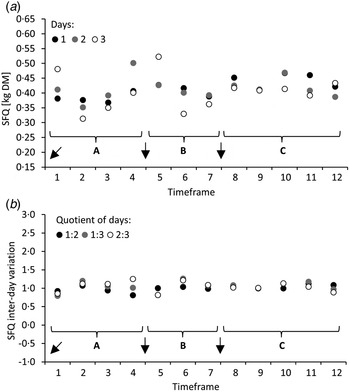
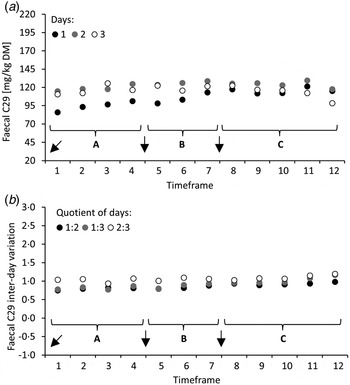
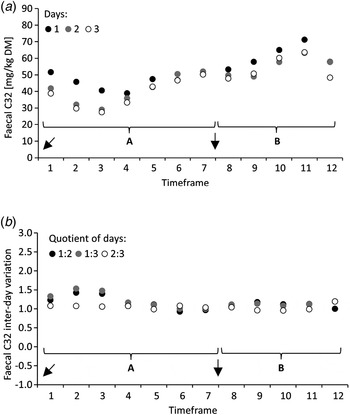
Throughout the day, specific patterns of SFQ (Fig. 3(a)) and faecal concentrations of plant (Fig. 4(a)) and synthetic alkanes (Fig. 5(a)) were observed. These patterns repeated from day to day, which is shown in Figs 3(b), 4(b) and 5(b) by inter-day quotients that in most timeframes did not differ markedly from one (one indicates no difference). For illustration purposes, patterns of C29 and C32 concentrations in faeces are shown as examples. Least squares means of SFQ showed pronounced dynamics within and lesser dynamics between the days, characterized by decreasing quantities up to approximately 3–4 h after mealtime, and subsequently increasing quantities until the next mealtime. This pattern was similar between feeding periods A and B, but much less pronounced during evening and night hours (period C).
(a) Intra-day and (b) inter-day variation of least squares means of single faeces quantity (SFQ): A, B and C denote feeding periods following meals. Arrows indicate the time of meal presentation.

(a) Intra-day and (b) inter-day variation of least squares means of faecal n-nonacosane (C29) concentration: A, B and C denote feeding periods following meals. Arrows indicate the time of meal presentation.

(a) Intra-day and (b) inter-day variation of least squares means of faecal n-dotriacontane (C32) concentration: A and B denote periods following bolus administration. Arrows indicate the administration time.

Average rates of C27, C29, C31 and C33 concentrations in faeces were 25 ± 3·9, 115 ± 14·7, 204 ± 38·5 and 45 ± 8·5 mg/kg DM, respectively. The faecal concentration of plant alkanes consistently showed little diurnal variability. However, differences were distinct between days, with the lowest concentrations generally on day one (Fig. 4(b)).
In contrast, clear intra-day dynamics of the faecal concentration of synthetic alkanes were detected. The average faecal concentration was 49 ± 13·2 (C28), 48 ± 12·9 (C32) and 43 ± 12·7 mg/kg DM (C36). It was reached approximately at the beginning of day three of treatment after the 5th repeated dose. Within a day, concentrations in faeces initially decreased after the 1st dose in the morning, with minimal concentration in timeframe three, and then increased gradually beginning in timeframe four. In the evening hours, between timeframes six to eight, concentrations remained unaltered. After the 2nd dose, concentrations increased again, and reached a maxima in the night always approximately 7–8 h later (timeframe 11). Generally, faecal concentrations of synthetic alkanes differed notably between consecutive days only during timeframes one to three, whereby highest concentrations were found on day one (Fig. 5(b)).
Dry matter intake
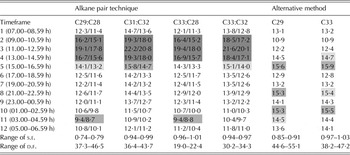
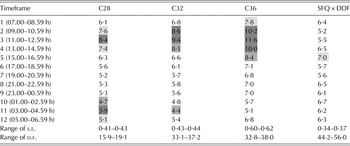
To estimate daily DMI, all possible combinations between plant C27, C29, C31 and C33, and synthetic C28, C32 and C36 alkanes were tested. It became clear that most estimates obtained using pairings to C36 (except C27:C36) differed significantly in comparison with the measured DMI (P < 0·05). Only in timeframes 10 and 11, approximately 5–8 h after the second dose of C36, did estimates not differ significantly. Least squares means of estimates from selected alkane pairs are shown in Table 3. Estimates were mostly unbiased in timeframes one, five to nine, 10 and 12, regardless of what alkane combination was used. During 3–8 h after the morning meal (timeframes 2–4), measured DMI was over-estimated (P < 0·001), but under-estimated numerically between 5 and 6 h (timeframe 10), and significantly between 7 and 8 h after the 3rd meal (P < 0·05, timeframe 11). The most accurate estimates of DMI were obtained using C29:C28 and C33:C28 pairs in timeframe one, and C31:C32 in timeframe 12.
Least squares means (LSM) of estimates of daily dry matter (DM) intake (DMI, kg/day) of diet and hay in a sequence of equal timeframes throughout the day (1,…, 12) using selected pairs of plant and synthetic alkanes or separate estimates of DM output and digestibility, compared with LSM of measured DMI of the diet (12·0 kg/day) and hay (11·2 kg/day)

C27, n-heptacosane; C28, n-octacosane; C29, n-nonacosane; C31, n-hentriacontane; C32, n-dotriacontane; C33, n-tritriacontane; d.f., degree of freedom; s.e., standard error.
Significant differences of LSM between estimated and measured DMI are highlighted, where light grey means P < 0·05, grey means P < 0·01 and dark grey means P < 0·001. Estimates for diet DMI are given before the solidus, estimates for hay DMI thereafter.
Selected LSM of alternatively calculated DMI (Eqn (4)) are given in Table 3. Measured DMI was underestimated when faeces samples were taken between 3 and 4 h after the morning meal (timeframe 2), and over-estimated during any other time of the day. The most accurate estimates were made with C29 and C33 as digestibility markers between 5 and 6 h after the morning meal (timeframe 3).
It was evident that the estimation of daily DMI was similar between day two and three of quantitative collection, but differed markedly from day one (Supplementary Fig. S1, available from http://journals.cambridge.org/AGS).
Faecal dry matter output
Using synthetic alkanes, measured and estimated DMO differed particularly during timeframes one to four, and 10–12, respectively, while reliable estimates were obtained from faeces samples taken between timeframes five and nine, approximately 6 h before to 4 h after the 2nd dose of synthetic alkanes (Table 4). Estimates based upon C36 mostly exceeded their measured counterpart, particularly between the timeframes one and five (P < 0·01).
Least squares means (LSM) of estimates of daily faecal dry matter output (DMO, kg/day) in a sequence of equal timeframes throughout a day (1,…, 12) using synthetic alkanes or the product of single faeces quantity (SFQ) and daily defecation frequency (DDF), compared with LSM of measured DMO (5·9 kg/day)

C28, n-octacosane; C32, n-dotriacontane; C36, n-hexatriacontane; d.f., degree of freedom; s.e., standard error.
Significant differences of LSM between estimated and measured DMO are highlighted, where light grey means P < 0·05, grey means P < 0·01 and dark grey means P < 0·001.
Calculation of DMO upon the basis of SFQ × DDF was unbiased during timeframes six to seven, nine and 11 (Table 4). Despite deviations up to 1·1 kg/day (P < 0·05), these estimates were generally more reliable and consistent in comparison with those obtained using synthetic alkanes.
Estimates of DMO were inconsistent across the days, which was less obvious in the 2nd approach and was limited to individual timeframes (timeframes 1, 4, 5, 11 and 12, Supplementary Fig. S2, available from http://journals.cambridge.org/AGS). Again, marker-based estimates of DMO differed distinctly between day one and the other 2 days of quantitative collection.
Apparent digestibility of dry matter, organic matter, energy and nutrients
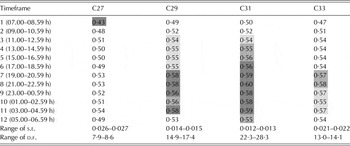
Least squares means of estimates of DMD are shown in Table 5. Estimates made using C27 were the lowest. Thus, measured DMD was under-estimated in timeframes one and two, while estimates were largely unbiased throughout the remainder of the day. Estimates based upon C29, C31 and C33 were unbiased in timeframe two, approximately 3–4 h after the morning meal, and then consistently over-estimated measured DMD.
Least squares means (LSM) of estimates of apparent dry matter (DM) digestibility coefficients (DMD) of the diet in a sequence of equal timeframes throughout a day (1,…, 12) obtained by means of plant alkanes, compared with LSM of DMD (0·51) calculated from measured DM intake and output

C27, n-heptacosane; C29, n-nonacosane; C31, n-hentriacontane; C33, n-tritriacontane; d.f., degree of freedom; s.e., standard error.
Significant differences of LSM between estimated and measured DMD are highlighted, where light grey means P < 0·05, grey means P < 0·01 and dark grey means P < 0·001.
At each timeframe, DMD estimates were widely similar between days two and three of quantitative collection, but again differed in comparison with day one (Supplementary Fig. S3, available from http://journals.cambridge.org/AGS).
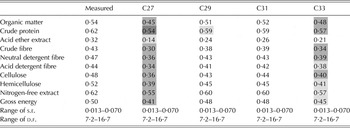
During timeframe one, OMD and digestibility of dietary energy and proximate nutrients was generally under-estimated. Particularly estimates of C27 and C33 differed significantly from the measured counterparts (P < 0·05). Most accurate estimates were obtained using C31 despite numerical differences of up to 6·5% (Table 6).
Least squares means (LSM) of estimates of apparent digestibility coefficients of dietary energy and proximate nutrients obtained by means of plant alkanes, compared with LSM of digestibility calculated from measured energy and nutrient intake and output

C27, n-heptacosane; C29, n-nonacosane; C31, n-hentriacontane; C33, n-tritriacontane; d.f., degree of freedom; s.e., standard error.
Significant differences of LSM between estimated and measured digestibility coefficients are highlighted, where light grey means P < 0·05, grey means P < 0·01 and dark grey means P < 0·001.
DISCUSSION
The present study was conducted under practical husbandry and feeding conditions. Plant and synthetic alkanes were used to estimate DMI, DMO and apparent DMD simultaneously with one set of markers. Even-chain alkanes are mostly unavailable in feed plants (Dove et al. Reference Dove, Mayes and Freer1996). As synthetics, they are easy to combine with plant alkanes, which is advantageous because analytical efforts can be significantly reduced (Dove & Mayes Reference Dove and Mayes2006).
The type of bolus used to administer synthetic alkanes is accepted well by horses (Bachmann et al. Reference Bachmann, Wensch-Dorendorf, Wulf, Glatter, Siebmann, Bierögel, Schumann, Bulang, Aurich and Zeyner2016b ). Dose rate and frequency were based upon a validation study by Smith et al. (Reference Smith, Mayes, Hollands, Cuddeford, Yule, Malo Ladrero and Gillen2007). On average, C28 and C32 were 16 (11%) and 8 mg (5%) beneath, and C36 5 mg (3%) above the target dose. The variation between bolus samples was high, with a coefficient of variation of 9·7 (C28), 9·8 (C32) and 9·9% (C36), and it was probably high between boluses administered to the horses as well. Variation of alkane doses may have occurred during the filling of gelatine capsules and subsequent baking because exposure to persistently high temperature resulted in losses of up to 5·2 (C28), 2·2 (C32) and 0·7% (C36) of initial sample weight (Bachmann et al. Reference Bachmann, Wensch-Dorendorf, Mäder, Bulang and Zeyner2016a ). The capsules offered no protection because bovine gelatine itself melts at 58 °C (Zhang et al. Reference Zhang, Li and Shi2006). The variation of alkane quantities offered via boluses might have influenced the calculation of AFR and estimation of DMO. Thus, accidental over-dosing of a synthetic alkane have led to an incorrectly depressed AFR (e.g. in C36), while under-dosing may have led to an incorrectly increased AFR (e.g. in C28). Even if estimation of DMI has been affected similarly, this could be compensated by the selection of suitable alkane pairs as discussed below. Estimation of digestibility was unaffected because synthetic alkanes had not been used.
The quantitative collection of faeces is necessary to quantify faecal output and directly calculate digestibility or recovery rates required for correction of faecal alkane concentrations. During treatment, apparently increasing stress was observed in at least one examined horse through increased unrest resulting in more frequent defecation (up to 22 times a day). The horses' accustomed rate of exercise was restricted. This might also have lowered water intake, decelerated digesta passage, and biased calculation of digestibility (Pagan et al. Reference Pagan, Harris, Brewster-Barnes, Duren and Jackson1998).
The adaption period was set to 5 days, allowing synthetic alkanes to reach equilibrium in faeces following Ferreira et al. (Reference Ferreira, Garcia, Rodrigues, Celaya, Dias-da-Silva and Osoro2007). Duration of quantitative collection was set to 3 consecutive days according to Goachet et al. (Reference Goachet, Philippeau, Varloud and Julliand2009), who did not note an altered digestibility of DM, OM and fibres compared with a collection period prolonged up to 5 days. In contrast, Smith et al. (Reference Smith, Mayes, Hollands, Cuddeford, Yule, Malo Ladrero and Gillen2007) found that the accuracy of intake estimation increased progressively as the number of sampling days was increased. Three days of faeces collection were sufficient to show specific intra-day and inter-day dynamics of SFQ and faecal alkane concentrations. However, the impact of prolonged collection on DMI, DMO and DMD estimation has not been studied in the current trial.
Alkane faecal recovery decisively influences intake and digestibility estimates. The present AFR were in the range given by Sales (Reference Sales2012) for plant alkanes. According to Sales (Reference Sales2012), AFR of alkanes was generally high but not consistently complete. Incomplete AFR may be explained by the partial absorption of alkane molecules in the small intestine (Kolattukudy & Hankin Reference Kolattukudy and Hankin1966; Mayes et al. Reference Mayes, Lamb and Colgrove1988) and probably not by microbial fermentation (Keli et al. Reference Keli, Mayes and de Vega2008), as digestion does not occur over the time of passage. In horses, AFR is highly variable, probably due to animal individuality and diet composition effects (Ferreira et al. Reference Ferreira, Celaya, García, Rodrigues and Osoro2009). Faecal recovery of plant alkanes was not influenced by molecular chain length, which confirms some previous studies (Ordakowski et al. Reference Ordakowski, Kronfeld, Holland, Hargreaves, Gay, Harris, Dove and Sklan2001; Peiretti et al. Reference Peiretti, Meineri, Miraglia, Mucciarelli and Bergero2006) but contradicts others (Gudmundsson & Thorhallsdottir Reference Gudmundsson, Thorhallsdottir, Gibb and Rutter1998; Ferreira et al. Reference Ferreira, Celaya, García, Rodrigues and Osoro2009). Faecal recovery of synthetic alkanes seemed to decrease with increasing chain length, congruent with results of Gudmundsson & Thorhallsdottir (Reference Gudmundsson, Thorhallsdottir, Gibb and Rutter1998), who offered synthetic alkanes mixed into feed pellets. However, this might be erroneous, and was probably a result of accidental over-dosing (C36) and chain-length dependent losses of parts of alkanes incurred during the production of boluses (C28) or pellets under high processing temperature. Because reliable literature data are rare or do not exist, AFR is recommended to be determined individually for each trial conducted (Ferreira et al. Reference Ferreira, Celaya, García, Rodrigues and Osoro2009) and specific for respective diets (Lin et al. Reference Lin, Luo, Zhang and Shu2007). Therefore, the current study tested whether uncorrected faecal alkane concentrations also enable reliable estimates.
Specific intra-day and inter-day dynamics of SFQ and faecal concentrations of plant and synthetic alkanes in horses were shown, which to the authors' knowledge has not thus far been given elsewhere. Diurnal patterns were shown in horses for faecal concentrations of hydrochloric acid-insoluble ash (AIA) and chromium (Cr) from Cr-mordanted hay by Cuddeford & Hughes (Reference Cuddeford and Hughes1990), and for dosed chromic oxide by Haenlein et al. (Reference Haenlein, Smith and Yoon1966) and Takagi et al. (Reference Takagi, Hashimoto, Yonemochi, Asai, Yoshida, Ohta, Ishibashi and Watanabe2002), in ruminants for synthetic alkanes by Giráldez et al. (Reference Giráldez, Lamb, López and Mayes2004) and Molina et al. (Reference Molina, Matamoros and Pell2004), and for ratios between plant and synthetic alkanes by Molina et al. (Reference Molina, Matamoros and Pell2004) and Oliván et al. (Reference Oliván, Ferreira, Celaya and Osoro2007). Intra-day dynamics of SFQ were more pronounced than those of faecal concentrations of plant alkanes. Patterns of DM concentration in faeces were quite similar to those of plant alkane concentrations and, in turn, those of absolute alkane and faeces quantity were similar too. Thus, intra-day dynamics for SFQ and plant alkane faecal concentrations following three mealtimes daily are similar. In contrast, intra-day dynamics were much more pronounced for concentrations of synthetic alkanes in faeces following twice daily administration. This suggests that frequency of mealtimes or bolus administration has a primary influence on characteristics of intra-day patterns, which confirms previous reports (Haenlein et al. Reference Haenlein, Smith and Yoon1966; Smith et al. Reference Smith, Mayes, Hollands, Cuddeford, Yule, Malo Ladrero and Gillen2007). Diurnal patterns of SFQ and faecal alkane concentrations were similar between individual horses, and repeated from day to day. Nevertheless, individual shifts that were either quantitative or temporal have also been noticed. Haenlein et al. (Reference Haenlein, Smith and Yoon1966) mentioned that diet composition affects digesta passage, altering measurable patterns. In ponies, Drogoul et al. (Reference Drogoul, de Fombelle and Julliand2001) reported increasing mean retention time as the proportion of concentrate in the diet increased. Because alkane concentrations differed distinctly between hay and concentrate in the current study, and individual proportions of concentrate were fed, this might have contributed to individual characteristics of those patterns. However, this probably had little effect. It is expected that the time taken by individual horses to consume a single meal and bound plant alkanes both increase with increasing proportions of roughage in the diet. Mealtimes were generally much longer than the ingestion of boluses, which might have contributed to less pronounced diurnal patterns of plant alkanes in faeces. The method of application affects duration of alkane exposition in the gut (Giráldez et al. Reference Giráldez, Lamb, López and Mayes2004). This, and particularly the association with the solid or liquid phase of digesta, may influence gut passage of synthetic alkanes and the resulting diurnal patterns. Mayes et al. (Reference Mayes, Lamb and Colgrove1988) reported amounts of 30–40% of synthetic alkanes found in the liquid phase. Gut passage of liquid-phase markers is hastened compared with that of markers fully bound to coarse plant particles (Udén et al. Reference Udén, Rounsaville, Wiggans and Van Soest1982). As mentioned above, restriction of exercise might also have affected measured intra-day and inter-day dynamics of SFQ and alkanes.
Estimation of DMI using the alkane-pair technique (Mayes et al. Reference Mayes, Lamb and Colgrove1986) was particularly affected by pronounced intra-day dynamics of synthetic alkanes. Faecal concentrations decreasing below the average resulted in over-estimated DMO, and thus DMI. Where faecal concentrations increased above the average, DMO and DMI were generally under-estimated. Despite being non-significant, specific differences between estimated and measured DMI could differ by >2 kg/day, which would be unacceptable in practical implementation. The most accurate estimates of DMI were made using the C31:C32 alkane pair within 2 h prior (timeframe 12), as well as using C29:C28 and C33:C28 pairs within 2 h after the morning meal (timeframe 1), where the measured counterpart was over-estimated by 0·8 (C31:C32), 2·5 (C29:C28) and 0·8% (C33:C28), respectively (0·1–0·3 kg/day). The C31:C32 pair has also been used in previous studies that estimated DMI within a similar magnitude (Stevens et al. Reference Stevens, van Ryssen and Marais2002; Ferreira et al. Reference Ferreira, Garcia, Rodrigues, Celaya, Dias-da-Silva and Osoro2007; Smith et al. Reference Smith, Mayes, Hollands, Cuddeford, Yule, Malo Ladrero and Gillen2007). Estimates obtained using C36 as output marker did not display measured DMI accurately, which was probably linked to bolus preparation as discussed above.
The accuracy of DMI calculated from previously estimated DMO and DMD was affected by dynamics of both SFQ and faecal concentrations of plant alkanes, which led to an increasing bias. Even though non-significant, measured DMI was partly under- or over-estimated by >2 kg/day. Estimation of DMI was suitable in timeframe three using C29 (+1·6% deviation) or C33 (+3·3% deviation) as a digestibility marker. The C29 marker was also recommended by Peiretti et al. (Reference Peiretti, Meineri, Miraglia, Mucciarelli and Bergero2006), who calculated DMI from estimations of DMD and DMO measured via total collection with a lowest bias of –3·5% deviation.
Measured DFQ was higher than that recorded previously in thoroughbreds or in quarter horse yearlings (Ordakowski et al. Reference Ordakowski, Kronfeld, Holland, Hargreaves, Gay, Harris, Dove and Sklan2001; Patterson et al. Reference Patterson, Cooper, Freeman and Teeter2002; Takagi et al. Reference Takagi, Hashimoto, Yonemochi, Asai, Yoshida, Ohta, Ishibashi and Watanabe2002). Presumably, this was due to comparatively large proportions of roughage in the current diets and perhaps also an effect of body weight, but less so an effect of breed. The high range of defecation frequency, up to 22 times daily, might be a result of higher stress during treatment. However, this was only obvious in one horse. Golonka (Reference Golonka2009) reported a mean frequency of six defecations throughout a day in grazing Konik ponies. As far as the authors know, directly comparable data are not available.
As mentioned above, declining faecal concentrations of synthetic alkanes led to over-estimation of measured DMO, while increasing concentrations under-estimated it. In timeframes five to nine, a period between 6 h before and 4 h after the 2nd dose of synthetic alkanes, faecal concentrations remained constant near the average. Differences between measured and estimated DMO were admittedly not significant but numerically within the –13·5 and +10·6% deviation (±0·7 kg/day). The accuracy of estimation was lower than some given in the literature (Castelán-Ortega et al. Reference Castelán-Ortega, Estrada-Flores, Smith, Colunga, Solís-Méndez, Avilés-Nova, Ramirez and García2007). Again, estimates obtained using the C36 marker were more biased and were only reliable with faeces sampled during the night hours (timeframes 10 and 11) with –3·5 to –15·7% deviation (0·2–0·8 kg/day).
When DMO has been estimated by the product of SFQ and DDF, these estimates were minimally variable, as diurnal fluctuation of SFQ was also minimal. Nevertheless, if SFQ decreases beneath its average, this results in under-estimation, while an SFQ which exceeds this average results in over-estimation of measured DMO. Reliability of DMO estimates was highest when faecal samples were taken in timeframes six and seven, between 3 and 6 h after the 2nd meal, as well as nine and 11, between 3–4 and 7–8 h after the 3rd meal, with –5·4 to +5·1% (±0·3 kg/day) deviation. This calculation requires known DDF. For this, video monitoring may be a helpful tool. To the authors' knowledge, this approach has so far not been reported elsewhere.
Apparent digestibility of DM, OM, dietary energy and proximate nutrients, based upon measured data, were within the wide range of comparable data given in the literature (Pagan et al. Reference Pagan, Harris, Brewster-Barnes, Duren and Jackson1998; Takagi et al. Reference Takagi, Hashimoto, Yonemochi, Asai, Yoshida, Ohta, Ishibashi and Watanabe2002; Zeyner & Kienzle Reference Zeyner and Kienzle2002; Goachet et al. Reference Goachet, Philippeau, Varloud and Julliand2009; Jensen et al. Reference Jensen, Brøkner, Bach Knudsen, Tauson, Ellis, Longland, Coenen and Miraglia2010).
Although intra-day variation of plant alkanes' faecal concentration was less pronounced, it was evident that decreasing concentrations resulted in the under-estimation of measured DMD, such as during timeframe one using C29, C31 and C33; analogously increasing concentrations resulted in over-estimation (timeframes 2–12 using C29, C31 and C33). Sampling of faeces in timeframe two, between 3 and 4 h after the morning meal, led to most accurate estimates when C29 or C33 markers were used (+0·8 or +0·2% deviation from measured DMD, respectively). These alkanes can therefore be recommended as digestibility markers, as noted previously by Peiretti et al. (Reference Peiretti, Meineri, Miraglia, Mucciarelli and Bergero2006). The application of C29 and C33 for the estimation of DMD led to estimates in a similar range (Ordakowski et al. Reference Ordakowski, Kronfeld, Holland, Hargreaves, Gay, Harris, Dove and Sklan2001) or a wider range of deviation (Peiretti et al. Reference Peiretti, Meineri, Miraglia, Mucciarelli and Bergero2006; Ferreira et al. Reference Ferreira, Garcia, Rodrigues, Celaya, Dias-da-Silva and Osoro2007) compared with the current results. The C27 marker was mostly suitable, but DMD estimation may be biased by analytical errors that might occur due to low dietary and faecal concentrations (Brosh et al. Reference Brosh, Henkin, Rothman, Aharoni, Orlov and Arieli2003).
The selection of morning spot sampling of faeces for estimating OMD, energy and nutrient digestibility using plant alkanes was based upon recommendations by Fuchs et al. (Reference Fuchs, Militz and Hoffmann1987), who used 4 N AIA. In the current study, the digestibility of dietary energy and nutrients was under-estimated. After further analysis of alkane faecal concentration dynamics, it seemed likely that accuracy of estimation would have been increased with later sampling (timeframe 2). This shows that selection of spot samples, or even a small temporal shift in diurnal patterns of alkane faecal concentrations, may noticeably affect the resulting estimates.
CONCLUSIONS
Intra-day and inter-day dynamics of SFQ and of the faecal concentrations of plant alkanes and synthetic bolus alkanes were mainly influenced by the mealtime or the administration interval. Knowledge of these defecation dynamics allows the selection of faecal spot samples where estimates of DMI, DMO and DMD are mostly unbiased. Additionally, incomplete faecal recovery of the marker alkanes can be compensated by sampling. In the current study, the most accurate estimates of DMI were obtained from 2 h before (C31:C32) until 2 h after the morning meal (C29:C28 and C33:C28), as well as between 5 and 6 h after the morning meal using SFQ × DDF and C29 and C33 as digestibility markers. The estimation of DMO using synthetic alkanes had a larger bias than the estimation using SFQ × DDF, which was most reliable based upon samples taken between 3 and 6 h after the midday meal. For DMI estimation, the latter approach provides the opportunity to omit the administration of synthetic alkanes in addition, but DDF has to be known. Using C29 or C33, DMD was largely unbiased during 3–4 h after the morning meal. In this respect, taking two to three spot samples of faeces evenly distributed between 2 h before and 6 h after the 1st meal or bolus administration per day for at least 3 consecutive days is recommended. Repeated administration of synthetic alkanes twice a day did not prevent fluctuation of faecal concentrations. It may therefore be useful to increase or substitute the administration of synthetic alkanes. It is suggested that the diurnal fluctuation of SFQ and of faecal alkane concentrations becomes lower when the feeding interval decreases and may be absent with ad libitum feeding. In this way, any sampling time would be applicable, provided that the used markers have high or complete faecal recovery. Consequently, this approach needs to be validated with a larger quantity of horses and different feeding regimes.
SUPPLEMENTARY MATERIAL
The supplementary material for this article can be found at http://dx.doi.org/10.1017/S0021859616000344.
The authors would like to thank R. V. and B. Jope, Reitgestüt Knauthain GmbH, Leipzig, for the provision of horses and the active support of this study. Moreover, the authors sincerely thank Prof. Dr. K. Mäder and M. Windorf, Institute of Pharmacy, Martin Luther University Halle-Wittenberg, Halle (Saale), for the help with the preparation of boluses for treatment and analysis, B. S. Cross for language correction and the anonymous referee, whose constructive comments helped to improve the manuscript. This study was supported by a fellowship for M. Bachmann that was provided by the H. WILHELM SCHAUMANN Stiftung (Hamburg, Germany), which is hereby gratefully acknowledged.