

INTRODUCTION
Over the last 30,000 yr, North America experienced profound ecological changes, including species range shifts and the compositional turnover of terrestrial communities (Williams et al., Reference Williams, Shuman, Webb, Bartlein and Leduc2004, Blois et al., Reference Blois, Williams, Fitzpatrick, Ferrier, Veloz, He, Liu, Manion and Otto-Bliesner2013), megafaunal extinctions (Koch and Barnosky, Reference Koch and Barnosky2006), and changing fire regimes (Marlon et al., Reference Marlon, Bartlein, Walsh, Harrison, Brown, Edwards and Higuera2009). Much interest has focused on better understanding the underlying climatic and non-climatic drivers of vegetation change over this time period and the causal mechanisms that ultimately resulted in contemporary plant communities (Blois et al., Reference Blois, Williams, Fitzpatrick, Ferrier, Veloz, He, Liu, Manion and Otto-Bliesner2013; Ordonez and Williams, Reference Ordonez and Williams2013; Gill, Reference Gill2014; Jackson and Blois, Reference Jackson and Blois2015). In the eastern United States, particular attention has been directed at the late-glacial expansion of temperate hardwood species, development of plant communities lacking modern analogs, linkages to millennial-scale climate events in the North Atlantic and Greenland, late Pleistocene megafaunal extinctions, and changing fire regimes (Jackson and Williams, Reference Jackson and Williams2004; Grimm et al., Reference Grimm, Watts, Jacobson, Hansen, Almquist and Dieffenbacher-Krall2006; Gill et al., Reference Gill, Williams, Jackson, Lininger and Robinson2009, Reference Gill, Williams, Jackson, Donnelly and Schellinger2012; Gonzales and Grimm, Reference Gonzales and Grimm2009; Liu et al., Reference Liu, Andersen, Williams and Jackson2013; Jones et al., Reference Jones, Williams and Jackson2017; Watson et al., Reference Watson, Williams, Russell, Jackson, Shane and Lowell2018).
The Southeast has long been a region of biogeographic and paleoecological interest due to its species-rich flora and its likely role as a refugium for many temperate taxa during glacial periods (Soltis et al., Reference Soltis, Morris, McLachlan, Manos and Soltis2006), with evidence for low geographic separation among southeastern refugia (Lumibao et al., Reference Lumibao, Hoban and McLachlan2017; Bemmels and Dick, Reference Bemmels and Dick2018). Previous paleoecological studies indicate extensive dominance of boreal coniferous trees across the region during the last glacial period, from the Carolina Coastal Plain to the southern fringes of the Appalachians and interior highlands (Whitehead, Reference Whitehead1964, Reference Whitehead1965, Reference Whitehead1981; Watts, Reference Watts1970, Reference Watts1980a, Reference Watts1980b; Delcourt, Reference Delcourt1979; Royall et al., 1991; Delcourt and Delcourt, Reference Delcourt and Delcourt1994). The contrast between glacial (boreal conifers) and Holocene (temperate and subtropical hardwoods and conifers) periods highlights the sensitivity of terrestrial ecosystems to climate change. Most late Quaternary pollen records from the Southeast, however, were collected more than three decades ago and generally consist of relatively poorly dated, single-proxy (pollen) records of vegetation, limiting our understanding of millennial-scale events and relationships between climate, herbivory, and vegetation changes in the region. Since that time, new paleoecological, paleoclimatic, and geochronological techniques have emerged and others have been refined. For example, sedimentary indicators of megafauna (coprophilous fungal spores) and fire (macroscopic charcoal) enable multi-trophic studies of past ecological changes (Gill et al., Reference Gill, Williams, Jackson, Lininger and Robinson2009, Reference Gill, Williams, Jackson, Donnelly and Schellinger2012; Higuera et al., Reference Higuera, Brubaker, Anderson, Hu and Brown2009), while accelerator mass spectrometry (AMS) 14C dating of terrestrial macrofossils has made sediment chronologies more accurate and precise (Grimm et al., Reference Grimm, Maher and Nelson2009). New geochemical indicators of past climates developed for lake sediments, including organic biomarkers such as branched glycerol dialkyl glycerol tetraethers (brGDGTs; Zink et al., Reference Zink, Vandergoes, Mangelsdorf, Dieffenbacher-Krall and Schwark2010; Fawcett et al., Reference Fawcett, Werne, Anderson, Heikoop, Brown, Berke and Smith2011; Loomis et al., Reference Loomis, Russell, Ladd, Street-Perrott and Sinninghe Damsté2012, Reference Loomis, Russell and Lamb2015, Reference Loomis, Russell, Verschuren, Morrill, De Cort, Sinninghe Damsté, Olago, Eggermont, Street-Perrott and Kelly2017; Niemann et al., Reference Niemann, Stadnitskaia, Wirth, Gilli, Anselmetti, Sinninghe Damsté, Schouten, Hopmans and Lehmann2012; Woltering et al., Reference Woltering, Atahan, Grice, Heijnis, Taffs and Dodson2014; Watson et al., Reference Watson, Williams, Russell, Jackson, Shane and Lowell2018) provide paleoclimatic signals independent from fossil pollen proxies. At the same time, our understanding of hemispheric-scale climate trends during the last deglaciation has been sharpened by multiple high-resolution paleoclimate records from marine sediments, speleothems, and ice cores (Shakun et al., Reference Shakun, Clark, He, Marcott, Mix, Liu, Otto-Bliesner, Schmittner and Bard2012; Buizert et al., Reference Buizert, Gkinis, Severinghaus, He, Lecavalier, Kindler and Leuenberger2014).
For these reasons, paleoecologists have recently begun to reinvestigate classic fossil pollen sites in the Southeast using new sediment cores, robust chronologies, and high-resolution multi-proxy analyses (Grimm et al., Reference Grimm, Watts, Jacobson, Hansen, Almquist and Dieffenbacher-Krall2006; Liu et al., Reference Liu, Andersen, Williams and Jackson2013; Jones et al., Reference Jones, Williams and Jackson2017). One area of emergent research involves understanding how millennial-scale North Atlantic climatic events were manifested across the Southeast and the degree to which they drove the postglacial expansion of hardwood taxa, formation of no-analog vegetation, and other ecological changes (Grimm et al., Reference Grimm, Watts, Jacobson, Hansen, Almquist and Dieffenbacher-Krall2006; Liu et al., Reference Liu, Andersen, Williams and Jackson2013; Jones et al., Reference Jones, Williams and Jackson2017). Both the regional expression of these climatic events in the southeastern United States and their effect on vegetation remain uncertain, however, with varying signals among Southeast paleoecological records. For example, warm Dansgaard-Oeschger interstadials and cold Heinrich events (including the Younger Dryas) recorded in the North Atlantic (Bond et al., Reference Bond, Broecker, Johnsen, McManus, Labeyrie, Jouzel and Bonani1993; Buizert et al., Reference Buizert, Gkinis, Severinghaus, He, Lecavalier, Kindler and Leuenberger2014) were expressed as alternating oak-scrub/prairie and pine phases at Lake Tulane in peninsular Florida, indicating cold/dry and warm/wet conditions, respectively. This suggests high vegetation sensitivity to millennial-scale climate changes, and that these regional climate variations were antiphased to the North Atlantic (Grimm et al., Reference Grimm, Watts, Jacobson, Hansen, Almquist and Dieffenbacher-Krall2006). In contrast, fossil pollen data from Jackson and Anderson ponds in the interior Southeast show little sensitivity to millennial-scale climate events in the North Atlantic between 25,000 and 18,000 cal yr BP (Liu et al., Reference Liu, Andersen, Williams and Jackson2013). At Cupola Pond, the successive development of two distinct no-analog assemblages coincided with Bølling-Allerød warming and the Younger Dryas. Moreover, high levels of temperate pollen taxa indicate warm conditions during the Younger Dryas, similar to the findings at Lake Tulane (Jones et al., Reference Jones, Williams and Jackson2017), but in contrast to cold climates in the North Atlantic and north-central United States (Gonzales and Grimm, Reference Gonzales and Grimm2009; Gill et al., Reference Gill, Williams, Jackson, Donnelly and Schellinger2012; Watson et al., Reference Watson, Williams, Russell, Jackson, Shane and Lowell2018). Additional well-dated fossil pollen records and independent paleoclimate data from the Southeast can help resolve and explain these apparent inconsistencies among sites.
A second area of recent research seeks to achieve a better understanding of possible interactions among climatic and vegetational changes, late Pleistocene megafaunal extinctions, and changing fire regimes. At sites in the central Great Lakes region, the development of no-analog pollen assemblages, featuring unique combinations of boreal conifer and hardwood taxa, has been linked to declines in megafaunal population densities and intensified fire regimes based on multiple-proxy analyses of fossil pollen, coprophilous spores (e.g., Sporormiella-type), and macroscopic charcoal (Gill et al., Reference Gill, Williams, Jackson, Lininger and Robinson2009, Reference Gill, Williams, Jackson, Donnelly and Schellinger2012). In the Southeast, recent work at the well-dated Page-Ladson site in the Florida Panhandle (41 AMS 14C dates; Fig. 1) revealed declines in Sporormiella at 12,700 cal yr BP that may signal late Pleistocene megafaunal population declines (Halligan et al., Reference Halligan, Waters, Perrotti, Owens, Feinberg, Bourne and Fenerty2016; Perrotti, Reference Perrotti2018). Sporormiella-type spores have been scarce in other pollen sequences from the southeastern United States (Liu et al., Reference Liu, Andersen, Williams and Jackson2013; Jones et al., Reference Jones, Williams and Jackson2017), however, and the few macroscopic charcoal records from the Southeast suggest very little biomass burning during the full and late glacial periods, in contrast to high fire activity during the Holocene (Hussey, Reference Hussey1993; Jones et al., Reference Jones, Williams and Jackson2017; Spencer et al., Reference Spencer, Jones, Gamble, Benedetti, Taylor and Lane2017). Fire plays a prominent role in shaping southeastern vegetation today, particularly in longleaf pine (Pinus palustris) ecosystems (Platt et al., Reference Platt, Evans and Rathbun1988; Frost, Reference Frost2006; Stambaugh et al., Reference Stambaugh, Varner and Jackson2017), and additional macroscopic charcoal records are needed to accurately assess how fire regimes have changed through time.
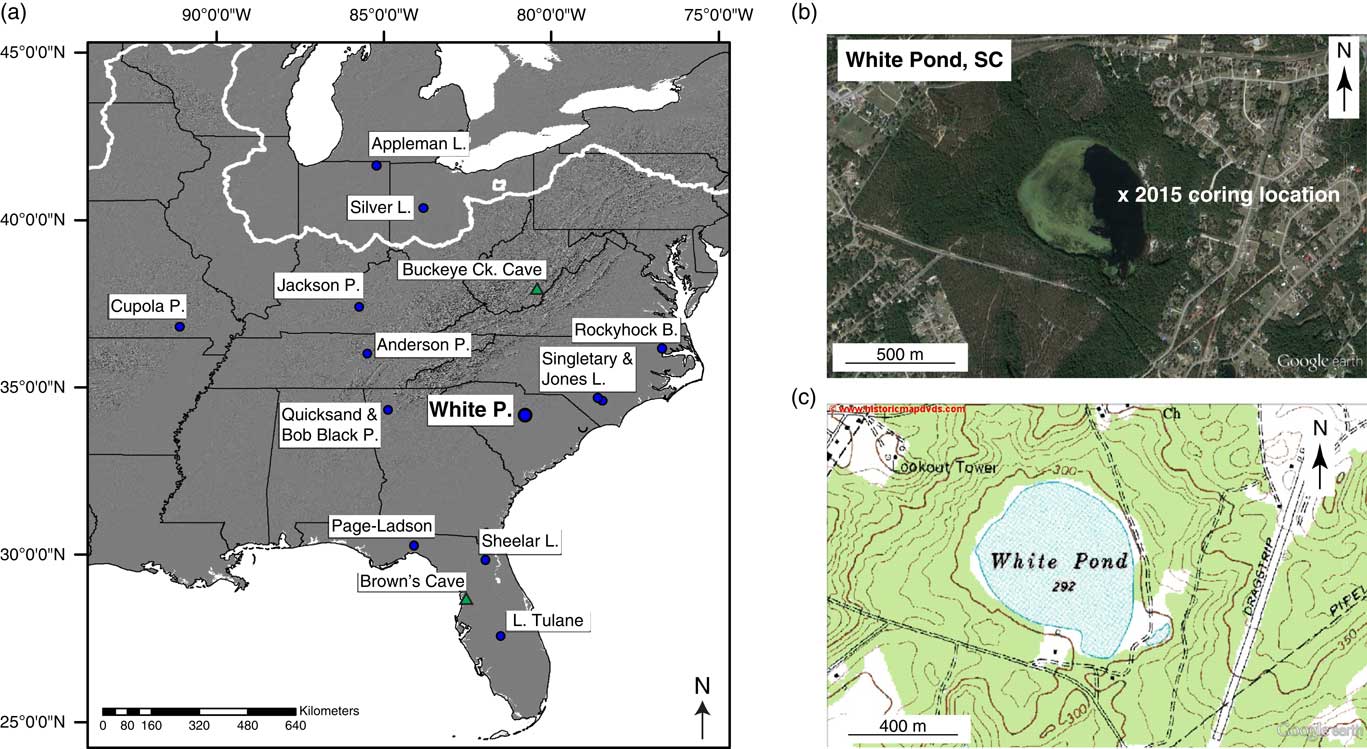
(a) Location of White Pond and other sites (blue circles, lacustrine records; green triangles, speleothem records) mentioned in the paper. Bold white line denotes the approximate LGM ice margin (ca. 21,000 yr BP; Dyke et al., Reference Dyke, Moore and Robertson2003). (b) Google Earth image of the White Pond basin, including coring location. (c) Topographic map of White Pond and vicinity. Contour interval is 10 feet. (For interpretation of the references to color in this figure legend, the reader is referred to the web version of this article.)

To further understand the history and drivers of late Quaternary vegetation change in the southeastern United States, we developed a multi-proxy record of paleoenvironmental change from White Pond in central South Carolina that spans the last 30,000 yr (Fig. 1). White Pond is among the few sites between the Laurentide ice margin and the Florida Peninsula with continuous Holocene sedimentation, and therefore offers a rare uninterrupted record of late Quaternary ecological changes in the Southeast. We build on the pioneering work of Watts (Reference Watts1980b) at White Pond by producing robustly dated high-resolution fossil pollen, macroscopic charcoal, and coprophilous spore sequences, to reconstruct changes in vegetation, fire activity, and megafaunal populations. We also reconstruct deglacial temperature variations (21,000 to 4000 cal yr BP) using brGDGT analysis. Our new record from White Pond adds to the growing number of well-dated paleoenvironmental sites in the Southeast, and enables us to address the following questions: (1) how were millennial-scale climate events of the North Atlantic and Greenland expressed in vegetation records from the Southeast; (2) how strongly did no-analog plant communities manifest at White Pond and elsewhere in the Southeastern Coastal Plain, and were late-glacial vegetational changes linked to declining megaherbivore populations and changing fire regimes; and (3) how did interactions between climate, fire, and vegetation shape the development of Holocene southeastern forests?
STUDY SITE
White Pond is situated in a shallow groundwater-fed basin in the Carolina Sandhills region of the Inner Atlantic Coastal Plain in South Carolina (Fig. 1; 34°10′5″N, 80°46′36″W; 90 m elevation; <1.5 m water depth; 20 ha). The Carolina Sandhills, a region of late Quaternary aeolian sand sheets and dunes, occur just below the fall line, which marks the boundary between unconsolidated Cretaceous sands of the Coastal Plain and crystalline rocks of the Piedmont (Swezey et al., Reference Swezey, Fitzwater, Whittecar, Mahan, Garrity, Alemán González and Dobbs2016). The Sandhills have been dated to the full-glacial period and are associated with increased aeolian activity, drier climatic conditions, and sparser vegetation (Swezey et al., Reference Swezey, Schultz, González, Bernhardt, Doar, Garrity, Mahan and McGeehin2013, Reference Swezey, Fitzwater, Whittecar, Mahan, Garrity, Alemán González and Dobbs2016). White Pond likely originated as a wind-excavated depression in the Sandhills (Stone, P.A., personal communication, 2017), and the site is surrounded by sandy slopes and hills composed of typical Sandhills soils (i.e., Lakeland and Alpin sandy soils sensu Soil Survey Staff, 2018). Although Carolina Bays occur in the region, the White Pond basin lacks their diagnostic morphological features (e.g., elliptical shape with northwest-southeast orientation and a sand rim). Water levels fluctuate seasonally and annually; during a regional drought from 1998 to 2002, the pond experienced a severe drawdown, with most of the basin occupied by mudflats (Jackson, S.T., personal observation, 2002; Stone, P.A., personal communication, 2017). This drought was characterized by unusually large precipitation deficits during the normal groundwater recharge period of late winter and spring. Stream flows and lake levels declined dramatically throughout South Carolina during this period (Gellici et al., Reference Gellici, Harwell, Badr and Kiuchi2004).
The Atlantic Coastal Plain supports a species-rich flora and diverse communities that include grasslands and savannas, shrublands, needle- and broad-leaved sclerophyllous woodlands, and rich mesophytic forests (Christensen, Reference Christensen1988). Elevations are generally less than 150 m, and vegetation composition in the Inner Coastal Plain of South Carolina is largely shaped by soil moisture, ranging from xeric sandhill pine communities to pine-dominated flatwoods in moister areas (Christensen, Reference Christensen1988). Pinus palustris and Aristida stricta characterize sandhill pine forests and Quercus laevis is the dominant understory tree along dry sandy ridge tops. Further downslope, finer-textured soils support Q. marilandica, Q. margaretta, and Q. incana in the subcanopy, as well as Nyssa sylvatica, Diospyros virginiana, and Liquidambar styraciflua. With increasing moisture availability, sandhill pine forests grade into denser pine-dominated flatwoods, where Pinus taeda is often the dominant pine, although P. palustris occurs on sandier soils, and P. serotina on moister sites. The prevalence of P. taeda in such forests is a consequence of historical land use, whereby extensive plantings of the species has increased its seed rain, while fire exclusion from many areas has given it a competitive advantage over P. palustris (Wahlenberg, Reference Wahlenberg1946; Snyder, Reference Snyder1980; Christensen, Reference Christensen1981, Reference Christensen1988). Closer to the fall line, vegetation begins to resemble that of the Piedmont, where elevations range from 150 to 500 m, and the vegetation is characterized by a mixture of Quercus and Carya species and P. taeda and P. echinata in secondary forests (Braun, Reference Braun1950; Greller, Reference Greller1988). Vegetation before Euro- and Afro-American land clearance across much of the Southeastern Coastal Plain, including the vicinity of White Pond, included extensive tracts of open longleaf pine (Sargent, Reference Sargent1884; Mohr, Reference Mohr1897; Wahlenberg, Reference Wahlenberg1946).
White Pond is currently located in a commercially managed Pinus taeda forest, and the pond and surrounding property have been managed for at least seven decades as a private hunting and fishing reserve. Pinus echinata and Pinus palustris are also present near the site and, prior to land clearance in the eighteenth and nineteenth centuries, P. palustris was probably much more abundant, even dominant. On the low ground surrounding the pond, Quercus falcata, Carya sp., and Liquidambar sytraciflua grow, as do Acer rubrum, Vaccinium sp., and other mesic trees and shrubs. On exposed sandy soils on the east side of the lake, Quercus laevis, Ceratiola ericoides, Selaginella arenicola, Opuntia sp., and lichens (Cladonia sp.) grow under open P. palustris canopy. The shallow western half of the pond is vegetated by emergent graminoids (Poaceae and Cyperaceae), while the deeper eastern half is dominated by floating-leaved macrophytes (Nymphaea odorata and Brasenia schreberi).
The Inner Coastal Plain of South Carolina has a humid subtropical climate characterized by hot humid summers and mild winters. At White Pond, winter (December, January, February) temperatures range from 0.4 to 15.2°C (average=8°C) and summer (June, July, August) temperatures vary from 19.3 to 33.1°C (average=26°C; PRISM Climate Group, Reference PRISM Climate Group2016). Precipitation varies seasonally, with the majority of precipitation falling during the summer months, averaging 119 mm (PRISM Climate Group, Reference PRISM Climate Group2016), as the Bermuda high-pressure system draws moisture north and west from the Atlantic Ocean and the Gulf of Mexico (Kunkel et al., Reference Kunkel, Stevens, Stevens, Sun, Janssen, Wuebbles and Konrad2013). Winters are slightly drier, averaging 91 mm of precipitation (PRISM Climate Group, Reference PRISM Climate Group2016); the southward shifting jet stream brings extratropical cyclones and associated fronts to the region (Kunkel et al., Reference Kunkel, Stevens, Stevens, Sun, Janssen, Wuebbles and Konrad2013).
METHODS
Field
We collected two parallel overlapping sediment cores, each approximately 5.85 m long, from White Pond in April 2015. The cores were obtained from a floating platform at a water depth of 1.47 m using a modified Livingstone square-rod piston sampler (5-cm diameter) (Wright et al., Reference Wright, Mann and Glaser1983). All core segments were extruded, measured, and described in the field. Cores were wrapped in plastic wrap and aluminum foil and shipped to the University of Arizona where they were stored at 4ºC.
Lithology and chronology
Core segments were cleaned to eliminate potential contaminants (i.e., ~1 mm of outer core surface was removed), imaged, and described lithologically. We measured the sediment magnetic susceptibility of the cleaned cores at contiguous 1-cm intervals using a Bartington MS2E logging sensor. Each core segment was subsequently sliced into 1-cm thick disks and sub-sampled at specified depths (see method section for each proxy below) for pollen (1 cm3), charcoal (3 cm3), and brGDGT analyses (4 cm3). Remaining sediment (>4 cm3) was archived.
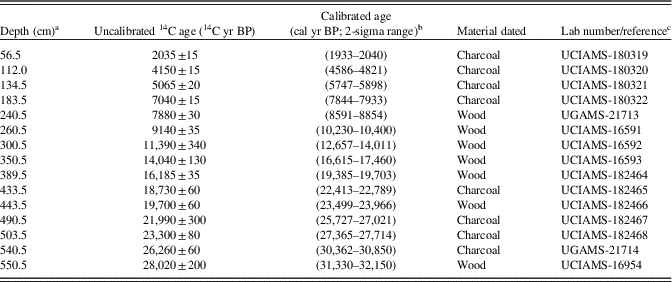
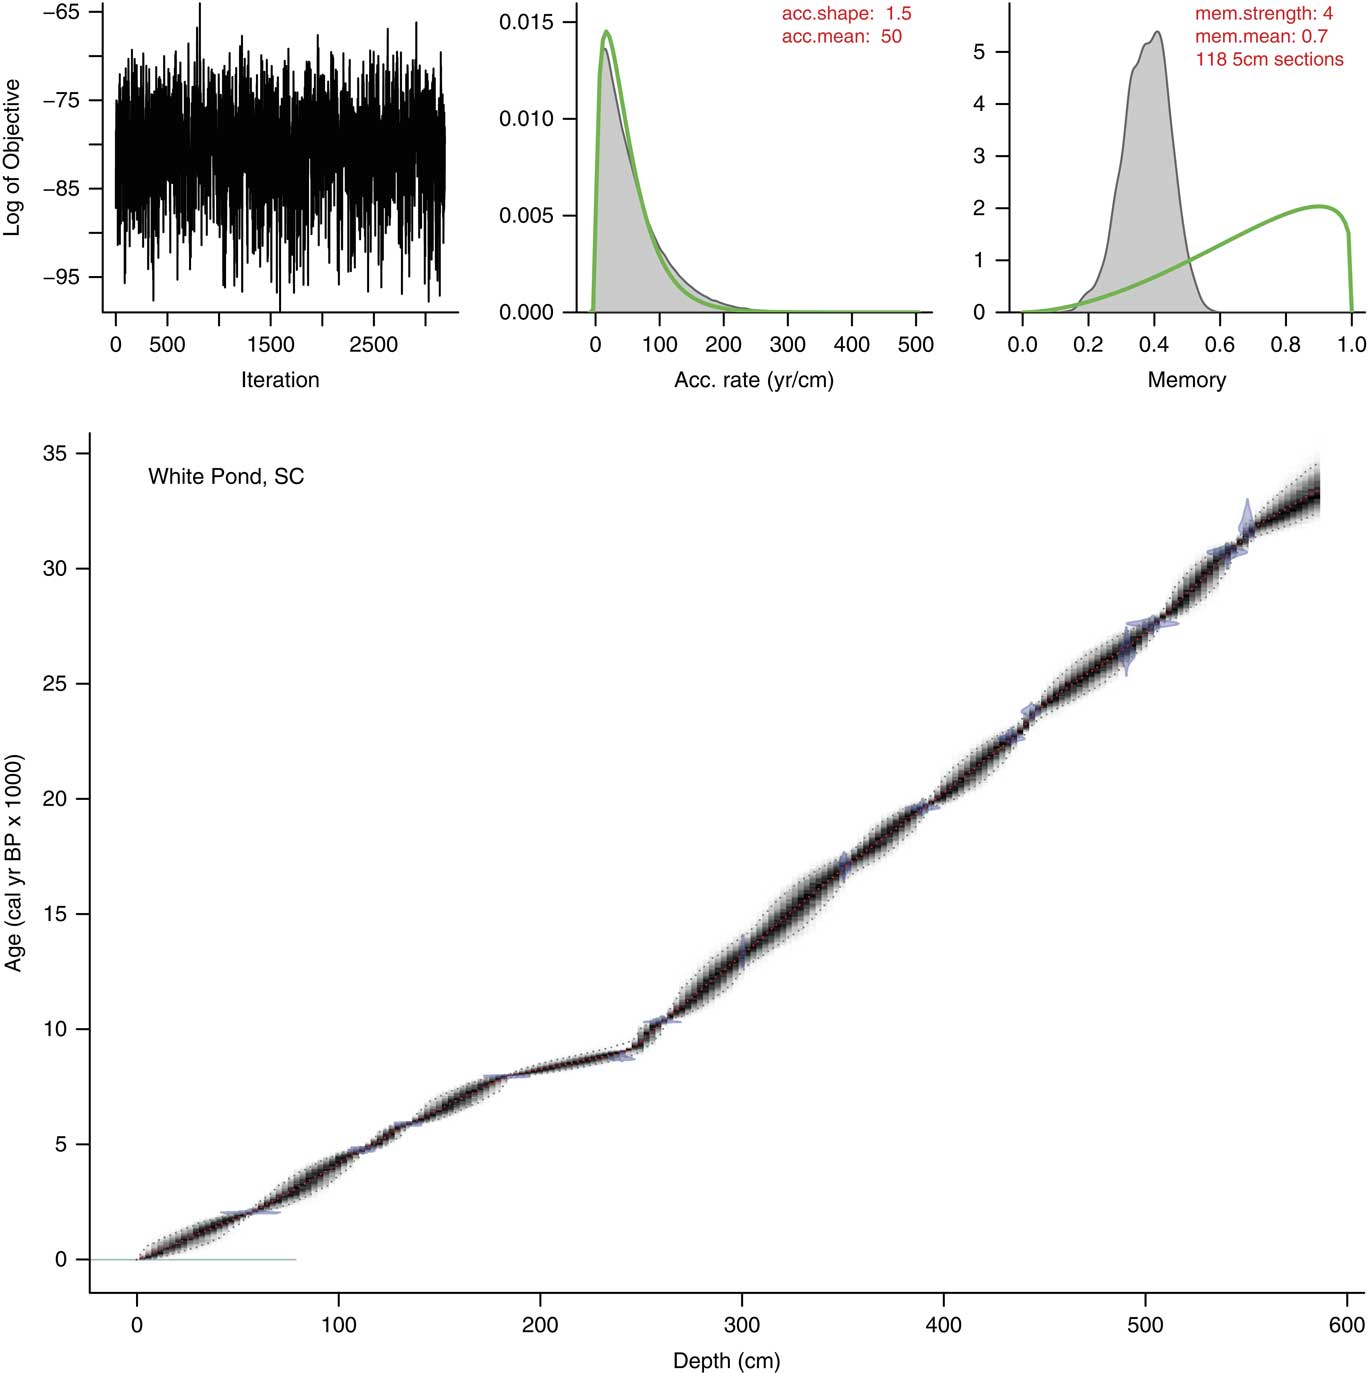
Samples of plant macrofossils and/or charcoal, all of confirmed terrestrial origin to avoid inaccuracies due to hardwater effects (Grimm et al., Reference Grimm, Maher and Nelson2009), were submitted for AMS radiocarbon dating (Table 1). Fifteen AMS 14C age estimates were converted to calendar ages using the IntCal13 calibration curve (Reimer et al., Reference Reimer, Bard, Bayliss, Warren, Blackwell, Bronk Ramsey and Buck2013), and an age-depth model with uncertainty estimates was constructed using Bacon software for Bayesian modeling in R (Blaauw and Christen, Reference Blaauw and Christen2011). Ages of individual sediment horizons (1-cm intervals) were based on the weighted mean age estimates from the Bacon analysis.
Accelerator mass spectrometry (AMS) radiocarbon dates from White Pond.

a Depth below mud surface.
b Calibrated ages derived from CALIB 7.1 (Stuiver et al., Reference Stuiver, Reimer and Reimer2017).
c UCIAMS, Keck Carbon Cycle AMS Lab, University of California, Irvine; UGAMS, Center for Applied Isotope Studies, University of Georgia.
brGDGT-based paleotemperature reconstruction
brGDGTs are membrane-spanning lipids produced by Acidobacteria (Weijers et al., Reference Weijers, Schouten, Hopmans, Geenevasen, David, Coleman, Pancost and Sinninghe Damsté2006; Sinninghe Damsté et al., Reference Sinninghe Damsté, Rijpstra, Hopmans, Weijers, Foesel, Overmann and Dedysh2011) that are present in many sedimentary environments, including soils, peats, marine sediments, and lakes (Weijers et al., Reference Weijers, Schouten, Hopmans, Geenevasen, David, Coleman, Pancost and Sinninghe Damsté2006, Reference Weijers, Schouten, Donker, van den, Hopmans and Sinninghe Damsté2007b; Tierney and Russell, Reference Tierney and Russell2009; Schouten et al., Reference Schouten, Hopmans and Sinninghe Damsté2013; Sinninghe Damsté, Reference Sinninghe Damsté2016). The chemical structure of the alkyl chains in brGDGTs varies due to environmental conditions, most notably temperature and pH. Weijers et al. (Reference Weijers, Schouten, Donker, van den, Hopmans and Sinninghe Damsté2007b) investigated brGDGT distributions in a set of globally-distributed soil samples, and showed that the number of cyclopentyl moieties in the alkyl chains, characterized by the index of cyclization of branched tetraethers (CBT), responds primarily to pH, whereas the number of methyl branches, characterized by the index of methylation of branched tetraethers (MBT), varies according to mean annual temperature and pH. Weijers et al. (Reference Weijers, Schouten, Donker, van den, Hopmans and Sinninghe Damsté2007b) used these relationships to develop inference models for temperature based on MBT and CBT. Subsequent studies have developed variants of these calibrations using both soil and lake sediments. Although questions remain concerning whether brGDGTs in lakes derive primarily from allochthonous sources (e.g., watershed soils) or autochthonous production (e.g., Tierney and Russell, Reference Tierney and Russell2009; Buckles et al., Reference Buckles, Weijers, Tran, Waldron and Sinninghe Damsté2014; Loomis et al., Reference Loomis, Russell, Eggermont, Verschuren and Sinninghe Damsté2014a), all studies to date show strong correlations between brGDGT distributions and mean annual temperatures (Peterse et al., Reference Peterse, Kim, Schouten, Kristensen, Koç and Sinninghe Damsté2009; Loomis et al., Reference Loomis, Russell, Eggermont, Verschuren and Sinninghe Damsté2014a, Reference Loomis, Russell, Heureux, D’Andrea and Sinninghe Damsté2014b). Although brGDGTs are just beginning to be used as a paleotemperature proxy in eastern North America (see Watson et al., Reference Watson, Williams, Russell, Jackson, Shane and Lowell2018), they have been used to reconstruct regional late Pleistocene to early Holocene temperatures in New Zealand (Zink et al., Reference Zink, Vandergoes, Mangelsdorf, Dieffenbacher-Krall and Schwark2010), Australia (Woltering et al., Reference Woltering, Atahan, Grice, Heijnis, Taffs and Dodson2014), Europe (Niemann et al., Reference Niemann, Stadnitskaia, Wirth, Gilli, Anselmetti, Sinninghe Damsté, Schouten, Hopmans and Lehmann2012), the southwestern United States (Fawcett et al., Reference Fawcett, Werne, Anderson, Heikoop, Brown, Berke and Smith2011), and Africa (Loomis et al., Reference Loomis, Russell, Ladd, Street-Perrott and Sinninghe Damsté2012, Reference Loomis, Russell and Lamb2015, Reference Loomis, Russell, Verschuren, Morrill, De Cort, Sinninghe Damsté, Olago, Eggermont, Street-Perrott and Kelly2017). Furthermore, brGDGTs from modern North American lacustrine sediments and soils have been used in several brGDGT temperature calibration indices (Weijers et al., Reference Weijers, Schouten, Donker, van den, Hopmans and Sinninghe Damsté2007b; Blaga et al., Reference Blaga, Reichart, Schouten, Lotter, Werne, Kosten, Mazzeo, Lacerot and Sinninghe Damsté2010; Peterse et al., Reference Peterse, van der Meer, Schouten, Weijers, Fierer, Jackson, Kim and Sinninghe Damsté2012).
We measured the relative abundances of brGDGTs in sediment samples from White Pond every ~200 yr between 21,000 and 4000 cal yr BP and in a modern surface sample to estimate changes in mean annual temperature during the deglacial transition. While a brGDGT-based temperature reconstruction spanning the entire 30,000-yr record would have been ideal, analytical and time constraints led us to focus on the deglacial period. Sample preparation followed Loomis et al. (Reference Loomis, Russell, Ladd, Street-Perrott and Sinninghe Damsté2012). Briefly, lipids were extracted from freeze-dried and homogenized sediment using a Dionex™ 350 Accelerated Solvent Extraction system using a 9:1 dichloromethane:methanol (DCM, MeOH) solution. The lipid extracts were separated into apolar and polar fractions using alumina columns with 9:1 hexane:DCM and 1:1 DCM:MeOH, respectively, as eluents. The polar fraction was dried under N2, dissolved, and passed through a 0.45-μm filter. brGDGTs were analyzed using atmospheric pressure chemical ionization/high performance liquid chromatography-mass spectrometry (APCI/HPLC-MS) at Brown University using selective ion monitoring mode on an Agilent/Hewlett Packard 1100 series LC/MSD with an Alltech Prevail Cyano column (150×2.1 mm, 3 μm). Relative abundances of the brGDGTs were quantified by manually integrating the areas of the protonated molecular ions of each compound, monitoring m/z 1302, 1300, 1298, 1296, 1050, 1048, 1046, 4036, 1034, 1032, 1022, 1020, and 1018. These methods did not separate the 5- and 6-methyl isomers of brGDGTs (e.g., de Jonge et al., Reference de Jonge, Hopmans, Zell, Kim, Schouten and Sinninghe Damsté2014; Russell et al., Reference Russell, Hopmans, Loomis, Liang and Sinninghe Damsté2018), but allow us to calculate the degree of cyclization (CBT) and methylation (MBT) of the brGDGTs using the equations from Weijers et al. (Reference Weijers, Schouten, Donker, van den, Hopmans and Sinninghe Damsté2007b), as well as to calculate MBT using the equation of Peterse et al. (Reference Peterse, Kim, Schouten, Kristensen, Koç and Sinninghe Damsté2009).
Different calibration functions for brGDGTs typically produce qualitatively similar temperature reconstructions and trends for late Quaternary sediments but often differ in their absolute values and magnitude (Loomis et al., Reference Loomis, Russell, Ladd, Street-Perrott and Sinninghe Damsté2012; Watson et al., Reference Watson, Williams, Russell, Jackson, Shane and Lowell2018). brGDGTs are produced in both soils and lake sediments (Weijers et al., Reference Weijers, Schouten, Donker, van den, Hopmans and Sinninghe Damsté2007b; Tierney and Russell, Reference Tierney and Russell2009; Weber et al., Reference Weber, de Jonge, Rijpstra, Hopmans, Stadnitskaia, Schubert, Lehmann, Sinninghe Damsté and Niemann2015), and the relative abundances of brGDGTs in soils can differ from those in lake sediments under the same temperature (Tierney et al., Reference Tierney, Russell, Eggermont, Hopmans, Verschuren and Sinninghe Damsté2010; Loomis et al., Reference Loomis, Russell, Ladd, Eggermont, Street-Perrott and Sinninghe Damsté2011, Reference Loomis, Russell, Eggermont, Verschuren and Sinninghe Damsté2014a). Lake-specific calibrations have shown promise when applied to sediment cores from tropical lakes (e.g., Loomis et al., Reference Loomis, Russell, Ladd, Street-Perrott and Sinninghe Damsté2012, Reference Loomis, Russell and Lamb2015, Reference Loomis, Russell, Verschuren, Morrill, De Cort, Sinninghe Damsté, Olago, Eggermont, Street-Perrott and Kelly2017); however, soil-based calibrations have produced credible temperature reconstructions in temperate-zone lakes (e.g., Fawcett et al., Reference Fawcett, Werne, Anderson, Heikoop, Brown, Berke and Smith2011; Niemann et al., Reference Niemann, Stadnitskaia, Wirth, Gilli, Anselmetti, Sinninghe Damsté, Schouten, Hopmans and Lehmann2012; Watson et al., Reference Watson, Williams, Russell, Jackson, Shane and Lowell2018). We calculated the ratio of branched to isoprenoidal GDGTs (the BIT index) to assess the variability of GDGT contributions from bacterial and archaeal sources to the lake sediment (Hopmans et al., Reference Hopmans, Weijers, Schefuß, Herfort, Sinninghe Damsté and Schouten2004), which has been shown to inform the applicability of GDGTs to temperature reconstructions. We tested several brGDGT calibrations, including those developed for brGDGTs in soils by Weijers et al. (Reference Weijers, Schouten, Donker, van den, Hopmans and Sinninghe Damsté2007b) and Peterse et al. (Reference Peterse, van der Meer, Schouten, Weijers, Fierer, Jackson, Kim and Sinninghe Damsté2012), as well as lake-specific calibrations by Pearson et al. (Reference Pearson, Juggins, Talbot, Weckström, Rosén, Ryves, Roberts and Schmidt2011) and Sun et al. (Reference Sun, Chu, Liu, Xie, Li, Ling, Wang, Shi, Jia and Lü2011), to evaluate which calibration most accurately reflects modern temperatures at our site. We also used the CBT index (Weijers et al., Reference Weijers, Schouten, Donker, van den, Hopmans and Sinninghe Damsté2007b) to estimate pH and evaluate the relationship between BIT, pH, and temperature reconstructions from the brGDGTs.
Pollen analysis
Sediment samples were analyzed for pollen at 2- to 8-cm intervals and prepared using standard methods described by Jackson (Reference Jackson1999), including treatments with hot 10% KOH, 10% HCl, and 48% HF, sieving (180 μm), and acetolysis for two minutes. We added one Lycopodium tracer tablet (batch 3862, Lund University; 1 tablet=9666±671 spores) to the samples to calculate pollen concentrations (grains/cm3) and pollen accumulation rates (grains/cm2/yr), using the Bacon age model for the latter. A minimum of 300 terrestrial pollen grains were identified per sample at 400× magnification. Identifications were made to the lowest taxonomic level possible using reference collections and atlases (e.g., McAndrews et al., Reference McAndrews, Berti and Norris1973; Kapp et al., Reference Kapp, King and Davis2000). Pollen grains that could not be identified using available reference material were classified as “unknown,” while deteriorated or hidden pollen grains were classified as “indeterminate.” Terrestrial pollen percentages were calculated based on the total pollen sum of upland trees, shrubs, herbs (including Poaceae and Cyperaceae), and pteridophytes; aquatic pollen percentages were based on the total terrestrial and aquatic pollen sums. The pollen percentage record was divided into zones based on visual inspection and constrained cluster analysis (CONISS; Grimm, Reference Grimm1987). We carefully examined the pollen samples for coprophilous Sporormiella-type spores using reference material and illustrated guides (e.g., Bell, Reference Bell1983; van Geel et al., Reference van Geel, Buurman, Brinkkemper, Schelvis, Aptroot, van Reenen and Hakbijl2003; Cugny et al., Reference Cugny, Mazier and Galop2010). A subset of pollen samples spanning the entire record were counted for Sporormiella by both the Jackson and Williams labs to account for possible inter-lab biases and to confirm our findings.
We calculated the minimum dissimilarity of each fossil pollen sample from White Pond to 2594 modern pollen samples from eastern North America (east of 105°W; Whitmore et al., Reference Whitmore, Gajewski, Sawada, Williams, Shuman, Bartlein and Minckley2005) using the squared-chord distance (SCD) metric (Overpeck et al., Reference Overpeck, Webb and Prentice1985). SCD was calculated using the analogue program in R (Simpson, Reference Simpson2007) and incorporated 25 common eastern North American pollen taxa (see Williams et al., Reference Williams, Shuman and Webb2001 for list). Consistent with Jones et al. (Reference Jones, Williams and Jackson2017), we considered samples with a minimum SCD≥0.237 to have no modern analog. This threshold is based on receiver operating characteristic analysis and an analysis of paired modern assemblages from eastern North America (east of 105°W; Whitmore et al., Reference Whitmore, Gajewski, Sawada, Williams, Shuman, Bartlein and Minckley2005) from the same versus different vegetation formations (Gavin et al., Reference Gavin, Oswald, Wahl and Williams2003; Wahl, Reference Wahl2004).
Macroscopic charcoal analysis
Charcoal particles>125 µm were extracted at contiguous 1-cm intervals using standard sieving methods (Whitlock and Larsen, Reference Whitlock and Larsen2001). We dispersed sediments in a solution of 10% sodium hexametaphosphate, (NaPO3)6, and 5% sodium hypochlorite (bleach), NaClO, for 24 hours and sieved (125-µm mesh). The sieved fraction was counted on a gridded platform using a stereomicroscope, and charcoal attributable to graminoids (i.e. Poaceae and other monocots) was distinguished from other types of charcoal (wood, conifer needles, and dicot leaves) based on morphology (Jensen et al., Reference Jensen, Lynch, Calcote and Hotchkiss2007; Mustaphi and Pisaric, Reference Mustaphi and Pisaric2014). Large charcoal particles (>125 µm) are assumed to record high-severity fires within a few kilometers of the study site (Higuera et al., Reference Higuera, Gavin, Bartlein and Hallett2010). Our analysis focused on long-term trends in total charcoal accumulation rates (CHAR; particles/cm2/yr), as well as changes in the percentage of graminoid (“grass”) charcoal over time to better understand the nature of past fires (i.e., surface versus crown fires). CHAR was calculated by dividing charcoal concentration (particles/cm3) by deposition time (yr/cm) obtained from the age-depth model.
RESULTS
Lithology and chronology
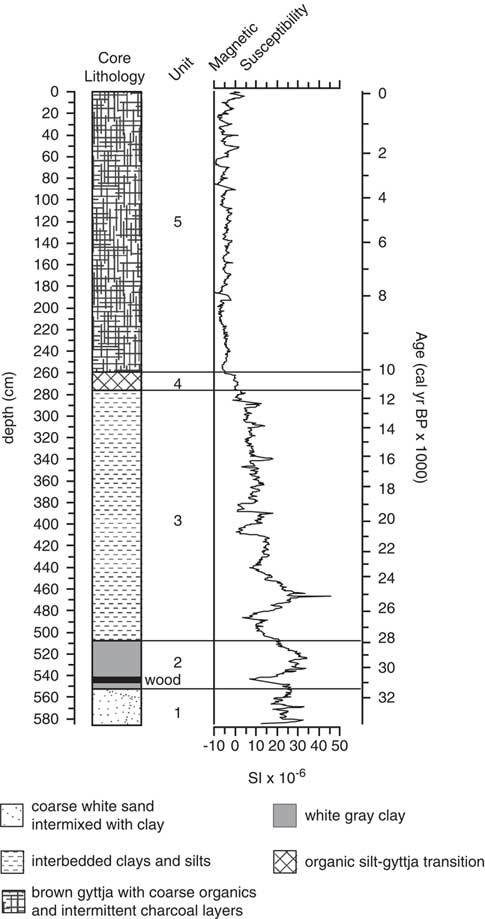
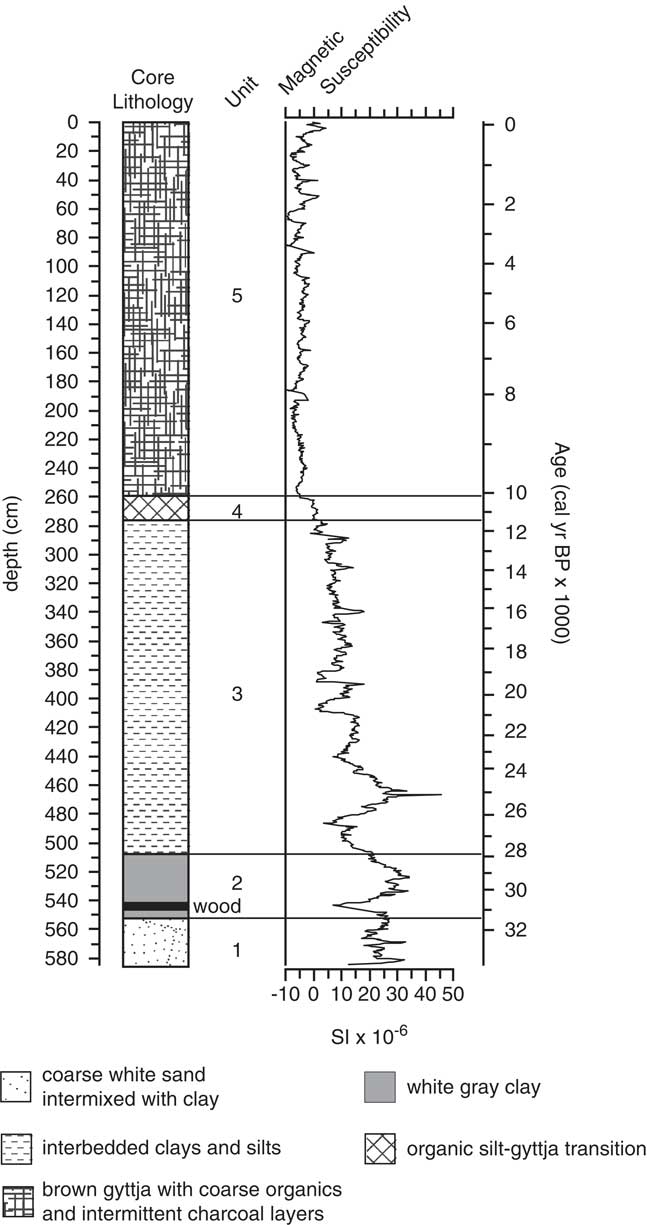
The core lithology consisted of five units with no evidence of depositional hiatuses (e.g., abrupt lithological transitions, mottling, oxidative coloration, and blocky or prismatic sediment structures; Fig. 2). The base of the core (584 cm depth) is estimated to have an age of 33,300 cal yr BP, and the age-depth model indicates constant sedimentation (average rate=13 cm/1000 yr) through the late Pleistocene, with notable changes in average sedimentation rates during the early Holocene (Fig. 3). From 584 to 553 cm depth (33,300 to 31,500 cal yr BP), lithological unit 1 consisted of massive coarse white sand mixed with clay with high magnetic susceptibility (13 to 33 SI units), indicating relatively high mineral clastic content. Unit 2, 553 to 507 cm depth (31,500 to 27,800 cal yr BP), was characterized by massive white-gray clay and included a 4-cm wood layer at 548 cm depth; high magnetic susceptibility (7 to 34 SI units) indicates high clastic mineral content. From 507 to 276 cm depth (27,800 to 11,500 cal yr BP), unit 3 featured interbedded gray clay and silt layers with increasingly abundant organic matter towards the top of the unit; sediment magnetic susceptibility values gradually decreased (−1 to 46 SI units), indicating diminishing clastic content. Unit 4, 272 to 262 cm depth (11,500 to 10,400 cal yr BP), was a transitional unit from organic clays and silts to brown gyttja that featured low sediment magnetic susceptibility values (−1 to 2 SI units). Unit 5, the uppermost unit, <262 cm depth (10,500 cal yr BP to present), was composed of brown gyttja with abundant coarse organics and intermittent charcoal layers, and magnetic susceptibility values reached their lowest levels of the record (−11 to 4.3 SI units). Within this lithologically uniform upper unit, the age model indicates that average sedimentation rates increased to 66 cm/1000 yr between 240 and 184 cm depth (8700 to 7900 cal yr BP), and subsequently decreased to 22 cm/1000 yr thereafter (Fig. 3). With the exception of this brief 800-yr period of elevated sedimentation, average Holocene sedimentation rates were lower than typical Holocene rates for lakes in eastern North America (Goring et al., Reference Goring, Williams, Blois, Jackson, Paciorek, Booth, Marlon, Blaauw and Christen2012), but comparable to other continuous Holocene records from the Southeast (Jones et al., Reference Jones, Williams and Jackson2017).
Bacon age-depth model for White Pond. In the main plot (bottom), blue violin plots show the probability-density function for each calibrated radiocarbon age estimate. Dotted red line indicates weighted averages of all fitted chronologies. Grayscale cloud represents age-model probability and is bounded by a dotted line representing the confidence interval (95%). Left top plot shows the Markov chain Monte Carlo (MCMC) iteration history, the middle top plot shows the prior (line) and posterior densities (area fill) for the mean accumulation rate, and the right top plot shows the prior (line) and posterior (area fill) of sediment memory (1-cm autocorrelation strength). (For interpretation of the references to color in this figure legend, the reader is referred to the web version of this article.)

brGDGT-based paleotemperature reconstruction
The BIT index varied between 0.93 and 1.0 in sediments from White Pond, indicating that the majority of the GDGTs were derived from bacteria. BIT values were originally interpreted to reflect the relative contribution of GDGTs derived from soils (brGDGTs) versus aquatic environments (isoprenoidal GDGTs), but subsequent work has shown that lake sediments can have abundant aquatically-derived brGDGTs (e.g., Tierney et al., Reference Tierney, Russell, Eggermont, Hopmans, Verschuren and Sinninghe Damsté2010; Buckles et al., Reference Buckles, Weijers, Tran, Waldron and Sinninghe Damsté2014; Loomis et al., Reference Loomis, Russell, Eggermont, Verschuren and Sinninghe Damsté2014a; Weber et al., Reference Weber, de Jonge, Rijpstra, Hopmans, Stadnitskaia, Schubert, Lehmann, Sinninghe Damsté and Niemann2015). The high BIT values in White Pond sediments are compatible with an abundance of soil-derived GDGTs, assuming the brGDGTs are terrestrial, and the stability of the BIT index through time suggests little change in GDGT sources to the sediment that might impact our temperature reconstructions.
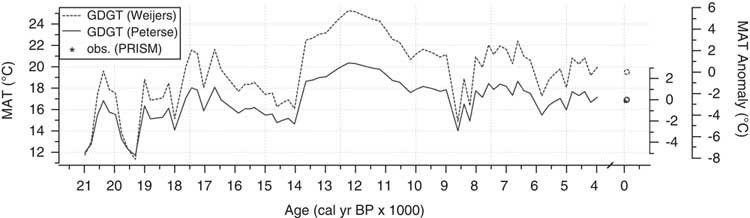
The five mean annual temperature (MAT) calibrations yielded similar trends in temperature over time, but with significant differences in average values (Fig. 4; Supplementary Fig. 1). The Peterse et al. (Reference Peterse, van der Meer, Schouten, Weijers, Fierer, Jackson, Kim and Sinninghe Damsté2012) and Weijers et al. (Reference Weijers, Schouten, Donker, van den, Hopmans and Sinninghe Damsté2007b) calibrations produced temperature estimates in the modern sediment that were closest to the instrumental mean annual air temperature at White Pond (17.1°C; PRISM Climate Group, Reference PRISM Climate Group2016), which might suggest that the brGDGTs in White Pond were produced in soils (see also Watson et al., Reference Watson, Williams, Russell, Jackson, Shane and Lowell2018). Soil pH values inferred from CBT (Peterse et al., Reference Peterse, van der Meer, Schouten, Weijers, Fierer, Jackson, Kim and Sinninghe Damsté2012) average 5.9 and vary between 4.7 and 6.8. pH values were relatively high during the late glacial period, became gradually more acidic during the deglaciation, and average 5.2 in sediments deposited during the last 10 ka. The gradual decrease in pH during the last deglaciation is compatible with increasing vegetation cover and chemical weathering (e.g., Weijers et al., Reference Weijers, Schefuß, Schouten and Damsté2007a) as climate became warmer and wetter, and the relatively acidic values during the Holocene are compatible with pH values of sandy soils covered with pine forests, such as those surrounding White Pond today. Together, these lines of evidence all suggest a terrigenous source for the brGDGTs in White Pond.
Reconstructed mean annual temperature at White Pond based on brGDGT data and the calibrations of Weijers et al. (Reference Weijers, Schouten, Donker, van den, Hopmans and Sinninghe Damsté2007b; dashed line) and Peterse et al. (Reference Peterse, van der Meer, Schouten, Weijers, Fierer, Jackson, Kim and Sinninghe Damsté2012; solid line).

The Peterse et al. (Reference Peterse, van der Meer, Schouten, Weijers, Fierer, Jackson, Kim and Sinninghe Damsté2012) modern calibration (16.9°C) is closest to the instrumental value, and we used this calibration in our downcore reconstructions. Neither reconstructed soil pH nor BIT values are correlated to reconstructed MAT values (R 2=0.06 and 0.00, respectively); soil chemistry and GDGT source had little impact on temperature reconstructions. The Peterse et al. (Reference Peterse, van der Meer, Schouten, Weijers, Fierer, Jackson, Kim and Sinninghe Damsté2012) calibration has a relatively large error (root-mean-square error) of 5.0°C, which could derived from many sources, including analytical error, uncertainty in the MAT values to which brGDGTs are calibrated, and/or inherent variability in the response of brGDGTs to changes in MAT. As such, our temperature reconstruction is primarily qualitative, and our interpretations focus primarily on trends rather than absolute values.
MATs according to the Peterse et al. (Reference Peterse, van der Meer, Schouten, Weijers, Fierer, Jackson, Kim and Sinninghe Damsté2012) calibration were low but gradually increasing between 21,000 and 16,500 cal yr BP. During this time, temperatures were highly variable and ranged from 11.7 to 18.1°C (average=15.2°C). After 16,600 cal yr BP, inferred temperatures decreased slightly until 13,800 cal yr BP and varied between 14.7 and 16.9°C (average=15.6°C). At 13,800 cal yr BP, MAT increased abruptly and reached the highest temperatures of the record until 10,500 cal yr BP; temperatures ranged from 18.6 to 20.4°C (average=19.5°C) over this period and peaked at 12,200 cal yr BP. After 10,500 cal yr BP, inferred temperatures gradually decreased and varied between 15.5 and 18.6°C (average=17.5°C), with the exception of an abrupt temperature excursion toward colder temperatures between 9000 and 8000 cal yr BP; MAT varied between 14.0 and 16.5°C (average=15.2°C) during this cold period and were similar to temperatures recorded during the late glacial period.
Pollen sequence
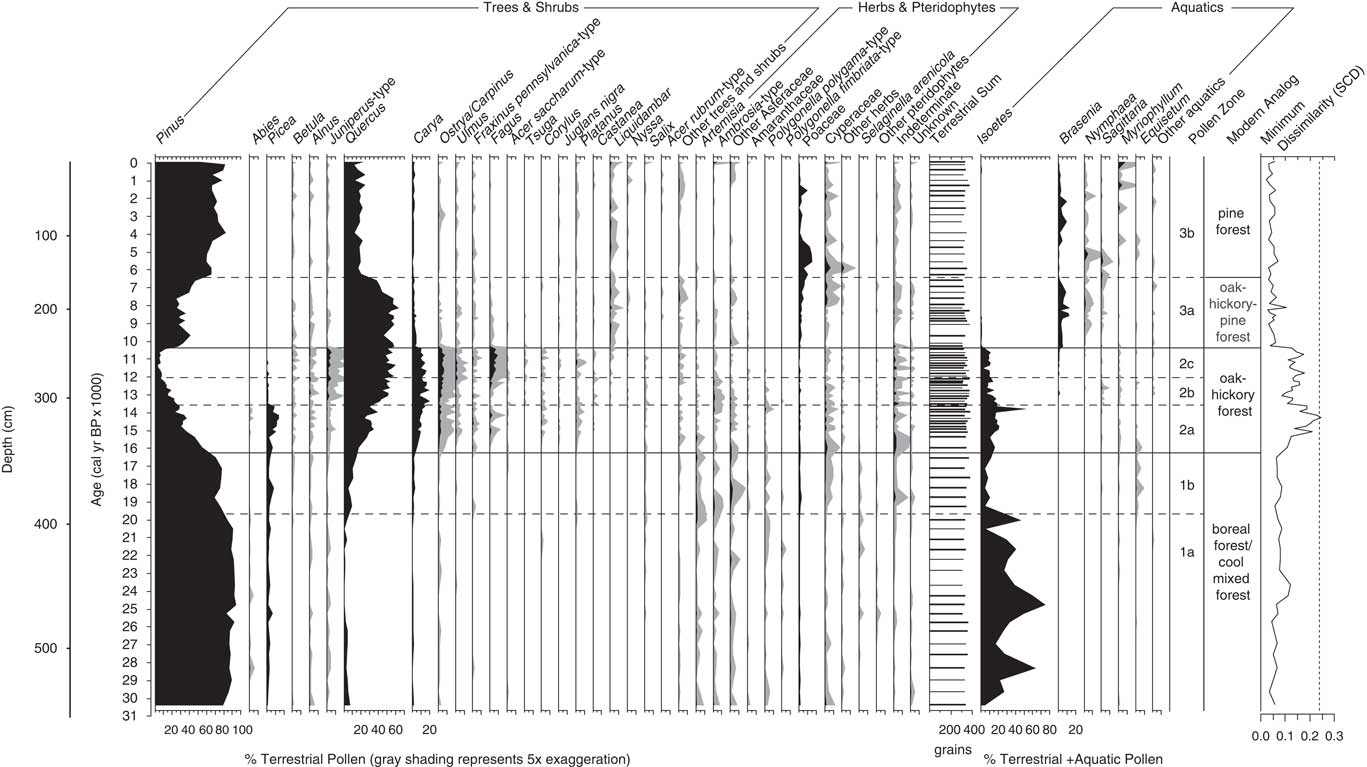
The White Pond fossil pollen record featured three broad zones between 30,000 cal yr BP and present, based on CONISS and visual inspection (Fig. 5; Supplementary Fig. 2). These informal zones represent broad transitions between conifer and hardwood vegetation and are further divided into subzones based on changes in the abundance of specific taxa. Sediments older than 30,000 cal yr BP (below 540 cm depth) had very poor pollen preservation and were not counted as part of the analysis.
Pollen percentage profile for White Pond, showing selected taxa. Minimum vegetation dissimilarity to modern pollen assemblages (an index of novelty and no-analog communities) is represented as square-chord distance values (SCD). Pollen zonation based on CONISS (Grimm, Reference Grimm1987) and visual inspection. The no-analog threshold (SCD=0.237; Jones et al., Reference Jones, Williams and Jackson2017) is shown as a vertical dashed line.

Basal subzone WHT-1a (30,400 to 19,700 cal yr BP; 540 to 391 cm depth) featured high levels of Pinus pollen (70 to 95%) and very low percentages of hardwood taxa, including Quercus (<7%), Carya (<1%), and Ostrya/Carpinus (<1%). Picea pollen occurred at low to moderate levels (1 to 7%), while Abies occurred sporadically and recorded low percentages (<1%). Total upland herbaceous pollen, including Artemisia (<2%), Ambrosia-type (<2%), Asteraceae (<3%), and Poaceae (<2%), occurred at sustained low to moderate levels (2 to 10%), as did percentages of Polygonella polygama-type and P. fimbriata-type pollen (<2%) and Selaginella arenicola spores (<1%). Isoetes (5 to 75%) dominated aquatic assemblages, often at very high levels.
Gradually increasing levels of Quercus pollen (5 to 14%) and to a lesser extent, Carya (1 to 2%), characterized subzone WHT-1b (19,700 to 16,300 cal yr BP; 391 to 341 cm depth); Pinus percentages decreased slightly (69 to 78%). Picea levels increased somewhat (3 to 8%), while Abies pollen was absent from the record. Pollen from upland herbaceous taxa increased slightly (5 to 13%), mostly due to elevated Asteraceae levels (<4%). Isoetes continued to dominate aquatic assemblages, although at substantially diminished levels (4 to 12%), and Equisetum spores occurred at low percentages (<2%).
Subzone WHT-2a (16,300 to 13,500 cal yr BP; 341 to 304 cm depth) featured decreasing Pinus pollen percentages (23 to 54%) and increasing levels of hardwood taxa, including Quercus (17 to 38%), Carya (5 to 14%), Ostrya/Carpinus (1 to 4%), and Fagus (<3%). Pollen from other hardwood taxa at low but consistent levels, including Ulmus (<1%), Fraxinus pennsylvanica-type (<2%), Juglans nigra-type (<1%), Corylus (<1%), and Platanus (<2%). Picea registered the highest percentages (1 to 15%) of the record in this subzone. Levels of upland herbaceous pollen slightly decreased (2 to 9%), while percentages of Isoetes spores increased (10 to 49%).
Pinus pollen percentages continued to decrease (6 to 24%) in subzone WHT-2b (13,500 to 12,000 cal yr BP; 304 to 284 cm depth), while Picea dropped to very low levels (<2%). Percentages of Carya reached their highest levels (8 to 19%) of the record, and Quercus (36 to 53%) and Ostrya/Carpinus (3 to 10%) continued to increase; percentages of Fagus (<3%), Ulmus (<3%), Fraxinus pennsylvanica-type (<2%) and other hardwood taxa (Juglans nigra-type, Corylus, and Platanus) and herbaceous pollen (5 to 8%) remained unchanged. Juniperus pollen increased slightly (1 to 6%) from the previous zone. Percentages of Isoetes decreased (5 to 19%) but continued to dominate the aquatic assemblage.
Subzone WHT-2c (12,000 to 10,400 cal yr BP; 284 to 262 cm depth) was characterized by very low Pinus levels (2 to 12%) and the highest percentages of Fagus (4 to 10%), Ostrya/Carpinus (4 to 9%), Corylus (<2%), and Platanus (<2%) of the record. Levels of Quercus continued to increase (47 to 59%), while Carya decreased slightly (9 to 16%). Ulmus (<3%), Fraxinus pennsylvanica-type (<2%), and Juglans nigra-type (<1%) percentages remained unchanged, and Juniperus pollen sustained high levels (2 to 7%). Upland herbaceous taxa reached their lowest levels (2 to 4%) of the record, and percentages of Isoetes continued to decrease (1 to 11%).
A step-like increase in Pinus pollen to moderate amounts (25 to 45%) marked the transition to subzone WHT-3a (10,400 to 6400 cal yr BP; 262 to 149 cm depth). Levels of Carya (1 to 4%), Ostrya/Carpinus (<2%), Corylus (<1%), and Fagus (<1%) decreased, as did Juniperus-type percentages (<1%). Quercus levels remained high (40 to 60%), and percentages of Ulmus (<2%) and Fraxinus pennsylvanica-type (<1%) pollen were relatively unchanged. Liquidambar pollen registered consistent low levels (<3%). Percentages of Poaceae (1 to 5%) and Cyperaceae (<4%) increased, particularly towards the top of the subzone. Brasenia (1 to 15%) replaced Isoetes (<1%) as the dominant taxa in the aquatic assemblage; Nymphaea pollen percentages increased as well (<2%).
Subzone WHT-3b (6400 cal yr BP to present; 149 to 0 cm depth) featured decreased levels of Quercus (10 to 25%) and elevated Pinus pollen percentages (55 to 80%). Pollen from hardwood taxa were poorly represented, with the exception of Liquidambar, which maintained consistent low levels (<3%). Percentages of Poaceae pollen were elevated in at the bottom of the subzone and decreased (<15%) towards the present day. Brasenia pollen (<10%) continued to dominate the aquatic assemblage, which also included low to moderate amounts of Nymphaea (<5%) and Myriophyllum (<10%) pollen.
Sporormiella-type spores
With the exception of the modern surface sample, no Sporormiella-type spores were observed in pollen samples obtained from the White Pond sediments.
Analog analysis
Almost all fossil pollen assemblages had modern analogs (Fig. 5). Prior to 16,300 cal yr BP, fossil assemblages most resembled modern boreal forests and cool mixed forests of the Appalachian Mountains. Increasing hardwood taxa, including Quercus, Carya, Fraxinus pennsylvanica-type, and Ostrya/Carpinus, at 16,300 cal yr BP marks the onset of elevated minimum dissimilarities that last until 10,400 cal yr BP (pollen zone WHT-2), indicating a period of high ecological novelty in the southeastern United States relative to modern assemblages in North America. Except for the pollen assemblage at 14,300 cal yr BP, however, minimum dissimilarities never exceed the 0.237 no-analog threshold used in previous Southeast studies (Jones et al., Reference Jones, Williams and Jackson2017). Pollen assemblages between 16,300 and 10,400 cal yr BP had modern analogs in oak-hickory forests of the central Great Lakes region, while the no-analog assemblage at 14,300 cal yr BP featured particularly high levels of Picea and Fagus pollen. After 10,400 cal yr BP, Carya, Ostrya/Carpinus, Fraxinus pennsylvanica-type, and Fagus pollen sharply decrease and Pinus pollen abundance increases. Levels of Quercus pollen remain relatively unchanged until 6400 cal yr BP when they subsequently decreased. Assemblages from this high Quercus period (pollen subzone WHT-3a) generally match modern assemblages in oak-hickory-pine forests of the Appalachian Mountains. Following the decline in Quercus, assemblages after 6400 cal yr BP (pollen subzone WHT-3b) resemble samples from present-day pine forests in the Southeast.
Macroscopic charcoal data
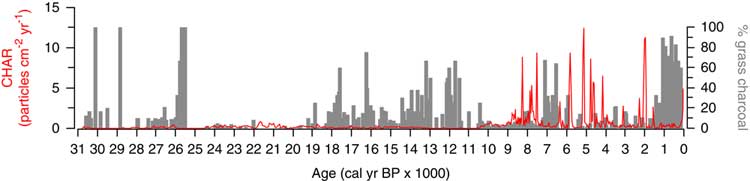
Late Pleistocene and Holocene sediments from White Pond differed significantly in their abundance of macroscopic charcoal (Fig. 6). Total CHAR values were extremely low in late Pleistocene sediments and increased substantially at the start of the Holocene. Before 10,400 cal yr BP, CHAR ranged from 0–0.889 particles/cm2/yr (average=0.103 particles/cm2/yr), and elevated periods of grass charcoal were recorded between 30,400 and 25,500 cal yr BP (average=12.59%), and from 19,300 to 10,400 cal yr BP (average=12.63%). After 10,400 cal yr BP, total CHAR increased tenfold and remained high throughout the Holocene (0.009–12.404 particles/cm2/ yr, average=1.101 particles/cm2/yr). A number of very large charcoal peaks are recorded at 8300 cal yr BP (8.78 particles/cm2/yr), 7500 cal yr BP (9.40 particles/cm2/yr), 5800 cal yr BP (8.78 particles/cm2/yr), 5100 cal yr BP (12.40 particles/cm2/yr), 4800 cal yr BP (8.60 particles/cm2/yr), and 2000 cal yr BP (11.26 particles/cm2/yr), and likely represent high-severity fire events. Elevated levels of grass charcoal occurred between 7100 and 6500 cal yr BP (average=24.70%), and from 1200 cal yr BP to present (average=35.65%).
Macroscopic charcoal profile for White Pond. Solid red line denotes total charcoal accumulation rate (CHAR), and gray bars show relative contribution of grass charcoal to overall charcoal sum (% grass charcoal). (For interpretation of the references to color in this figure legend, the reader is referred to the web version of this article.)

DISCUSSION
The paleorecord at White Pond covers the central portion of a network of well-dated fossil pollen records in the southeastern United States (Fig. 1), including Jackson and Anderson ponds in the Interior Low Plateaus region of Kentucky and Tennessee (Liu et al., Reference Liu, Andersen, Williams and Jackson2013), Cupola Pond in the Ozark highlands of southern Missouri (Jones et al., Reference Jones, Williams and Jackson2017), and Lake Tulane in peninsular Florida (Grimm et al., Reference Grimm, Watts, Jacobson, Hansen, Almquist and Dieffenbacher-Krall2006). These sites provide a point of comparison with the White Pond record to better understand spatiotemporal patterns and mechanisms of late Quaternary vegetation change in the southeastern United States. While additional records from the region (Fig. 1) still have substantial dating uncertainties owing to chronologies based on bulk-sediment 14C dates and/or low density of dates, some patterns can still be discerned.
How were millennial-scale climate events recorded in Greenland and the North Atlantic expressed in vegetation records from the Southeast?
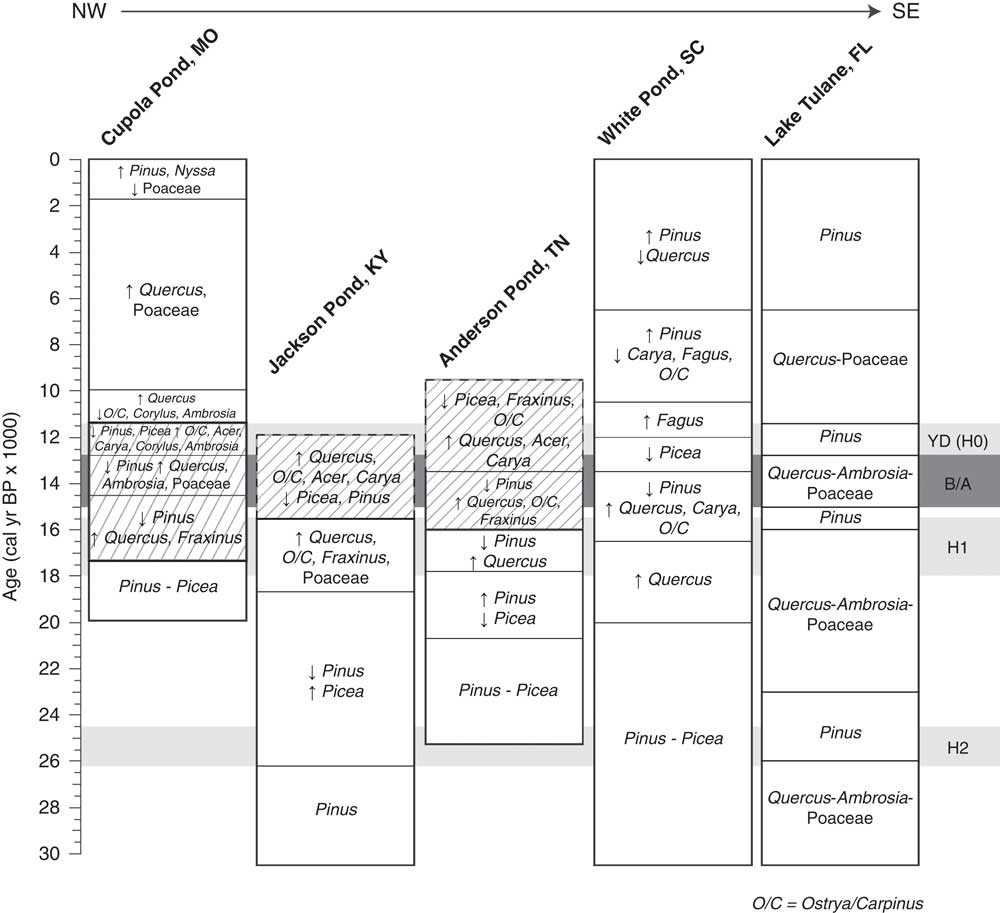
During the last glacial period (65–21 cal yr BP), δ18O profiles from Greenland ice cores record millennial-scale Dansgaard-Oeschger cycles, periods of short-term warming (ca. 60 yr) followed by slow cooling (up to 2000 yr; Dansgaard et al., Reference Dansgaard, Johnsen, Clausen, Dahl-Jensen, Gundestrup, Hammer and Oeschger1984), and marine cores from the North Atlantic record ice-rafted debris deposits (Heinrich events) associated with cold stadials (Heinrich, Reference Heinrich1988). The best continental evidence for Heinrich events in North America comes from Lake Tulane in peninsular Florida (Grimm et al., Reference Grimm, Watts, Jacobson, Hansen, Almquist and Dieffenbacher-Krall2006), which records rapid millennial-scale alternations between cool, dry Quercus-scrub/prairie and warm, wet Pinus phases. These correspond respectively to the warm phases of Dansgaard-Oeschger cycles and the cold Heinrich events back to Heinrich (H) event H6, suggesting that temperature variations in central Florida were antiphased to those in the North Atlantic (Grimm et al., Reference Grimm, Watts, Jacobson, Hansen, Almquist and Dieffenbacher-Krall2006). The Jackson Pond record from central Kentucky indicates a shift from Pinus to Picea dominance ca. 26,000 cal yr BP that is coeval with the onset of H2 and a warm, wet Pinus phase at Lake Tulane (Fig. 7). The transition to Picea at 26,000 cal yr BP suggests a shift to wetter and possibly cooler conditions in the Interior Low Plateaus region during H2, in partial contrast to warmer and wetter conditions at Lake Tulane. Moreover, the H2 Pinus phase is brief at Lake Tulane, reverting back to Quercus-scrub/prairie at 23,000 cal yr BP, while the Picea-dominated vegetation at Jackson Pond persists until 19,000 to 18,000 cal yr BP (Fig. 7; Liu et al., Reference Liu, Andersen, Williams and Jackson2013).
Comparison of late Quaternary vegetation changes from well-dated pollen records in the southeastern US, including Cupola Pond (Jones et al., Reference Jones, Williams and Jackson2017), Jackson Pond (Liu et al., 2012), Anderson Pond (Liu et al., 2013), White Pond (this study), and Lake Tulane (Grimm et al., Reference Grimm, Watts, Jacobson, Hansen, Almquist and Dieffenbacher-Krall2006). Arrows indicate increasing or decreasing trends in pollen percentage data, and hatching represents assemblages lacking modern analogs (SCD≥0.237; Jones et al., Reference Jones, Williams and Jackson2017). The ages and time spans of the Heinrich events (light gray bands) are based on GICC05 chronology (Svensson et al., Reference Svensson, Andersen, Bigler, Clausen, Dahl-Jensen, Davies, Johnsen, Muscheler, Parrenin, Rasmussen, Röthlisberger, Seierstad, Steffensen and Vinther2008), while the timing of the Bølling-Allerød (B/A, dark gray band) is based on Rasmussen et al. (Reference Rasmussen, Andersen, Svensson, Steffensen, Vinther, Clausen and Siggaard-Andersen2006).

Consistently high levels of Pinus and moderate amounts of upland herbaceous pollen between 30,000 and 20,000 cal yr BP at White Pond suggest generally cool, dry conditions. Unfortunately, because the brGDGT analyses were designed to address questions about deglacial climate and vegetation change, they do not extend before 21,000 cal yr BP. However, a decline of Quercus pollen from low to trace percentages ca. 26,000 cal yr BP coincides with onset of H2 and may indicate a transition to cooler conditions (Fig. 8). Records from the North Carolina Coastal Plain (Rockyhock Bay, NC; Whitehead, Reference Whitehead1981) and Georgia highlands (Green Pond; Watts, Reference Watts1973), Bob Black Pond (Watts, Reference Watts1970) also show higher levels of Quercus and other deciduous taxa, and hence warmer conditions, before 26,000 cal yr BP, although these chronologies are not as well constrained by 14C dates (all bulk sediment). A Quercus-Betula-Alnus maximum is recorded at Rockyhock Bay between 32,000 and 28,000 cal yr BP, and a Pinus-Quercus-Carya assemblage prevailed at Green and Bob Black ponds between ca. 33,000 and 27,000 cal yr BP; in all cases, these assemblages are succeeded by increases in Pinus and Picea. Not only is 26,000 cal yr BP associated with the onset of H2, but the interval of higher hardwoods prior to 26,000 cal yr BP also coincides with a period of extensive ice retreat indicated by glacial and non-glacial sediments in the Great Lakes region (Farmdalian Interstadial of Willman and Frye, Reference Willman and Frye1970), probably equivalent to the Plum Point Interstadial (Fullerton, Reference Fullerton1980; Karrow et al., Reference Karrow, Dreimanis and Barnett2000) between 32,000 and 26,000 cal yr BP.
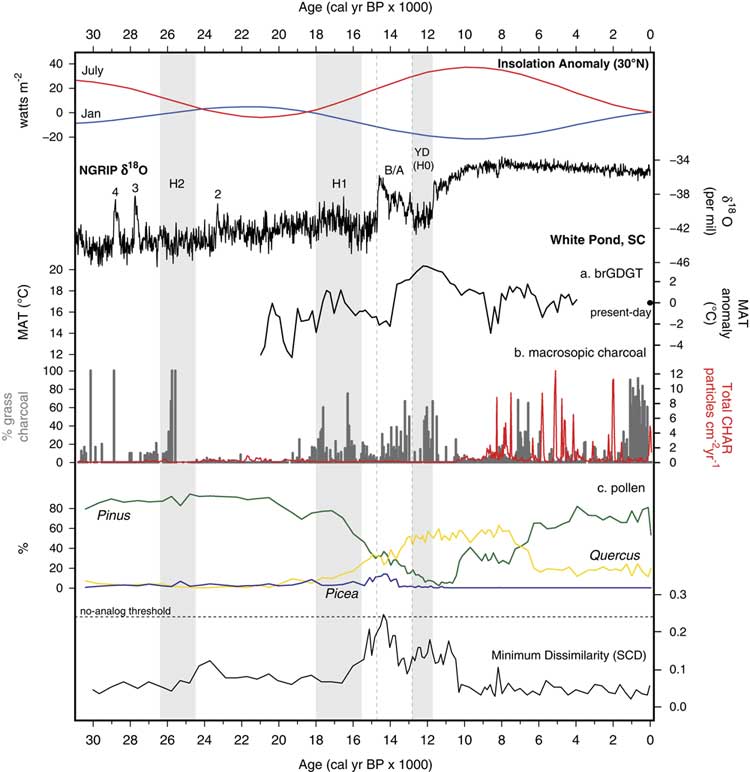
(color online) Summary of (a) paleotemperature (brGDGT), (b) macroscopic charcoal, and (c) pollen data from White Pond, compared with January and July insolation anomalies at 30°N (Berger and Loutre, Reference Berger and Loutre1991) and the NGRIP δ18O curve (Rasmussen et al., Reference Rasmussen, Andersen, Svensson, Steffensen, Vinther, Clausen and Siggaard-Andersen2006). The no-analog threshold (SCD=0.237; Jones et al., Reference Jones, Williams and Jackson2017) is shown as a horizontal dashed line. The White Pond paleotemperature reconstruction is based on brGDGT data using the Peterse et al. (Reference Peterse, van der Meer, Schouten, Weijers, Fierer, Jackson, Kim and Sinninghe Damsté2012) calibration. The Greenland interstadials (i.e., Dansgaard-Oeschger interstadials) are numbered above the δ18O graph. The ages and time spans of the Heinrich events (gray bands) are based on GICC05 chronology (Svensson et al., Reference Svensson, Andersen, Bigler, Clausen, Dahl-Jensen, Davies, Johnsen, Muscheler, Parrenin, Rasmussen, Röthlisberger, Seierstad, Steffensen and Vinther2008). The timing of the Bølling-Allerød (B/A, gray vertical dashed lines) is based on Rasmussen et al. (Reference Rasmussen, Andersen, Svensson, Steffensen, Vinther, Clausen and Siggaard-Andersen2006).

During the deglacial period (21,000 to 11,700 cal yr BP), global MATs increased by 3.5 to 5.5°C (Liu et al., Reference Liu, Otto-Bliesner, He, Brady, Tomas, Clark and Carlson2009; Shakun and Carlson, Reference Shakun and Carlson2010) and perhaps as much as 10°C in the north-central United States (Watson et al., Reference Watson, Williams, Russell, Jackson, Shane and Lowell2018). Superimposed on this gradual warming trend were the Bølling-Allerød, a relatively warm and wet interstadial registered between 14,700 and 12,900 cal yr BP in the North Atlantic (Rasmussen et al., Reference Rasmussen, Andersen, Svensson, Steffensen, Vinther, Clausen and Siggaard-Andersen2006) and the Younger Dryas, a subsequent cold stadial recorded between 12,900 and 11,700 cal yr BP (Rasmussen et al., Reference Rasmussen, Andersen, Svensson, Steffensen, Vinther, Clausen and Siggaard-Andersen2006; Svensson et al., Reference Svensson, Andersen, Bigler, Clausen, Dahl-Jensen, Davies, Johnsen, Muscheler, Parrenin, Rasmussen, Röthlisberger, Seierstad, Steffensen and Vinther2008; Shakun et al., Reference Shakun, Clark, He, Marcott, Mix, Liu, Otto-Bliesner, Schmittner and Bard2012). At Lake Tulane in peninsular Florida, Bølling-Allerød warming was associated with a cool, dry Quercus-scrub/prairie phase, while the Younger Dryas was linked to a warm, wet Pinus phase, providing additional evidence that temperature variations in central Florida were antiphased to those in the North Atlantic (Grimm et al., Reference Grimm, Watts, Jacobson, Hansen, Almquist and Dieffenbacher-Krall2006). At Cupola Pond in southern Missouri, the onset of the Bølling-Allerød and Younger Dryas was associated with the development of two distinct no-analog pollen assemblages (Jones et al., Reference Jones, Williams and Jackson2017). The first assemblage (Bølling-Allerød) included low amounts of Pinus and high percentages of Picea, Quercus, and Fraxinus, while the second (Younger Dryas) was associated with declines in Pinus and Picea and increases in Ostrya/Carpinus, Carya, and Ambrosia pollen, which suggest warming during the Younger Dryas (Jones et al., Reference Jones, Williams and Jackson2017).
Like Lake Tulane (Florida) and Cupola Pond (Ozark highlands), the fossil pollen and brGDGT-based temperature records from White Pond diverge from patterns of millennial-scale deglacial temperature variability recorded in the North Atlantic. Between 19,700 and 12,000 cal yr BP, Pinus and Picea decrease in the fossil pollen record and are replaced by hardwood taxa, first Quercus and Carya followed by Ostrya/Carpinus, Ulmus, Fraxinus, and Fagus under a generally warming but variable climate implied by the brGDGT data (Fig. 4 and 8). The Bølling-Allerød coincides with a period of cooling at White Pond between 16,500 and 13,800 cal yr BP, while the onset of the Younger Dryas postdates rapid increases in temperature at 13,800 cal yr BP by almost 1000 yr (Fig. 8). Furthermore, warm conditions persisted at White Pond after the termination of the Younger Dryas until 10,800 cal yr BP (Fig. 4). Similar to Lake Tulane and Cupola Pond, the White Pond record suggests that the Atlantic Coastal Plain was warm during the Younger Dryas while the North Atlantic region cooled.
How strongly did no-analog plant communities manifest at White Pond and elsewhere in the Southeastern Coastal Plain? Were late-glacial vegetational changes linked to declining megaherbivore populations and changing fire regimes?
The last deglaciation in eastern North America was marked by the widespread development of pollen assemblages lacking modern analogs, indicating vegetation with no modern counterparts (Williams et al., Reference Williams, Shuman and Webb2001; Jackson and Williams, Reference Jackson and Williams2004; Williams and Jackson, Reference Williams and Jackson2007). Although these no-analog assemblages varied both spatially and temporally, all are characterized by a mixture of northern conifers (Picea, Pinus), temperate hardwoods (always Quercus, often Carya), mesic hardwoods (variously Ostrya/Carpinus, Fraxinus pennsylvanica-type, Ulmus, Acer, and Fagus), and sometimes herbaceous elements (Cyperaceae, Artemisia, Ambrosia). Regardless of location, all developed within a broader glacial to interglacial transition from coniferous to hardwood forests, inasmuch as they were preceded by pollen assemblages dominated by Picea and northern Pinus, and all developed while conifers (especially Pinus) declined and Quercus and other hardwoods increased (Jackson and Williams, Reference Jackson and Williams2004; Gill et al., Reference Gill, Williams, Jackson, Lininger and Robinson2009, Reference Gill, Williams, Jackson, Donnelly and Schellinger2012; Liu et al., Reference Liu, Andersen, Williams and Jackson2013; Jones et al., Reference Jones, Williams and Jackson2017; Watson et al., Reference Watson, Williams, Russell, Jackson, Shane and Lowell2018). White Pond records a similar transition starting at 16,300 cal yr BP, with gradually declining Pinus and increasing Quercus and Carya (Fig. 5). Percentages of Ostrya/Carpinus, Ulmus, and Fraxinus pennsylvanica-type also increased but remained at low levels. Unglaciated sites to the north and west, Anderson, Cupola, and Jackson ponds, also record conifer-to-deciduous transitions commencing at 15,900, 15,700, and 15,400 cal yr BP, respectively, consistent with a time-transgressive response to regional warming (Liu et al., Reference Liu, Andersen, Williams and Jackson2013; Jones et al., Reference Jones, Williams and Jackson2017).
The White Pond pollen assemblages between 16,300 and 10,400 cal yr BP, representing three distinct pollen subzones (Fig. 5), resemble no-analog assemblages recorded at sites further north and west, but are more weakly expressed. Hence, dissimilarity scores are elevated but do not quite exceed the conservative dissimilarity threshold we applied (0.237). Critical differences are the higher percentages of Quercus and lower percentages of Picea and mesic hardwoods than sites in the unglaciated plateaus and glaciated central Great Lakes region. Hence, the White Pond assemblages appear to represent a dampened manifestation of the same general phenomenon: a unique mix of northern conifers (Picea, Pinus), temperate hardwoods (Quercus, Carya), and mesic hardwoods (in the case of White Pond, primarily Ostrya/Carpinus and Fagus). Similar to sites in the interior, White Pond shows evolution of vegetation composition during this no-analog period (Subzones 2a–2c in Fig. 5).
In formerly glaciated regions of the central Great Lakes region (Appleman Lake, Indiana and Silver lakes, Ohio; Fig. 1), the onset of no-analog pollen assemblages between 14,500 and 14,000 cal yr BP has been linked to declines in megafaunal populations and intensified fire regimes based on coprophilous fungal spore (e.g., Sporormiella) and macroscopic charcoal analyses (Gill et al., Reference Gill, Williams, Jackson, Lininger and Robinson2009, Reference Gill, Williams, Jackson, Donnelly and Schellinger2012). In contrast, Sporormiella spores were not found at White Pond, similar to findings at Jackson, Anderson, and Cupola ponds to the north and west (Liu et al., Reference Liu, Andersen, Williams and Jackson2013; Jones et al., Reference Jones, Williams and Jackson2017). Furthermore, macroscopic charcoal abundance (total CHAR) remained low throughout the deglacial period (Fig. 6), similar to Cupola Pond (Jones et al., Reference Jones, Williams and Jackson2017), and it appears that fire did not play a role in shaping no-analog assemblages at White Pond.
The dearth of Sporormiella at the southeastern lakes is enigmatic, given the abundance of megafaunal remains uncovered in the Southeast (Voorhies, Reference Voorhies1974; Webb, Reference Webb1974; Hemmings, Reference Hemmings1975; Roth and Laerm, Reference Roth and Laerm1980; Hoffman, Reference Hoffman1983). The lack of spores may be due to differing intensities of megafaunal activity in depositional basins sited in open versus wooded landscapes, the ratio of grazers to browsers, taphonomic processes, or combination of these factors (Gill et al., Reference Gill, McLauchlan, Skibbe, Goring, Zirbel and Williams2013; Liu et al., Reference Liu, Andersen, Williams and Jackson2013; Jones et al., Reference Jones, Williams and Jackson2017). Recent studies at the Page-Ladson archeological site in the Florida Panhandle, however, indicate a decline in Sporormiella abundance at 12,700 cal yr BP (Halligan et al., Reference Halligan, Waters, Perrotti, Owens, Feinberg, Bourne and Fenerty2016; Perrotti, Reference Perrotti2018). The Page-Ladson study used a different approach to Sporormiella counting that is better suited to low concentrations: they indexed spore counts to exotic marker grains added to their samples, rather than to fossil pollen grains. In our study, spores were tallied during routine counting of pollen grains to a minimum terrestrial-pollen sum of 300 to 400 grains, an approach that has worked well in much of the world (Davis, Reference Davis1987; Burney et al., Reference Burney, Robinson and Burney2003; Robinson et al., Reference Robinson, Pigott Burney and Burney2005; Gill et al., Reference Gill, Williams, Jackson, Lininger and Robinson2009, Reference Gill, Williams, Jackson, Donnelly and Schellinger2012; Raczka et al., Reference Raczka, Bush, Folcik and McMichael2016). If spore influx is very low relative to pollen influx, however, low spore:pollen ratios will mask representation of coprophilous spores in routine pollen counts. For example, total pollen accumulation rates at White Pond were slightly higher than at Silver Lake (Gill et al., Reference Gill, Williams, Jackson, Lininger and Robinson2009), where there is a stronger spore signal, between 25,000 and 16,000 yr BP (Supplementary Fig. 2) (~11,000 grains/cm2/yr versus 8000 grains/cm2/yr). Search methods aimed at obtaining high spore counts (e.g., indexing to marker grains) may be more appropriate in low spore concentration settings.
How did interactions between climate, fire, and vegetation shape the development of Holocene southeastern forests?
Rapid shifts in forest composition, changing hydrologic conditions, and increased fire activity marked the onset of the Holocene at White Pond. After 10,400 cal yr BP, mesic hardwood taxa, including Fagus, Fraxinus, Ostrya/Carpinus, and Carya, decrease rapidly in the fossil pollen record, while percentages of more drought-tolerant Pinus increase and Quercus maintain high values (Fig. 5 and 8). At the same time, the aquatic assemblage records a shift in the dominant taxon, from Isoetes to Brasenia, marking a shift to shallower, more eutrophic conditions (Fig. 5). Total macroscopic CHAR also increases tenfold, indicating increased fire activity (Fig. 6 and 8), with notable peaks in charcoal at 8300 and 7500 cal yr BP during the early Holocene and, while the brGDGT data suggest MATs decreased after 10,800 cal yr BP, they were still higher than the present day (Fig. 4). Given that the core chronology and lithology from White Pond provide no evidence of a sedimentation hiatus during this time, the rapidity of these changes appears to be genuine and could be a threshold response to gradually warmer summers associated with increasing summer insolation during the early Holocene (Bartlein et al., Reference Bartlein, Anderson, Anderson, Edwards, Mock, Thompson, Webb, Webb III and Whitlock1998; Alder and Hostetler, Reference Alder and Hostetler2014). However, while warmer summers likely account for the increase in biomass burning, we cannot rule out anthropogenic influences. The Archaic Indian culture was well established by 10,000 to 8000 cal yr BP in the Coastal Plain, and Archaic Indians regularly used fire for hunting and clearing fields (Pyne, Reference Pyne1982; Fowler and Konopik, Reference Fowler and Konopik2007).
brGDGT-based temperature reconstructions at White Pond suggest that MATs abruptly decreased between 9000 and 8000 cal yr BP, reaching temperatures up to 3°C colder than the present day, before rebounding to pre-9000 cal yr BP levels (Fig. 4). No changes in the terrestrial or aquatic communities are recorded during this time and either the temperature excursion was not sufficiently severe and/or did not last long enough to elicit a biotic response. Furthermore, without similar paleotemperature data from other sites in the Southeast, it is unclear if the inferred cooling at White Pond was site-specific or part of a widespread regional signal, possibly associated with the 8200 cal yr BP event in the North Atlantic (Alley et al., Reference Alley, Mayewski, Sowers, Stuiver, Taylor and Clark1997; Thomas et al., Reference Thomas, Wolff, Mulvaney, Steffensen, Johnsen, Arrowsmith, White, Vaughn and Popp2007).
After 7500 cal yr BP, Pinus pollen percentages gradually increase in the fossil pollen record at White Pond at the expense of Quercus, and by 6400 cal yr BP, Pinus becomes the dominant taxa on the landscape. The well-dated fossil pollen record from Lake Tulane in peninsular Florida also shows an Quercus-to-Pinus transition at ca. 6000 cal yr BP (Fig. 7; Grimm et al., Reference Grimm, Watts, Jacobson, Hansen, Almquist and Dieffenbacher-Krall2006) and, although not as well-dated, so do sites in southeastern North Carolina (Jones and Singletary lakes; Spencer et al., Reference Spencer, Jones, Gamble, Benedetti, Taylor and Lane2017), and could imply a possible widespread climatic forcing event in the southeastern United States during the mid-Holocene. The brGDGT data from White Pond indicate decreasing MATs after 6500 cal yr BP (Fig. 4 and 8), and it is plausible that cooling summers and warming winters associated with an amelioration in the seasonal cycle of insolation during the mid-Holocene (Bartlein et al., Reference Bartlein, Anderson, Anderson, Edwards, Mock, Thompson, Webb, Webb III and Whitlock1998; Alder and Hostetler, Reference Alder and Hostetler2014) drove the regional Quercus-to-Pinus transition. Conditions were also likely drier in eastern North America during the mid-Holocene, as indicated by lake-level reconstructions from New England and δ18O records from caves in West Virginia and Florida (Fig. 1), with the strongest declines between 4500 and 4000 cal yr BP (Shuman and Donnelly, Reference Shuman and Donnelly2006; Hardt et al., Reference Hardt, Rowe, Springer, Cheng and Edwards2010; Pollock et al., Reference Pollock, Beynen, van, DeLong, Polyak and Asmerom2016). Dry mid-Holocene conditions are also recorded at White Pond between 6400 and 4200 cal yr BP, inasmuch as elevated graminoid (Poaceae and Cyperaceae) percentages and diminished Brasenia levels in the fossil pollen record indicate decreasing water levels that favored sedges and aquatic grasses at the expense of floating-leaved or submerged aquatics like Brasenia. Mid-Holocene drought conditions could also account for the number of large charcoal peaks recorded at White Pond centered at 5800, 5100, 4800, and 4200 cal yr BP (Fig. 6 and 8).
After 4200 cal yr BP, Pinus percentages reach their highest levels of the Holocene and, except for Quercus, other hardwood taxa are poorly represented in the pollen record (Fig. 5). Water levels at White Pond also likely rebounded to their pre-6400 cal yr BP levels at this time, as indicated by rising Brasenia and decreasing graminoid percentages. After 1200 cal yr BP, elevated percentages of grass charcoal in combination with decreased total CHAR (Fig. 6 and 8) indicate a shift from an infrequent high-severity fire regime to one dominated by frequent low-severity surface fires, similar to fire regimes characteristic of southeastern longleaf pine forests today (Platt et al., Reference Platt, Evans and Rathbun1988; Frost, Reference Frost2006; Stambaugh et al., Reference Stambaugh, Varner and Jackson2017). The mechanisms underlying this late Holocene shift in fire activity are unclear, and the fossil pollen record does not indicate any preceding changes in climate or fuel availability/biomass. While it is difficult to separate the influence of climate and vegetation from anthropogenic factors on fire activity, the establishment of the Mississippian culture in the Southeast ca. 1300 cal yr BP immediately precedes the shift in fire activity. The Mississippian culture, the most highly developed culture on the Coastal Plain before European conquest (Hudson, Reference Hudson1976), used fire extensively to modify tracts of land, to build political centers and villages, and to grow maize (Fowler and Konopik, Reference Fowler and Konopik2007). Hence, an increase in surface burning at White Pond after 1200 cal yr BP could be the result of intensified land management using fire by Native Americans.
CONCLUSIONS
This multi-proxy paleoenvironmental reconstruction from White Pond revisits a classic record to contribute new information on the underlying drivers and causal mechanisms of late Quaternary vegetation dynamics in the southeastern United States. Growing evidence from well-dated sites in the interior Southeast, including White, Jackson, and Anderson ponds, indicate relatively stable Pinus- and Picea-dominated vegetation during the full-glacial period, although declining Quercus at 26,000 cal yr BP may mark the initiation of cooler conditions associated with the onset of H2 in the North Atlantic. Nonetheless, peninsular Florida (Lake Tulane) appears to have been particularly sensitive, compared with the adjacent continent, to changes in North Atlantic thermohaline circulation and Gulf of Mexico sea-surface temperatures during H2.
Vegetation turned over substantially during the last deglaciation at White Pond as mesic hardwood forest replaced the open Pinus- and Picea-dominated landscape in response to gradual warming. In the Southeast, sites significantly varied in their ecological responses to the Bølling-Allerød and Younger Dryas; however, vegetational changes at most sites seem to be consistent with warm conditions during the Younger Dryas, in contrast to cool conditions recorded nearer to the Laurentide Ice Sheet. While there was substantial turnover in the deglacial vegetation at White Pond and a rise in mesic hardwoods, the development of no-analog pollen assemblages was weakly expressed, likely due to the low abundance of Picea pollen compared with sites further north and west. Sporormiella was not recorded in the White Pond sediments, and charcoal abundance was extremely low during the late glacial period, similar to other records from the Southeast. Given that megafauna likely were present throughout the Southeast, the absence of Sporormiella spores could be attributed to differing intensities of megafaunal activity near depositional basins (open versus wooded landscapes), taphonomic processes, counting methods, or a combination of these factors. Fire apparently played a minimal role in shaping deglacial vegetation dynamics in the Southeast, in contrast to sites in the central Great Lakes region.
The Holocene at White Pond featured increasing Pinus dominance and a tenfold increase in CHAR due to elevated biomass burning associated with warmer summer conditions. Pinus expansion in the South Carolina Coastal Plain appears to have occurred in two phases, the first commencing at 10,400 cal yr BP and the second at 7500 cal yr BP; the latter was may have been due in part to increasing winter temperatures and/or drier conditions during the mid-Holocene. Low-intensity surface fires increased after 1200 cal yr BP near White Pond, as implied by increased percentages of grass charcoal and low CHAR, and suggests anthropogenic influence associated with the establishment of the Mississippian culture in the Atlantic Coastal Plain.
The southeastern United States is a critical region in North American biogeography, and well-dated multiple-proxy records remain scarce. Continued reexamination of existing paleoecological sites in the Southeast and the development of new chronologies and high-resolution multiple-proxy records are setting the foundation for a new generation of research into the spatiotemporal patterns of past vegetation, climate variability, and fire activity in the region. These new records strengthen our understanding of the underlying drivers and causal mechanisms of late Quaternary climate and vegetation dynamics in the southeastern United States.
SUPPLEMENTARY MATERIAL
To view supplementary material for this article, please visit https://doi.org/10.1017/qua.2018.95
ACKNOWLEDGMENTS
The research was supported by National Science Foundation Grants DEB-1353896 and DEB-1349662. Al Goodyear kindly secured access to White Pond. We thank Ben Watson, Joe Wilkinson, and Chris Moore for their assistance in the field; Al Goodyear, Chris Moore, and Pete Stone for discussions in the field; and Connor Nolan and Yao Liu for their thoughtful discussions on the manuscript. Yue Wang provided helpful advice on the identification of coprophilous fungal spores, and Ben Watson kindly cross-checked several samples to confirm the absence of Sporomiella spores. The manuscript improved greatly from the helpful reviews of Mark Bush, Yao Liu, and an anonymous reviewer. All pollen and radiocarbon data have been deposited with the Neotoma Paleoecology Database (http://www.neotomadb.org). Geochemical data discussed herein have been archived in databases accessible at https://ngdc.noaa.gov. Any use of trade, firm, or product name is for descriptive purposes and does not imply endorsement by the U.S. Government.
TRK, JMR, JWW, and STJ designed the research; TRK, JMR, RZ, and STJ collected and analyzed the data; and TRK, JMR, JWW, and STJ wrote the paper.