

Introduction
In Ethiopia, seven types of wheat are grown mainly in the highland areas where the edaphic and climatic factors are suitable for wheat production (Abebe et al., Reference Abebe, Ghiorghis, Regassa, Tanner, van Ginkel and Mwangi1990). However, the bread wheat Triticum aestivum and the durum wheat Triticum turgidum subsp. durum (Poaceae) are the dominant ones. Since 2003, areas under wheat as well as productivity have been increasing, even though the increments did not keep up with the rapid population growth rate. Consequently, between 2003 and 2013, the country annually imported an average of 1.98 (range 0.18–9.9) million tons of wheat from different countries, which is worth US$ 0.44–3.8 billion (Ethiopian Custom Authority, unpublished report). This situation forced the country to begin irrigated wheat production and to intensify the production of rainfed wheat. Although, currently, the area under irrigated wheat is less than 10,000 ha, it is highly infested by the Russian wheat aphid, Diuraphis noxia.
According to Hughes (Reference Hughes, Peters, Webster and Chlouber1990), although the Russian wheat aphid (RWA) dispersed from its centre of origin around the Black and Caspian Seas as early as 1935, it attained pest status in wheat and barley four decades after its spread to the different regions of the world. Currently, it is a serious pest of wheat in warmer and drier wheat-growing countries. This aphid species is also known to develop biotypes that shorten the durability of resistant wheat varieties (Burd et al., Reference Burd, Porter, Puterka, Haley and Peairs2006).
In Ethiopia, the exact date of self-introduced RWA is not known; however, it was first reported as a pest of barley in 1972 (Adugna and Tesema, Reference Adugna and Tesema1987). In rainfed production system, it infests late sown wheat and can sometimes cause complete crop failure (Tesfaye and Demissie, Reference Tesfaye, Demissie, Rajaram, Saari and Hettel1992). Other than such circumstantial yield reduction estimates, there are no empirical data on the incidence of the RWA and associated yield losses in rainfed or irrigated wheat in Ethiopia. Gauging the amount of yield losses by a particular pest has many uses at regional, national, farm and individual field levels. For instance, at regional/national levels, it helps to prioritize the research agenda (variety and gene development, and timings of insecticide application), and to decide on regulatory (eradication and quarantine) and emergency measures for large-scale control. At farm and individual field levels, loss estimates are used to predict losses early in the season, choose varieties or crop types to grow, and decide on the need for insecticide application. As a result, the level of infestation by the RWA D. noxia in Ethiopia was determined and the associated yield losses in irrigated wheat quantified.
Materials and methods
The occurrence of RWA in irrigated wheat was investigated on two durum (Denbi and Werer) and two bread (Kubsa and Millennium) wheat varieties at Debre Zeit Agricultural Research Center (altitude 1900 m above sea level, 8°44′N and 38°58′E), Debre Zeit, Ethiopia. Each variety was sown at the rate of 140 kg/ha on Vertisols on plots of 3 × 3 m on 25, 23 and 23 January in 2012, 2013 and 2014, respectively. The experiment was laid in a split plot with varieties as the subplot and insecticide (sprayed and unsprayed) as the main plot, and was replicated three times. Diammonium phosphate (DAP) fertilizer was applied at the time of sowing at a rate of 100 kg/ha. Irrigation was given at weekly intervals as spray until the crop was established, and thereafter the plots were flood-irrigated.
Occurrence of RWA
Before spraying, population intensity (number per tiller) was estimated by counting the number of RWA on randomly selected 20 tillers per plot in a cross-diagonal line. These tillers were also used for determining the percentage of infested tillers in a plot.
Effect of RWA on yield
The effect of RWA on grain yield was determined by comparing the insecticide-sprayed and unsprayed plots. Tillers were examined daily beginning from seedling emergence to detect the initial appearance of the aphid and 2 weeks after the initial appearance of the aphid dimethoate was sprayed three, two and one time in 2012, 2013 and 2014, respectively, with a hand-operated knapsack sprayer at a rate of 1 litre/ha using a spray volume of 200 litres/ha. The insecticide was applied at fortnightly intervals when being sprayed more than one time per season. The percentage of avoidable loss in yield (w, %) was calculated using the formula proposed by Walker (Reference Walker and Teng1987) as:
 $$\begin{eqnarray} \end{eqnarray}$$
where m i is the yield of variety i obtained in the sprayed plots and y i is the yield of variety i obtained in the unsprayed plot. Moreover, data on the number of grains per spike in ten randomly selected spikes, 1000-seed weight, and average height of five plants were recorded, and for each parameter, the percentage loss was calculated using the same formula.
Temperature and rainfall data
Precipitation and temperature data covering the active growth stage of the crop were obtained from the Debre Zeit Centre meteorology station.
Statistical analysis
Data on the number of RWA, the percentage of tillers infested, grain yield and other agronomic data were analysed using PROC GLM of SAS version 9.0 (SAS Institute Inc, Cary, NC, USA).
Results
Occurrence of RWA
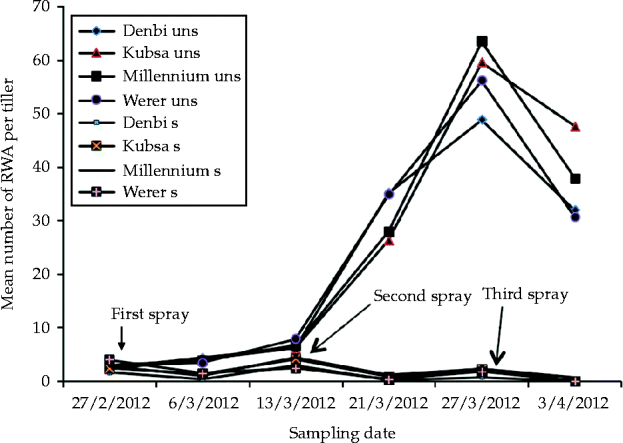
The RWA infested wheat in the first two seasons (Figs 1 and 2) as well as in the third season (data not shown). It appeared first when the crop reached the four- to five-leaf stage (Zadoks stage 22), which corresponds to 13–18 days after crop emergence. In all seasons, there were no statistical differences (P>0.05) among varieties and was no variety × insecticide interaction in relation to aphid numbers per tiller. However, insecticide spraying significantly (P< 0.01) reduced the number of RWA. In the 2012 season, from the initial appearance of the aphid in mid-February up to the second week of March, the average number of aphids on unsprayed wheat was ≤ 10, whereas that on sprayed wheat was < 1 per tiller (Fig. 1). Also, on unsprayed wheat, the RWA population rapidly increased from the second week of March and peaked in the last week of March. At the time of peak infestation, the average number of RWA per tiller was 46.9 on Denbi, 59.6 on Kubsa, 63.6 on Millennium and 56.2 on Werer. The corresponding population intensity of RWA on sprayed wheat was 0.8, 2.3, 2.4 and 1.8. In the first week of April, the RWA population fell sharply and there were more aphids on the varieties Kubsa and Millennium than on Denbi and Werer.
Mean population intensity (number per tiller) of Russian wheat aphid (RWA) on unsprayed (uns) and sprayed (s) irrigated wheat in 2012 at Debre Zeit, Ethiopia.

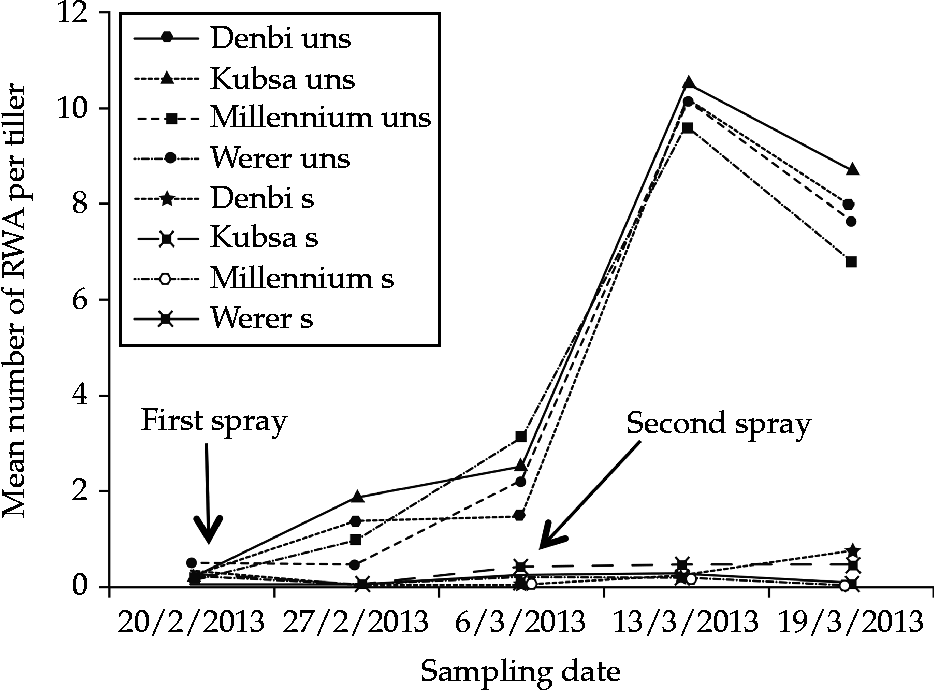
In the 2013 season, the population intensity of RWA was generally very low on all varieties (Fig. 2). On unsprayed wheat, the population of RWA increased continuously until the second week of March and then declined. At the peak population intensity, the average number of RWA per tiller was 10.1, 10.5, 9.6 and 10.2 on the varieties Denbi, Kubsa, Millennium and Werer, respectively. However, on sprayed wheat, the average population was < 1 per tiller. The pattern of the population build-up and the subsequent collapse in the 2014 season were similar to that observed in 2013 (data not shown).
Mean population intensity (number per tiller) of Russian wheat aphid (RWA) on unsprayed (uns) and sprayed (s) irrigated wheat in 2013 at Debre Zeit, Ethiopia.
Natural enemies
In all the seasons, very few generalist predators (such as lacewings, coccinellids and syrphid larvae) preyed on RWA and were found at a very low density. Mummified aphids due to the attack by parasitoids were not encountered at all.
Percentage of infested tillers
The percentage of infested tillers in 2012 is presented in Table 1. The pre-spray assessment revealed non-significant differences in the percentage of infested tillers in insecticide-sprayed and unsprayed wheat. However, after insecticide application, the percentage of infested tillers in sprayed wheat was significantly (P< 0.05) less than that in unsprayed wheat. Thus, between the last week of February and third week of March, the percentage of infested tillers in unsprayed wheat doubled from 48 to 98%, and in the last week of March, 95 to 100% of the sampled tillers in unsprayed wheat had one or more aphids. In contrast, the maximum percentage of infested tillers in sprayed wheat was recorded in the second week of March and about half of the sampled tillers in each variety had one or more RWA. After the second week of March, the percentage of infested tillers in insecticide-sprayed wheat decreased and reached ≤ 10% in the first week of April.
Percentage of Russian wheat aphid-infested wheat tillers during the 2012 season
* Means with different letters were significantly different at P< 0.05; **coefficient of variation.
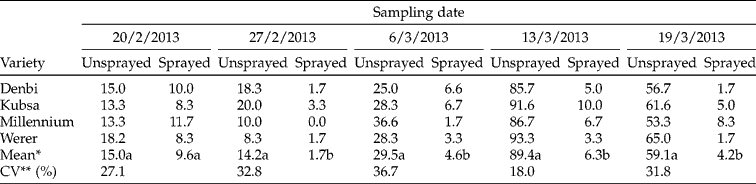
The effect of insecticide spraying on the percentage of infested tillers in the 2013 season was similar to that observed in 2012 (Table 2). Insecticide spraying significantly (P< 0.05) reduced the percentage of infested tillers. Thus, between the third week of February and second week of March, the percentage of infested tillers in unsprayed wheat increased nearly 6-fold from 15 to 89.4%, while in sprayed wheat, the percentage of infested tillers was < 12%. The pattern of infested tillers in 2014 was similar to that observed in 2013 (data not shown).
Percentage of Russian wheat aphid-infested wheat tillers in 2013
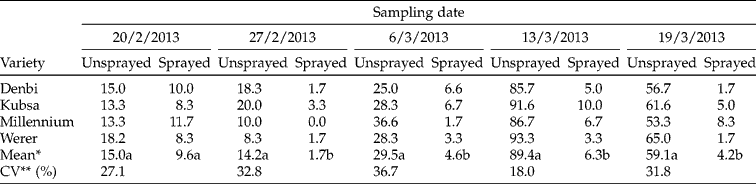
* Means with different letters were significantly different at P< 0.05; **coefficient of variation.
Effect of RWA on yield
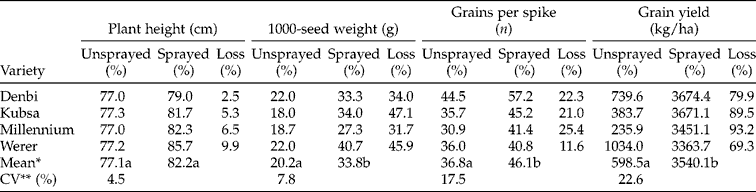
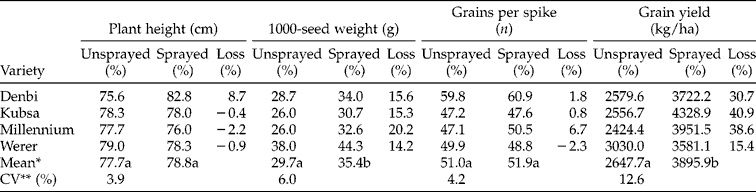
During the 2012 season, RWA infestation on wheat significantly (P< 0.05) reduced 1000-seed weight, grains per spike and grain yield (Table 3). However, plant height was not significantly affected by RWA infestation, even though there were numerical differences between insecticide-sprayed and unsprayed wheat. Moreover, except in the 1000-seed weight set, differences among the varieties and insecticide × variety interaction in relation to plant height, grains per spike and grain yield were not statistically significant.
Effect of natural Russian wheat aphid infestation on the yield of irrigated wheat in 2012
* Means with different letters were significantly different at P< 0.05; **coefficient of variation.
Under the unsprayed condition, all varieties had shorter plant height, lighter seed weight, less number of grains per spike and produced low grain yield. Consequently, the avoidable loss in plant height, seed weight, grain number, and grain yield ranged from 3 to 10%, 32 to 47%, 12 to 25%, and 69 to 93%, respectively.
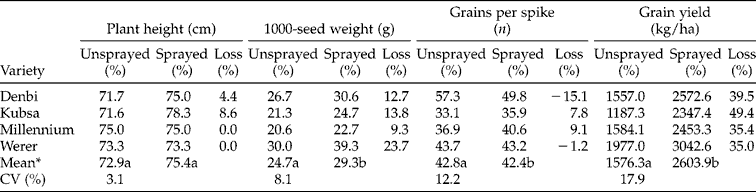
Unlike the 2012 season, in 2013 and 2014, RWA infestation significantly (P< 0.05) reduced only 1000-seed weight and grain yield, whereas differences among the varieties, variety × insecticide interaction, and insecticide-sprayed and unsprayed wheat in relation to plant height and number of grains per spike were not statistically significant (Tables 4 and 5). In 2013, the avoidable loss in seed weight and grain yield varied between 14 and 20%, and 15 and 41%, respectively. Similarly, in 2014, the avoidable loss in seed weight ranged between 9 and 24% and in grain yield between 35 and 49%.
Effect of natural Russian wheat aphid infestation on the yield of irrigated wheat in 2013
* Means with different letters were significantly different at P< 0.05; **coefficient of variation.
Effect of natural Russian wheat aphid infestation on the yield of irrigated wheat in 2014
* Means with different letters were significantly different at P< 0.05.
Temperature and rainfall
Temperature
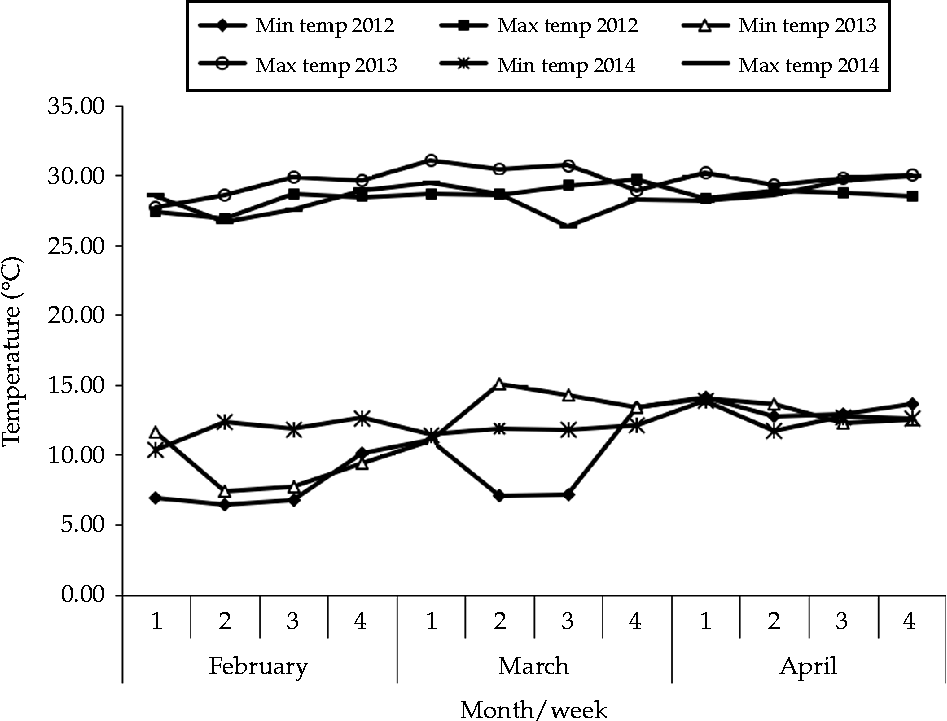
The mean weekly minimum and maximum temperatures are shown in Fig. 3. The mean weekly minimum temperature during 2012 and 2013 varied more than that in 2014. In the first 3 weeks of February 2012, the daily minimum temperature varied between 2.5 and 9.0 °C, and during this period, the population growth of RWA was very slow (Fig. 1). However, between the fourth week of February and the first week of March, the daily minimum temperature was >10 °C. Consequently, the population of RWA as well as the percentage of infested tillers (Table 1) increased continuously, even though the daily minimum temperature was < 10 °C in the second and third week of March.
Average weekly minimum and maximum temperatures during the active growth stage of irrigated wheat at Debre Zeit, Ethiopia.
The temperature in February 2013 was warmer than that in the preceding season. The mean minimum weekly temperature increased from 7.0 to 15.1 °C in the second week of March, which led to the rapid increase in the population of RWA (Fig. 2) and the percentage of infested plants (Table 2). The temperature in the 2014 season was warmer and more stable than that in the preceding two seasons. However, the population build-up pattern of RWA was similar to that observed in the 2013 season (data not shown). The mean weekly maximum temperature of the three seasons varied less than the minimum temperature, fluctuating between 26.0 and 31.5 °C.
Rainfall
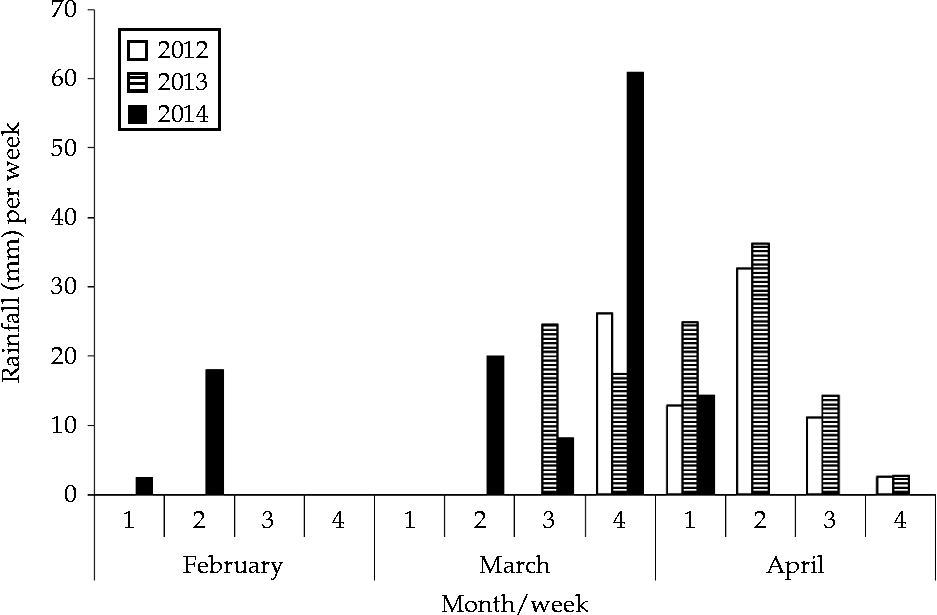
The maximum number of rainy days in a week was three. In 2012, the rain started in the fourth week of March and rained about 26.2 mm in a single day (Fig. 4). In April, it rained 12.9, 32.6, 11.6, and 2.7 mm in the first, second, third and fourth weeks, respectively. The population of RWA trended downwards following the first rainfall event and vanished in the second week of March (Fig. 1). In the 2013 season, the rain started 1 week earlier than the 2012 season and continued throughout April. Similar to the 2012 season, the RWA population dwindled following the first rainfall event (Fig. 2). In the 2014 season, the rain began in the first week of February and continued in the second week. The crop was at the four- to five-leaf stage during which RWA began to infest irrigated wheat (Figs 1 and 2). There was a dry spell between the third week of February and the first week of March. During this dry spell, the population of RWA increased considerably on unsprayed wheat and reached a peak of up to 16 aphids per tiller. The rain continued until the last part of the second week of March and thereafter RWA population vanished totally.
Rainfall distribution during the active growth stage of irrigated wheat at Debre Zeit, Ethiopia.
Discussion
The seasonal trends in the population build-up of RWA were similar in all the tested varieties and seasons. In contrast, the amount of yield loss was much greater in the varieties of bread wheat (Kubsa and Millennium) than in those of durum wheat (Denbi and Werer). Therefore, this difference in yield loss might be attributed to the tolerance of Denbi and Werer to the infestation by RWA. Ethiopian bread wheat varieties including Kubsa and Millennium have been shown to be susceptible to RWA infestation under field conditions, while durum wheat varieties such as Werer have been moderately resistant to RWA (Tebkew, Reference Tebkew2012). The losses in grain yield and 1000-seed weight were only due to feeding since RWA is not known to vector any virus in wheat (Damsteegt et al., Reference Damsteegt, Gildow, Hewings and Caroll1992). Conversely, D. noxia feeding has the potential to alter carbohydrate-partitioning patterns of wheat and alter source–sink relationships within the plant (Franzen et al., Reference Franzen, Gutsche, Heng-Moss, Higley, Sarath and Burd2007).
In all the seasons, both aphid number and percentage of infested tillers were highly significantly and negatively correlated with grain yield and 1000-seed weight. However, the association of plant height or number of grains per spike with aphid number and percentage of infested tillers was significant and negative only in the 2012 season in which RWA infestation was very severe. In other words, the effect of RWA feeding on the number of grains per spike varied from season to season, which might be attributed to the differences in the population intensity of RWA and the duration of infestation. For instance, at peak infestation, the population intensity of RWA in the 2012 season was 5- to 6-fold greater and the duration of the infestation period was 1 to 2 weeks longer than those observed in 2013 and 2014. Consequently, the flag leaf was infested and many of the spikes in unsprayed wheat were deformed or failed to exert from the tightly rolled flag leaf. According to Botha et al. (Reference Botha, Youchun and Lapitan2005) and Burd et al. (Reference Burd, Porter, Puterka, Haley and Peairs2006), flag leaf rolling in response to RWA infestation limits the extent of pollination, which, in turn, might have reduced the number of grains per spike on unsprayed wheat. In rainfed wheat, similar conflicting results in other aphid species such as Sitobion avenae (Fabricius) and Rhopalosiphum padi L. have been reported in different countries. For instance, in Canada, Ba-Angood and Stewart (Reference Ba-Angood and Stewart1980) found that aphid feeding significantly reduced the number of grains per ear, whereas Milne and Delves (Reference Milne and Delves1999) in Australia found that aphid feeding did not affect grain numbers per ear. However, in both cases, aphid feeding significantly reduced 1000-seed weight and grain yield per ha, which is in agreement with the findings of the present study.
Depending on variety and season, the percentage yield loss ranged from 15 to 93%. Although the yield loss assessment was done under the irrigated condition, the loss is comparable with yield losses reported in rainfed wheat, which is 90% in Kenya (Amulaka et al., Reference Amulaka, Maling'a, Cakir and Mulwa2013), 79.2% in the USA (Peairs, Reference Peairs, Peters, Webster and Chlouber1990) and 60% in South Africa (Du Toit, Reference Du Toit1990).
The RWA is a serious pest of wheat in dry and warmer areas. Therefore, when the daily minimum temperature was < 10 °C, as in the February 2012 season, the population growth of RWA was hampered. According to Melaku (Reference Melaku2002) and Melesse and Singh (Reference Melesse and Singh2012), under Ethiopian conditions and elsewhere in the world, aphid population growth is negatively influenced by minimum daily temperature. The maximum temperature at the study site was well below the temperature level (37 °C) that is known to be lethal to RWA (Basky, Reference Basky1993). The population of RWA disappeared after rainfall events. The exact reason for the disappearance of RWA is not known. In other aphid species that feed in an ‘open’ feeding site, drowning and dislodging are the mechanisms by which rainfall directly affects the aphids. However, this might not be the case in RWA, since its feeding site is within the tightly rolled leaf. However, there might have been an indirect effect of rain on the quality of plants.
Conclusion
RWA can be a serious pest of irrigated wheat in Ethiopia, causing substantial yield losses in different seasons. The varieties released so far, either for rainfed or irrigated wheat production, in Ethiopia were developed in the absence of RWA or under an insecticide-protected condition in the presence of the pest. Therefore, future irrigated wheat breeding programmes should be geared towards developing RWA-resistant wheat varieties. Moreover, other alternative management options of RWA, including safer insecticides, should be evaluated and made available to wheat growers.
Acknowledgements
The author acknowledges Ato Chuchu Kebede for his help during the data collection. This study was financially supported by the East African Agricultural Productivity Programme (EAAPP) and the Ethiopian Institute of Agricultural Research (EIAR).