


Introduction
The Patagonian Icefields are the world’s largest mid-latitude ice masses and account for over 60% of the Southern Hemisphere’s glacial area outside of Antarctica, making this area essential for understanding global glacier response to climate change, in particular the question of north–south hemispheric synchronicity. Due to inhospitable weather and inaccessibility of the outlet glaciers, there is a paucity of glaciological data necessary to assess the complex dynamics of topography, meteorology and glacier response (Warren and Sugden, 1993). At present, topography exists for only a few glaciers, while no topography exists for the vast interior of the icefields. Velocity has been measured on only five of the over 100 glaciers and these consist of only a few single-point measurements.
In October 1994, the Spaceborne Imaging Radar C (SIR-C) collected the first interferometric SAR (synthetic-aperture radar) observations of the northwestern flank of Hielo Patagónico Norte (HPN, northern Patagonia Icefield) in Chile. The SAR data were successfully employed in double-difference interferometry mode to produce both a topographic map of the icefield and a map of surface displacements caused by ice motion. No topographic map had previously been obtained for the icefield, and the ice-motion map, although limited to one component of ice motion, provides thousands of measurement points and direct observations of strain rates. Much of the background on the SAR-interferometry technique employed to derive these glaciological products, along with a quantitative discussion of the flow regime of Glaciar San Rafael, have been detailed in Rignot and others (1996). Here, we discuss a larger regional coverage of SAR-interferometry products, compare the radar images with photographs taken from the shuttle by astronauts and present first-order estimates of mass flux from four glaciers, and calving flux and mass balance of Glaciar San Rafael.
Study Area
Figure 1 shows the study area, 76 km by 33 km in size, covered by the SIR-C instrument on 10 October 1994 at a center location of 46°39.3′S, 73°50.5′W. North is 43° right from the top of the scene. The SAR image is in slant-range geometry, so terrain topography appears slanted towards the radar illumination, here from the top. The SIR-C instrument was flying at about 7.3 km s−1 from left to right, looking to its right. The radar altitude was 215 km, with a near-range distance of 277 km, corresponding to a mean incidence angle of the radar illumination of 42.7° at the center scene. Pixel spacing is 3.33 m in range and 5.21 m in azimuth in the one-look data, averaged down to 31 m on the ground in both directions after “multi-looking” of the SAR cross-products (here equivalent to the spatial averaging of 6 × 6 image pixels). In this color composite image, red is the radar brightness at C-band (5.6 cm wavelength), VV polarisation (Vertical transmit and receive polarization), blue is the radar brightness at L-band (24 cm wavelength) VV polarization and green is the sum of C-band and L-band radar brightnesses.
Color composite image of a scene imaged by the SIR-C instrument on 10 October 1994 over the northwestern flank of HPN. C-band is red, L-band is blue and the sum of C- and L- bands is green. The image size is 76 km by 33 km. Pixel spacing is 31 m.

The Liquine–Ofqui fault system runs diagonally across the entire scene, forming a straight, massive and abrupt mountain wall on the eastern side of Laguna San Rafael. Glaciar San Rafael calves into Laguna San Rafael, a tidal lagoon connected to the Pacific Ocean to the north via Golfo Elefantes. Glaciar San Rafael is the lowest-latitude tide-water glacier in the world, the only calving glacier of the HPN and one of the world’s fastest glaciers in a non-surge mode. Spectacular calving activity reigns at the grounded ice front, with terminal velocities exceeding 20–22 m d−1 (Naruse, 1985). Its accumulation area (385 km2) is the largest of the HPN (Aniya, 1988). Japanese expeditions conducted in the 1980s provided information on its summer ablation (Kondo and Yamada, 1988), accumulation (Yamada, 1987) and climatology (Fujiyoshi and entiers, 19871).
Glaciar San Quintin is located 20 km south of Glaciar San Rafael and it is the second largest glacier of the HPN, almost equal in size to Glaciar San Rafael but of very different sociological characteristics, although in the same orographic situation. It forms a piedmont lobe, 5–10 km wide, confined in a valley 30 km long, separated from the Pacific Ocean by a 5 km wide outwash plain. Its ablation area is 402 km2, the largest of the HPN (26%), but its accumulation area is only 363 km2 (Aniya, 1988). Moraine deposits left by earlier expansions appear in the radar imagery as a 60 km long are brighter than the surrounding areas. In contrast to Glaciar San Rafael, which retreated drastically in the 1970–80s, Glaciar San Quintin retreated modestly from 1944 to 1974 and has undergone no changes since (Aniya, 1988). Glacier thinning, however, is deemed to be considerable. These large differences in retreat progression may be explained by the larger wasting front of Glaciar San Quintin (>60 km; Fig. 2) compared to that of Glaciar San Rafael (<3 km) (Aniya, 1988).
Hand-held photograph of the HPN taken by astronauts from the shuttle during the second mission of the SIR-C instrument. The area covered by the photograph is about 79 km by 60 km.

Glaciar Gualas and Reicher lie immediately north of Glaciar San Rafael. Both glaciers are in the same orographic situation, terminate in proglacial lakes and are undergoing rapid retreat. An entire section of the ice front of Glaciar Reicher collapsed in 1993, leaving large icebergs floating in its proglacial lake (Wada and Aniya, 1995).
A 70 mm color photograph of the study area, taken from the space shuttle by astronauts during the SIR-C mission, is shown in Figure 2. The photograph was acquired on 10 October, at 1620 local time, with clear skies, on orbit 169 of the space shuttle, whereas the radar images were acquired on orbits 141, 157 and 173 of the space shuttle at about 2310 local time. Flowlines of Glaciar San Rafael are clearly visible up to the high slopes of Monte San Valentin. The flowlines of Glaciar San Quintin are comparatively more complicated at low elevation, where the glacier breaks up into several wasting fronts. Bare ice appears more bluish than the surrounding snow-covered glacier ice. The snowline is at about 1000–1200 m elevation. High mountain tops appear white, hence snow-covered, but denuded of vegetation according to Chilean maps. Comparison with Figure 1 reveals that the SIR-C data did not include the large southern wasting from of Glaciar San Quintin.
The central part of HPN and the higher reaches of Glaciar San Rafael and San Quintin were imaged during orbit 137 of the first mission of the SIR-C instrument, on 17 April 1994 (Fig. 3). In this color-composite image, red corresponds to C-band HH-polarization (H means horizontal linear), green is the sum of L-band HH and C-band HH, and blue is L-band HH-polarization. The area covered is 37 km by 51 km in size. The radar illumination is from the left, with SIR-C Dying from top to bottom, looking to its left, with an incidence angle of the illumination at track center of 41°. North is 55° right from the top of the scene. A strong transition in radar back-scatter is visible at high elevation (≈ 1300 m) on both glaciers. Below that boundary, radar returns are bright and presumably dominated by surface scattering from a rough layer of ice. The presence of bare ice at that elevation is justified by the high ablation rates recorded on these glaciers in the summer, with the possible occurrence of surface ablation up to 2000 m elevation (Kondo and Yamada, 1988). The rough character of the surface below the radar back-scatter transition is likely caused by glacier crevassing initiated by faster valley flow from the nearly level central part of the icefield. Glacier crevassing is confirmed by close examination of the handheld photographs (Fig. 2). Above that transition, the overlying snow is probably wet and sufficiently thick and absorptive that radar signals cannot interact with the underlying ice. Radar returns are lower in magnitude, because surface scattering from a layer of wet snow produces low radar returns. Radar returns do not increase in magnitude at higher elevation as would be expected in the presence of percolation facies (Rignot and others, 1993; Rignot, 1995). The HPN probably does not include percolation facies, because the relatively warm air temperatures and the high rate of liquid precipitation both maintain a high water content of the snow and firn (Yamada, 1987).
Color composite image of the central part of HPN imaged by the SIR-C instrument on 14 April 1994 during its first mission. C-band is red, I.-band is blue and the sum of C- and L-bands is green. The image size is 33 km by 51 km.

Methods
The radiation of the SIR-C radar waves is in phase, as for a laser instrument, and the phase of the returned waves is detected by the same antenna during slightly displaced repeat passes of the shuttle along the same path. The phase of each pixel element is proportional to the travel time for the signals to and from the illuminated surface element, itself a function of the radar imaging geometry, the baseline separation between successive passes and surface elevation. Phases are sensitive to centimetric changes in range distance, independent of the size of individual pixel elements (several tens of meters). When the surface is motionless and the radar-imaging geometry and baseline are known, phase changes are used to infer surface topography. The precision of the derived topography depends on the baseline separation, the radar wavelength and phase noise (Zebker and Goldstein, 1986). When the feature is mobile, for instance a part of a glacier, phase differences are also modulated by the velocity of the imaged feature along the radar-looking direction: As the velocity modulation is independent of the baseline, the measurement technique is several orders of magnitude more sensitive to surface motion (mille-meter scale) than it is to fixed topography (meter scale). No recognizable surface features are needed to detect ice motion and surface strain rates are observed directly. Examples of radar interferometry for Antarctica and Greenland have been given in Goldstein and others (1993), Joughin (1995) and Rignot and others (1995).
False-color composite image of the surface topography of the northwestern flank of HPN inferred using SIR-C L-band interferometry data acquired in October 1994.

To separate fixed topography and glacier motion, two interferometric pairs are necessary. It is then assumed that surface topography does not change in between the two passes (at the scale of several meters) and glacier motion is continuous. The principal difficulties of the technique are then to determine the baseline and to unwrap the phase values. The shuttle ephemeris is typically not known better than 10–20 m, which is insufficient for interferometry applications. The baseline must therefore be estimated from the data, which require the points of known position, elevation and accuracy. We used here the elevation data from the 1:50 000 topographic maps published by the Instituto Geographico Militar in Chile, which provide cartographic coverage for the snow-free areas. The interior of the icefield is blank due to the whiteness and absence of image details in the aerial photographs. The baseline parameters and their along-track gradients (which are non-zero, because successive paths are not parallel) were estimated in the least-square sense, with a r.m.s. error of less than a few-tens of centimeters.
The phases recorded by a SAR instrument are known modulo 2π and must therefore be unwrapped to be converted into absolute phases (Goldstein and others, 1988). In areas of low phase coherence, which means phase noise is high, phase unwrapping is difficult or even impossible. Phase coherence is typically low in areas shadowed from the radar illumination (slopes facing away from the radar illumination) or where radar ranging is ambiguous (slopes racing the radar illumination). Phase coherence is also low when the surface properties change significantly in between successive passes, for instance, as a result of surface melt. In our imagery, phase coherence was very high on snow-free terrain, high on the icefield and snowy mountain tops, moderate in regions of high strain rates (side margins of Glaciar San Rafael, icefalls) and low in regions of intense surface melt (ice fronts). As a result, data gaps exist in the topographic and ice-velocity maps. For example, near the terminus of Glaciar San Rafael, phase coherence was too low for interferometry applications, presumably a result of complex ice motion (rotation of ice blocks), enhanced surface melt and intense glacier crevassing. To observe ice velocity at the calving front, a repeat-pass cycle of less than 24 h would have been necessary.
Results
Surface topography
A color-composite image of the SAR-derived surface topography of the northwestern flank of HPN obtained using the L-band data (24 cm wavelength) is shown in Figure 4. Hue and saturation are proportional to the inverse of the height, and intensity is proportional to the radar brightness at L-band.
Error sources that corrupt the height estimates include uncertainties in range distance (atmospheric delays, system clock-jitter, etc.), baseline parameters and platform altitude and attitude. In general, phase noise, σ ϕ , is the dominant source of error. The corresponding uncertainty in surface height, σ h, is

where λ is the radar wavelength (24 cm), R is the range distance (277 km), θ is the angle of the radar illumination with the horizontal plane (47°), B⊥ is the component of the baseline separation perpendicular to the radar-looking direction (40 m). The phase noise σ ϕ , is

N is the number of looks of the interferometric phases (36) and γ is the temporal coherence of the phase measured from the data (Rodriguez and Martin, 1992). With N =36 and γ = 0.8, we obtain σ ϕ = 0.09, yielding σ h = 9 m. Locally, larger errors may exist for lower phase coherence.
For comparison, over relatively flat parts of the icefield, we found an r.m.s. error in surface height of about 10 m on a pixel per pixel basis, consistent with the theoretical error estimate. Much smaller errors in height would have been obtained with larger values of Β⊥, here too small, because the shuttle orbits were repeated somewhat too accurately. With large baselines (l00–1000 m), although phase noise would no longer be the dominant source of error, the technique is capable of meter-scale precision in topographic height.
Ice motion
Similarly, the uncertainties in interferometric velocities are influenced by a number of factors that include uncertainties in range distance, uncertainties in baseline gradient and phase noise. Phase noise here dominates, resulting in a velocity noise, σ υ , where
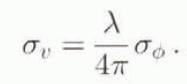
Using the same numerical values as above, we find σ υ . of the order of 3 mm d−1. Actual velocity profiles reveal a r.m.s. error of about 4 mm d−1 (or 1 m a−1), consistent with the above theoretical estimate.
Figure 5 is a map of interferometric velocities over the glacier-ice part of the scene. Non-glacier areas were masked out to simplify the presentation, since they essentially correspond to noisy areas of no motion. The velocities are absolutely referenced since phase unwrapping was performed across areas of no motion. The largest velocities are recorded over Glaciar San Rafael, where the data reveal the presence of an ice stream or a part of the glacier moving at high speeds from the central part of the icefield and surrounded by slower-moving ice, not by rock. The flowlines seen in Figure 2 reveal that stream flow initiates well inside the interior of the icefield.
False-color composite image of interferometric velocities in the radar-looking direction of the northwestern flank of HPN inferred using SIR-C L-band interferomelry data acquired in October 1994. Ice motion away from the radar direction (< −6 cm d −1 ) is colored purple. Low ice motion (±6 cm d −1 ) is colored blue. Large ice motion towards the radar direction is color-coded light blue (6–20 cm d −1 ), green (20–45 cm d −1 ), yellow (45–85 cm d −1 ), orange (85–180 cm d −1 ), and red (>180 cm d −1 ). Non-glacier areas are represented as a grey scale based on the radar brightness of the terrain at L-band.

These interferometric velocities only correspond to one component of ice motion, that aligned with the radar-looking direction. To obtain a full three-dimensional description of ice motion (in the absence of other image pairs acquired at different track angles), we assumed ice flows parallel to the ice surface and the flow direction is parallel to the valley walls or given by the flowlines. The first assumption is justified by the fact that horizontal velocities (≈1 m d−1) are several orders of magnitude larger than the estimated thinning rates (< several m a−1). Surface slope and incidence angle of the radar illumination are computed from the SAR-derived topographic maps.
The resulting horizontal-velocity profiles of four outlet glaciers along their center line are shown in Figure 6. Ice Velocity exceeds 2.5 m d−1 at high elevation for Glaciar San Rafael, increasing dramatically 5 km from the ice front as the glacier enters the narrow terminal valley. Longitudinal stretching of the glacier exceeds 1a−1 in the terminal valley. Ice velocity, measured by tracking of crevasses over a 3 d period in the part of the terminus where phase coherence was lost, reaches 17 m d−1 at the calving front. In contrast, Glaciar San Quintin moves at 1 m d−1 at high elevation, reaching a maximum of 2.1 m d−1 at minimum glacier width, and steadily decreasing towards its western wasting front to near zero velocity. Most of the reduction in flow speed occurs in less than 2 km, corresponding to a longitudinal compression of 0.2 a−1, consistent with values recorded on other ablation glaciers (Paterson, 1994). The decrease in ice velocity downslope is also an expected pattern of ablation glaciers. Glaciar Gualas and Reicher also commence with high velocity values below icefalls (1 m d−1), decreasing rapidly towards the ice fronts. Ice velocity increases in areas of narrower ice flow and decreases in areas of wider ice flow, consistent with the maintainance of ice discharge throughout the glacier valley. No interferometric velocities were available in the lower reaches of both glaciers due to a loss of phase coherence in those regions.
(a) Horizontal velocity (continuons line) and elevation profile (dolled line) along the renier line of Glaciar San Rafael as a function of the distance to the ice front. Additional velocity measurements (squares) were obtained from feature-tracking of crevasses to complete the interferometric measurements. Same observations for (b) Glacier San Quintin, (c) Glaciar Gualas and (d) Glaciar Reicher.

Ice discharge
To estimate the ice discharge across a glacier section, ice thickness and basal velocities must be known. Ice thickness has never been measured on these four glaciers and basal velocities are unknown. Observations on Glaciar Soler on the eastern side of HPN, however, demonstrated that basal sliding is a significant contributor In glacier motion (Naruse and others, 1992). These observations are consistent with the warm climate of these regions which should maintain high rates of plastic deformation and meltwater production which should enhance basal sliding.
To estimate ice thickness from the velocity and surface-slope data, we used a model combining deformation velocity and sliding velocity. Deformation velocity is modeled as

where U d is the mean velocity along a transverse profile, n = 3 is the flow-law parameter, A is the column-averaged flow constant and τ d is the driving stress and

where ρ = 900 kg m−3 is the density of ice, g = 9.8 m s−2 is the acceleration of gravity, β is the surface slope computed from the SAR-derived topographic map and H is the unknown ice thickness. We used A = 180 kPa  , a reasonable value for temperate-ice glaciers (Paterson, 1994). Basal sliding was assumed to follow Weertman’s law (Weertman, 1964)
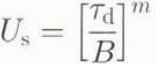
where m = 2 and B = 4 kPa m−½ a½ includes bed-roughness effects. The total velocity averaged across a transverse profile is

where f is an adjustable parameter between 0 and 1 which measures the contribution of basal sliding to total velocity (Fastook and others, 1995).
For Glaciar San Rafael, the calculated value of H varies between 475 m (f = 0, no sliding) and 195 m (f = 1, pure sliding). Pure sliding is unlikely near the Equilibrium Line Altitude (ELA) of the glacier, whereas no sliding yields very huge values of the driving stress (τ d = 300 kPa). With f = 0.05, we have H = 450 m and U s/U d = 26%. This latter value is not unreasonable given the rates of sliding of other temperate glaciers (Paterson, 1994). We therefore assumed H = 450 ± 30 m for Glaciar San Rafael. The 30 m uncertainty in ice thickness reflects uncertainties in the rate of basal sliding. However, errors in the column-averaged flow constants A and B could produce larger errors. For instance, a 20% increase in A results in an 80 m increase in ice thickness and a 20% decrease in B results in a 30 m decrease in ice thickness.
A similar approach was adopted for the other three glaciers, yielding the results summarized in Table 1. Ice fluxes were computed assuming parallel valley walls and a flat valley bottom by multiplying the inferred ice thickness H by the mean velocity across a transverse profile extracted near the estimated ELA of each glacier (Aniya, 1988). For Glaciar San Quintin, the interferometry data only covered its lower section, several kilometers below its estimated ELA and below a large southern wasting front, so ice discharge is significantly underestimated.
ELA from Aniya (1988), altitude h of the transverse velocity profile extracted for estimation of ice discharge, mean velocity U across the profile, mean surface slope β, glacier width W, calculated ice thickness H, calculated driving stress at surface τd and calculated ice flux F

Mass balance of Glaciar San Rafael
The ice discharge of Glaciar San Rafael (1.66 ± 0.2 km3 a−1) was compared to ice removal by surface ablation and by caking to determine its mass balance. To estimate total ablation, we assumed surface ablation decreased linearly from 6 cm d−1 at sea level to 0 cm d−1 at 1200 m elevation, based on the spring and summer measurements of Kondo and Yamada (1988). From the histogram of SAR-derived elevation data of the glacier, we obtained a total ablation flux of 0.67 ± 0.2 km3 a−1 The uncertainty in total ablation reflects the fact that winter surface ablation has never been measured near Glaciar San Rafael.
The calving flux of Glaciar San Rafael was estimated by Warren and others (1995) to be greater than 0.74 km3 a−1, based on visual observations of caking events, and 1.9 ± 0.2 km3 a−1, based on an assumed mean calving speed of 4000–4800 m a−1, a mean terminus thickness of 180 m and a mean channel width of 2400 m. To estimate better calving speed, we tracked crevasses within 100 m of the calving front between the first image collected by the SIR-C instrument on 8 October 1994 and the fourth image acquired on 11 October 1994 or 3 d later. On both dates, the C- and L-band image data were incoherently averaged together to produce an image file with a noise level reduced by 2. The position offsets were determined using Fourier transforms by detecting the peak in correlation of the two image data to within 1/32th of an image pixel in both range and azimuth. The resulting velocity profile at the caking front is shown in Figure 7. Calving velocity averages 8.74 ± 1 m d−1 along the 2.48 km long transverse profile, with a 1 m d−1 uncertainly due to amplitude noise, not to image misregistration. Assuming a mean terminus thickness of 180 ± 30 m, a mean caking speed of 3193 ± 370 m a−1 and no ice frontal change (Wada and Aniya, 1995), we obtain a calving flux of 1.43 ± 0.2 km3 a−1.
The resulting mass balance of Glaciar San Rafael, calculated as the ice flux from the accumulation area minus the ice flux from surface ablation and minus the ice flux from calving (neglecting melting at the glacier bed), is negative and equal to −0.44 ± 0.3 km3 a−1, corresponding to a mean thinning rate of 2.5 ± 2 m a−1 for the entire ablation area (175 km2). This thinning rate is consistent with the 40 m thinning reported between 1944 and 1983 (1 m a−1) by Aniya (1988). Although the uncertainties in each component of the mass balance are large, the first-order estimate of the mass balance of Glaciar San Rafael seems to confirm its thinning trend. Overall, the net balance over the accumulation area of Glaciar San Rafael is +3 m a−1 water equivalent (±0.5m a−1), the mean net balance in the ablation area is about −4 m a−1 water equivalent (± 0.5 m a−1) and two-thirds of the accumulation is released as calving ice and icebergs.
Ice velocity of Glaciar San Rafael versus cumulative distance along the calving front obtained from tracking of crevasses in SIR-C SAR imagery acquired 3 d apart.

Conclusions
This study demonstrates the use of L-band SAR interferometry to monitor glaciological parameters on a spatial and temporal scale unachievable by any other means. Long-term mass changes can be calculated directly from a time series of high-resolution SAR-derived topographic maps acquired over several years. Maps of ice motion provide instantaneous information on ice-flow dynamics and strain rates which can be used to estimate driving stress and ice discharge from calving glaciers, other glaciers and interior ice at an unprecedented level of spatial detail. At the calving from, very short repeat cycles are required to circumvent the limiting effects of surface melt and rotation of ice blocks. In the extreme situation of a temperate, fast-moving, tide-water glacier like Glaciar San Rafael, the repeat cycles need to be less than 24 h and perhaps as low as 6 h (regions where ice velocity >5 m d−1 do not correlate, while calving speed may exceed 20 m d−1). If these conditions are not met and millimetric precision in velocity is not a requirement, feature-tracking techniques can still provide a complementary means of measuring calving speed, as demonstrated in this study.
A more extensive interferometric characterization of both icefields will be attempted using SAR data collected by the European Space Agency’s ERS-1/ERS-2 SAR tandem mission, which operates a C-band system at a 1 d repeal-pass cycle. Phase coherence of the C-band data is likely to be too low at the margins of the Patagonia Icefields but could be high enough in the vast interior of the icefields where daily surface changes are less dramatic. In the dryer and colder Greenland and Antarctic climate, these constraints will certainly be relaxed and SAR interferometry should be a more widely applicable remote-sensing technique to measure meter-scale topography and millimetric daily strain rates of glacier ice.
Acknowledgements
This work was undertaken at the Jet Propulsion Laboratory, California Institute of Technology, under a contract with the U.S. National Aeronautics and Space Administration. We should like to thank A. Kerr and C. Doake for their reviews and S. Ommanney for editorial comments.



