Introduction
Cotton bollworm, Helicoverpa armigera (Hübner) (Lepidoptera: Noctuidae), is a serious pest of several crops including maize, sorghum, tobacco, pigeon pea, chickpea, tomato, pepper, cotton, and sunflower and is widely distributed throughout the world. Damage to crops represents millions of United States of America dollars (Tan et al. Reference Tan, Chen, Zhang and Li2001; Ji et al. Reference Ji, Hewitt, Kang and Li2003; Scott et al. Reference Scott, Lange, Scott and Graham2004). This pest is found on more than 182 plant species belonging to 47 families: 56 species are heavily damaged and 126 are severely affected (Pawar et al. Reference Pawar, Bhatnagar and Jadhav1986). It can adapt to various cropping systems in a wide geographical range and has high migratory potential, travelling up to 1000 km. It has high fecundity (Fitt Reference Fitt1989), with 3000 eggs/female, and can develop resistance to almost all insecticides used for its management (Tang et al. Reference Tang, Gong and You1988; Forrester et al. Reference Forrester, Cahill, Bird and Layland1993; Ahmad et al. Reference Ahmad, Iqbal Arif and Ahmad2001).
Microsatellite markers or simple sequence repeats (SSRs) are the most widely used tools to infer ecological and evolutionary hypotheses among natural or experimental populations. Simple sequence repeats are highly polymorphic, co-dominant, and reliable for population genetic studies and can be used with multiplexing (Tautz and Renz Reference Tautz and Renz1984; Tautz et al. Reference Tautz, Trick and Dover1986; Zhang and Hewitt Reference Zhang and Hewitt2003; Selkoe and Toonen Reference Selkoe and Toonen2006). Some microsatellites from expressed sequence tags (ESTs) and unigenes have potential to alter gene function by affecting phenotype and development. Microsatellites and other markers have been used in population genetic studies of H. armigera across the world. Microsatellites are the markers of choice to study genetic diversity and gene flow among the populations, but readily available polymorphic microsatellites are <50 (McKenchnie et al. Reference McKenchnie, Spackman and Naughton1993; Scott et al. Reference Scott, Wilkinson and Merritt2003; Subramanian and Mohankumar Reference Subramanian and Mohankumar2006; Behere et al. Reference Behere, Tay and Russell2007). Several investigations have attempted to develop microsatellite markers for H. armigera but have not been successful (Nève and Meglécz Reference Nève and Meglécz2000; Ji et al. Reference Ji, Hewitt, Kang and Li2003; Meglecz et al. Reference Meglecz, Petenian and Danchin2004; Zhang Reference Zhang2004).
Helicoverpa armigera feed on cotton from August to October in western India and September to December in southern India before switching to other food crops (Behere et al. Reference Behere, Tay, Russell, Kranthi and Batterham2013). Genetic variation among various geographic populations depends on several factors, including gene flow among the populations, host range and time since separation (Templeton et al. Reference Templeton, Shaw, Routman and Davis1990; Behere et al. Reference Behere, Tay, Russell, Kranthi and Batterham2013). Behere et al. (Reference Behere, Tay, Russell, Kranthi and Batterham2013) hypothesised increased gene flow between central and southern Indian H. armigera populations.
Collections of H. armigera from cotton fields of southern and western India have not been analysed for genetic diversity or gene flow. In this study, we screened publicly available EST resources for SSRs to develop polymorphic markers for use in diversity analysis of H. armigera populations from southern and western India. The microsatellite resources we developed can be used widely for molecular diversity or population genetic research involving this important pest of cotton and food crops.
Results
Frequency, distribution, and organisation of microsatellites in Helicoverpa gene assemblies
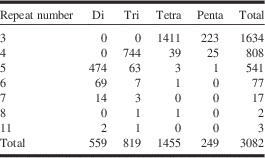
In total, 3082 repeat motifs were identified from 57 248 contigs: 559 were dinucleotide repeats (DNRs), 819 trinucleotide repeats (TNRs), 1455 tetranucleotide repeats (TTNRs), and 249 pentanucleotide repeats (PNRs) (Table 2). The most common motif type of DNRs was AT/TA (34%) followed by AC/TG (21%) and CA/GT (18%). We identified 27% TNR repeats from all repeats; the most prevalent was AAT/TTA (32%) followed by ATC/TAG (16%). We identified 559 loci among the GC-rich, frequent TNR motifs (ACA/TGT, ATC/TAG, ACC/TGG, CAA/GGT, CGA/GCT, and CTA/GAT). AT-rich TTNR motifs had the highest frequency, representing 64% of the total tetra class. In total, 139 AAAAC/TTTTG loci in the penta class represented 56% of the total PNR class. Of all 69% were simple imperfect repeats, followed by 17% simple perfect repeats and the rest compound motifs.
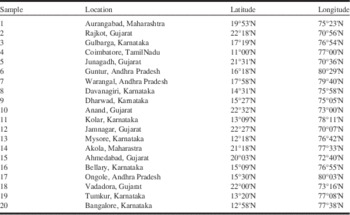
Sampling of Helicoverpa armigera populations used in the study.

Distribution of dinucleotide, trinucleotide, tetranucleotide, and pentanucleotide microsatellites by repeat number.

Dinucleotide repeats tended to be longer than TNRs (Table 1S). Many of the DNRs (474) and TNRs (69) contained five units. None of the motifs were longer than 11 units. In total, 1338 repeat units were located in open reading frames (ORFs). Among the rest, 892 and 841 were in 5' and 3' UTRs, respectively. Overall, 211 could not be localised to any geneic region. Sequences for forward and reverse primers and expected product sizes for 993 SSR motives are in Table 2S.
Amplification pattern of ORF-specific microsatellites and their use in analysis of genetic divergence among the populations
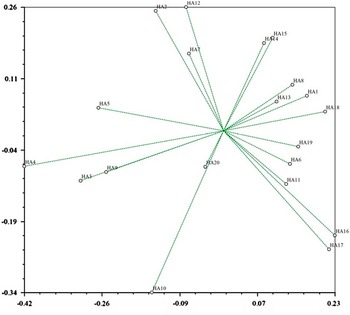
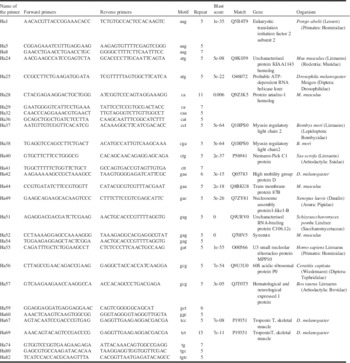
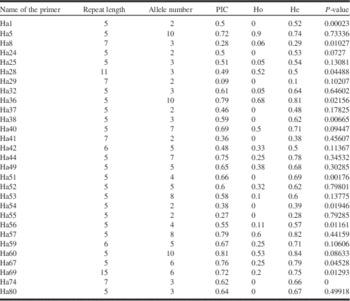
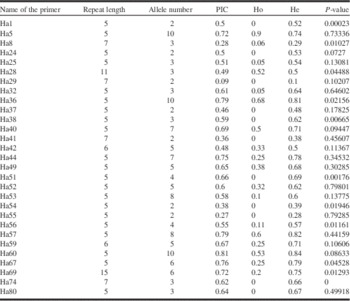
We used 30 microsatellite primer pairs to amplify 20 DNA samples of H. armigera from southern and western regions of India (Table 3). Ha1, 8, 36, 38, 51, 54, 56, 69, and 74 significantly deviated from Hardy–Weinberg equlibrium (Table 4). The mean observed heterozygosity for all microsatellite alleles was 0.59 (range 0.1–0.84). The Shannon index (SI) can be used to determine how a locus resolves genetic divergence in ecologically diverse populations. As well, to confirm gene sharing across populations, we used number of migrants (Nm) testing with private alleles (Barton and Slatkin Reference Barton and Slatkin1986). A mean Nm frequency>1.0 implies significant gene flow among the populations. The mean frequency of private alleles across groups was 0.11 and the Nm after correction for population size was 1.18688. Locus wise Nm estimates (locus wise gene flow) were calculated based on F st=0.25(1−F st)/F st. Nm indices of individual SSR loci estimated by ranged from 0 to 0.39 (Table 3S). Principal component analysis (PCA) resolved genetic relationships of various collections from southern and western regions of India, which indicates gene flow and migration among the pest populations (Fig. 2). The first two eigen vectors cumulatively accounted for 23.1% of the variation (vector I=13.5 and vector II=9.6). To corroborate the results of PCA, genetic diversity nalysis of the collections ranged from 0% to 32%.
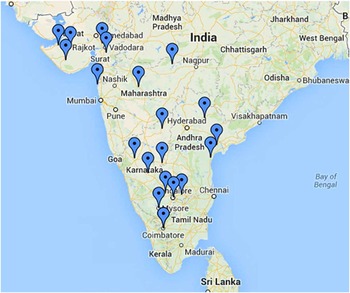
Sampling locations of Helicoverpa armigera in India.

Principal component analysis of genetic relationships of Helicoverpa armigera collections.

Gene-specific (ORF) microsatellites used in the current investigation.

Amplification pattern and heterozygosity levels of individual microsatellites.
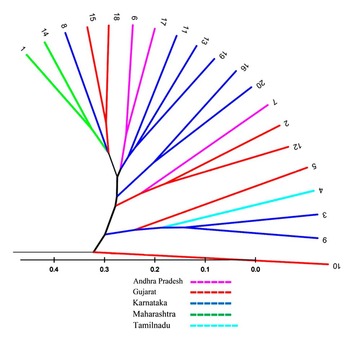
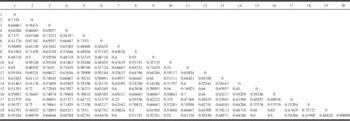
Pairwise genetic diversity estimates varied between 0.25 (between collection from Warangal, Andhra Pradesh, and Ongole, Andhra Pradesh) to 0.77 (between Junagarh, Gujrat collection and Tumkur, Karnataka) (Table 5). A phenogram created by the unweighted pair group method with arithmetic mean (UPGMA) contained groups representing mixtures of collections from various states (Fig. 3). To further partition genetic diversity, analysis of molecular variance (AMOVA) of two collections, southern and western, revealed 90.93% intragroup variance as compared with 9.07% intergroup variance, which corroborates the results of the PCA and UPGMA.
Unweighted pair group method with arithmetic mean (UPGMA) phenogram of the association of Helicoverpa armigera collections from southern and western states of India.

Pair-wise genetic distances of various collections in the study. Serial number refers to the sample number in Table 1.

Population structure analysis based on model-based assumptions was used to estimate K-2 to K-10 clusters each with three iterations. The results were analysed for mean±SD LnP(K) and ΔK values as estimated by Structure Harvester (http://taylor0.biology.ucla.edu/structureHarvester/), which implements the Evanno method for visualising structure output (Earl and vonHoldt Reference Earl and vonHoldt2012). K-4 was the most appropriate cluster size for this population, with the highest ΔK=312 (Fig. S1). Population structure analysis revealed information pertaining to lineage sharing among the collections in addition to corroborating the results of a neighbour joining analysis.
Discussion
Microsatellites are located all over genome and are the hot spots because of their ability to resolve diversity and gene flow (Katti et al. Reference Katti, Ranjekar and Gupta2001; Archak et al. Reference Archak, Meduri, Kumar and Nagaraju2007). In this study of collections of cotton bollworm, H. armigera, from southern and western India, we have made available 3082 EST specific microsatellite markers and provide information for the motif type, frequency, distribution, location (ORF or UTR), nature (perfect, imperfect, and compound) as well as abundance of the markers. Similar to our findings of the abundance of short microsatellites and imperfect repeat units in the Helicoverpa genome, Archak et al. (Reference Archak, Meduri, Kumar and Nagaraju2007) noted increased numbers of short microsatellites with imperfect units in Anopheles Meigen (Diptera: Culicidae), Bombyx Linnaeus (Lepidoptera: Bombycidae), Drosophila Fallén (Diptera: Drosophilidae), and Tribolium MacLeay (Coleoptera: Tenebrionidae). Furthermore, Archak et al. (Reference Archak, Meduri, Kumar and Nagaraju2007) observed >70% TNR microsatellites in ORFs which is in confirmity with our findings.
With the ORF-specific microsatellites, the Helicoverpa collections from various locations exhibited wide genetic diversity and also provided evidence of allele sharing and significant gene flow across the populations. Researchers across the world have investigated genetic differences among various Helicoverpa collections from diverse topological barriers and found that this pest population is panmictic and highly mobile, which facilitates strong evolutionary potential to cope with pest management practices (Zhou et al. Reference Zhou, Faktor, Applebaum and Coll2000; Grasela and McIntosh Reference Grasela and McIntosh2005; Ji et al. Reference Ji, Wu and Zhang2005; Subramanian and Mohankumar Reference Subramanian and Mohankumar2006; Behere et al. Reference Behere, Tay and Russell2007). Behere et al. (Reference Behere, Tay, Russell, Kranthi and Batterham2013), using exon-primed, intron-crossing (EPIC) markers, noted seasonal and geographical variation in Indian H. armigera populations from various crops. Frequent migration among the natural cotton bollworm populations was previously noted (Scott et al. Reference Scott, Lawrence and Lange2006; Vassal et al. Reference Vassal, Brevault, Achaleke and Menozzi2008; Behere et al. Reference Behere, Tay, Russell, Kranthi and Batterham2013). In addition, Scott et al. (Reference Scott, Wilkinson and Merritt2003) and Selkoeand Toonen (Reference Selkoe and Toonen2006) reported that the adult moth movement varies among seasons, thereby affecting genetic variation. Helicoverpa armigera populations differentially responded to pheromones (Tamhankar et al. Reference Tamhankar, Rajendran and Hariprasad Rao2003) and parasitoids (Manjunath et al. Reference Manjunath, Phalak and Subramanian1970) in India. Kranthi et al. (Reference Kranthi, Armes, Rao, Raj and Sundaramurthy1997) reported diverse metabolic mechanisms mediating pyrethroid resistance among collections of H. armigera in India. Various reports suggested that H. armigera in India could not be categorised into races, from their host feeding preferences (Reed and Pawar Reference Reed and Pawar1982).
Ji et al. (Reference Ji, Hewitt, Kang and Li2003) noted that the expected heterozygosity of various genomic microsatellites ranged from 0.62 to 0.91 among H. armigera collections and the observed allele numbers ranged from four to 12. Of the 30 microsatellite loci we tested, nine deviated significantly from Hardy–Weinberg equilibrium (Table 4), as indicated by heterozygotes deficit. This phenomenon is not uncommon with pest species such as H. armigera, which are under extreme selection pressure for every generation (Scott et al. Reference Scott, Lawrence, Lange, Scott, Wilkinson and Merritt2005). The assumption of absence of migration and selection pressure under Hardy–Weinberg equilibrium is inappropriate in pest species such as H. armigera that undergo extreme selection pressure because of the application of insecticides (Scott et al. Reference Scott, Lawrence, Lange, Scott, Wilkinson and Merritt2005). Nevertheless, we used microsatellites specific to ORFs to obtain a range of heterozygosity of 0.1 to 0.85 with allele numbers from two to 10, which is almost comparable to values for non-genic microsatellites used in previous studies (Tan et al. Reference Tan, Chen, Zhang and Li2001; Yajie and Dexing Reference Yajie and Dexing2003; Scott et al. Reference Scott, Lange, Scott and Graham2004; Perera and Blanco Reference Perera and Blanco2011). Endersby et al. (Reference Endersby, McKechnie, Ridl and Weeks2006) reported a high frequency of null alleles typically found in Lepidoptera. Populations of H. armigera are not strongly structured among regions in south-eastern Australia (Endersby et al. Reference Endersby, McKechnie, Ridl and Weeks2006; Weeks et al. Reference Weeks, Endersby, Lange, Lowe, Zalucki and Hoffmann2010).
Our study identified wide genetic differentiation within Helicoverpa populations collected from cotton in southern and western India. However, the inclusion of a larger number of collections from various crops would further resolve the extent of gene flow across the pest populations. Our study was conducted with a limited number of collections from various locations, and larger samples from various collections need to be investigated to precisely understand the trend and mechanisms of dynamic evolution in this important pest population. Nevertheless, we have identified several useable microsatellites and various population genetic tools never previously used to analyse genetic diversity among H. armigera collections. The results we obtained with the newly developed microsatellites could be compared with those from investigations of larger sample involving multiple locations, cropping seasons and different host crops from India.
Methods
Insect collections and DNA isolation
The larvae of H. armigera were collected during the peak incidence from non-Bt-cotton fields of southern and western regions of India during 2008–2009 and 2009–2010. The collections were from 20 locations in the three southern states (Andhra Pradesh, Karnataka, and Tamil Nadu) and two western states (Maharashtra and Gujarat) (Fig. 1 and Table 1). In total, 50 larvae (4th–5th instar) per location were collected. A total of 1000 larvae belonging to 20 locations were transferred immediately into glass vials for rearing with an artificial diet (Nagarkatti and Prakash Reference Nagarkatti and Prakash1974). The larvae were transferred to fresh diet on arrival in the laboratory and allowed to pupate. The pupae were surface-sterilised in 0.1% sodium hypochlorite and allowed to emerge into moths. Newly emerged adults were identified as H. armigera (Hübner) by taxonomic keys provided by Hardwick (Reference Hardwick1965). Adults belonging to a particular location were separately preserved in 95% ethanol at −20 °C and used for DNA extraction. All larvae were thoroughly washed with formaldehyde and alcohol and the gut contents were removed to avoid contamination of any other DNA. The genomic DNA isolation involved use of an animal kit (catalogue number 69504, Qiagen (Valentia, California, United States of America) by standard procedures.
Marker development
A set of 57 248 EST assemblies were used for SSR searching with a high-performance computer cluster version developed with a Perl script available as SSRIT (SSR tool) at cotton microsatellite database (CMD; www.cottonmarker.org) (Blenda et al. Reference Blenda, Scheffler and Scheffler2006). The CMD SSR tool parameters were set to detect dinucleotides to pentanucleotides with minimum repeat size of five, four, and three for dinucleotide, trinucleotide, and tetranucleotide and pentanucleotide motifs, respectively. To examine the location of SSRs in the sequences relative to the putative coding region, the SSR server is equipped with FLIP, a UNIX C program that identifies relative SSR location (Brossard Reference Brossard1997). The location of the SSRs within the contigs was further confirmed by use of prot4EST (Wasmuth and Blaxter Reference Wasmuth and Blaxter2004) and the fasty35 module of the FASTA package (Iseli et al. Reference Iseli, Jongeneel and Bucher1999). Potential primers were designed by using the Primer3 module with the SSR tool (Rozen and Skaletsky Reference Rozen and Skaletsky2000). The individual properties included sequence name, repeat(s) motif and number and SSR location relative to the ORF. A set of alternative primers was designed with optimum primer length 20 nucleotide (range 18–26 nt), optimum melting temperature 50 °C (range 45–55 °C), and optimum product size range 100–350 base pairs. Simple sequence repeat containing sequences were identified by use of BLAST with the tblastx option (E-value cut-off 1e-6) against the Swiss-Prot database.
Polymerase chain reaction conditions
Polymerase chain reactions involved the use of 200 ng genomic DNA, 0.20 μM mixed forward and reverse primers, 1X Buffer (10 mM de Tris-HCl, pH 8.2, 50 mMKCl, Triton 0.1%, BSA 1 mg/mL), 1.5 mM MgCl2, 0.2 mMdNTPs, and 1 U Taq polymerase in a 10-μL reaction volume. Amplification involved a GeneAmp PCR 9700 System thermal cycler (Applied Biosystems Inc., Waltham, Massachusetts, United States of America) programmed to 94 °C for two minutes, followed by 35 cycles of 94 °C for 30 seconds, 50–65 °C for 30 seconds, 72 °C for one minute, and a final extension step at 72 °C for 10 minutes. Amplified products were separated on 3% SFR agarose gels. For scoring, stutters were avoided and discernible bands were scored as alleles. Estimation of allele sizes for the survey panel was by comparison with a 50 base pair molecular weight ladder that was loaded twice on each SFR grade agarose gel.
Data analysis
Estimation of molecular genetic diversity of ecological populations by the Shannon diversity index, F st and heterozygosity based on Wright’s F-statistic (Wright Reference Wright1978) involved use of Popgene 1.31 (Yeh and Boyle Reference Yeh and Boyle1997). Analysis of gene flow (number of migrants; Nm) by the private allele method (Slatkin Reference Slatkin1985) involved use of Genepop 4.1 (Rousset Reference Rousset2008). Genetic distance and principal component analysis involved use of NTSYS-pc (Rohlf Reference Rohlf2000). Structure 2.2 (Pritchard et al. Reference Pritchard, Stephens and Donnelly2000) was used to cluster individuals into K groups by estimating the posterior probability of the data for a given K, Pr(X|K). The number of populations (K) was determined by use of an admixture model with correlated alleles and K=2–10. Five independent runs of 100 000 Markov Chain Monte Carlo generations, after 100 000 generation burn-in periods, were used to estimate each value of K. The optimal K value was determined by use of the ad-hoc statistic ΔK (Evanno et al. Reference Evanno, Regnaut and Goudet2005). The number of Ks in each data set was evaluated by use of Structure Harvester (http://taylor0.biology.ucla.edu/structureHarvester), which implements the Evanno method for visualising structure output (Earl and vonHoldt Reference Earl and vonHoldt2012).
Acknowledgements
The authors are grateful to the Human Resource Development programme of the National Agricultural Innovation Project (NAIP/O&M/Hort/AM/4/1683), Indian Council of Agriculture Research, New Delhi, India for funding support for T.V. and V.S. to conduct research at West Virginia State University. We acknowledge the professional editing of Laura Smalls.
Supplementary material
To view supplementary material for this article, please visit http://dx.doi.org/10.4039/tce.2015.47.