I. INTRODUCTION
Many different kinds of face-centered cubic (FCC) materials such as Cu, Al, and Ni are widely used in industries, especially as structural materials. With the development of science and technology, more and more nanoscale structures made of FCC materials become significantly attractive. Different materials with the same FCC structure possibly present different failure patterns because of their different material properties such as their different vacancy-formation energies and surface energies.Reference Cui and Beom1 Therefore, to well apply such nanomaterials to micro-electro-mechanical systems, it is essential to achieve a better understanding of their mechanical properties, deformation behaviors, and fracture modes in an atomic scale.
Fracture is a complicated phenomenon caused by crack propagation. Such a process spans several scales and the smallest scale is the bond-breaking between atoms. Although the continuum fracture mechanics can explain the fracture behavior well in a macroscale, it cannot be applied directly in nanoscale because the fracture behavior of materials in nanoscale mainly dependents on the local atomic environment such as the atomic structure, the lattice orientation and the discrete nature of matter distribution.Reference Cui and Beom1,Reference Xu and Deng2 Therefore, atomistic modeling and simulation are more suitable to study the fracture behavior of materials in nanoscale. Among the various atomistic simulation methods, molecular dynamics (MD) simulation is most widely used.Reference Cui and Beom1–Reference Wu and Yao6
Cui et al.Reference Cui and Beom1 investigated the (100)[011] crack propagation in Cu and Al single crystals at 0 K. They found that the overall crack propagation behavior in Cu was brittle, whereas the crack in Al propagated through void nucleation and coalescence. Besides, a zigzag fracture pattern was observed in Al due to the competition between the local and global fractures. Such a crack propagation pattern for Al is similar to Xu and Deng's computational results,Reference Xu and Deng2 in which the (010)[100] crack propagated in the form of crack tip blunting, void nucleation at a short distance ahead of the effective crack tip where the atomic tensile stress concentrated, void growth and void coalescence. Xu et al. also found that the effective crack between the physical crack tip and the crack tip of the leading void could be considered as a cohesive zone in continuum fracture mechanics. Based on this postulate, Krull and YuanReference Krull and Yuan7 set a cohesive zone ahead of the original (010)[100] crack tip and studied the cohesive traction–separation laws. They found that the relationship between the atomic traction and separation agreed with the exponential function form proposed by NeedlemanReference Needleman8 and the failure was dominated by normal traction. Yamakov et al.Reference Yamakov, Saether, Phillips and Glaessgen9 investigated an intergranular fracture process along a flat Ʃ99[110] symmetric tilt grain boundary in Al based on the postulate of the cohesive zone as well and found asymmetric crack propagation along the symmetric tilt grain boundary, the crack propagated in a brittle way with little dislocation emission in one direction and in a ductile manner in the other direction, and the same phenomenon was also observed in Cu.Reference Cheng, Jin, Zhang and Gao10 WhiteReference White11 investigated the fatigue growth of the 〈100〉{110} crack using linear elastic fracture mechanics boundary conditions on the basis of MD and found that the crack propagated due to the combination of dislocation emission and atom separation. By means of MD simulation, Cheng et al.Reference Cheng, Shi and Zhang12 uncovered the following two dominant coupling mechanisms, the tension–shear coupling which promoted the dislocation nucleation from the crack tip and the nucleation-debonding coupling which retarded the dislocation nucleation.
Most of the studies mentioned above are about Al. However, many studies also have been done on other materials, such as Cu and Ni. Zhou et al.Reference Zhou, Yang and Lu13 investigated thermal effects on crack propagating in the Cu bicrystal grain boundary and found that the crack propagation transited from brittle to ductile at a critical temperature. Sun et al.Reference Sun, He, Wang and Lu14 studied the deformation and failure mechanisms of nanotwinned Cu films with a pre-existing crack with consideration of some factors which may influence the transition from brittle to ductile, such as the thickness of the film, the position of the crack and so on. Potirniche et al.Reference Potirniche, Horstemeyer, Gullett and Jelinek15 investigated fatigue crack growth in Cu single- and bi-crystals using MD simulations and found that lattice orientation may determine the crack tip plasticity by controlling the active slip systems in single Cu and mis-orientation angles may influence the way of crack propagation across the grain boundary in bicrystal Cu. Wu et al.Reference Wu and Yao6,Reference Wu and Yao16 performed MD simulations on crack propagation in single crystal Ni by taking the strain rate and temperature into account. They found that the crack propagated in a brittle way at a low strain rate and temperature. However, with the increase of strain rate and temperature, the crack propagation showed gradual transition from brittle to ductile fracture for the reason that the change in the strain rate and temperature may induce the microstructure evolution around the crack tip. Zhang and GhoshReference Zhang and Ghosh17 used MD simulations to study the deformation mechanisms near a crack in single crystal Ni and also found that the lattice orientation and loading stress may have an effect on the crack propagation behavior. Chowdhury et al.Reference Chowdhury, Sehitoglu, Rateick and Maier18 found twin spacing and the twin width played an important role in the fatigue crack growth resistance of nanocrystalline alloys.
Previous studies clearly showed that the crack in different materials with the same FCC structure may show different propagation behaviors. To the best of our best knowledge, as an important industrial material, there are few studies performed on crack propagation in Ag. In this paper, the crack propagation behaviors in a precracked single crystal Ag are investigated in detail via MD simulations. The deformation and fracture mechanisms are analyzed by presenting the atomic stress distribution and microstructure evolution of atoms around the crack tip at different temperatures in a single crystal Ag system.
II. SIMULATION METHODS
MD simulation describes the movement of atoms by solving the equations of motion of atom i which can be obtained from the Newton's second law,
 $${\vec F_i} = {m_i}{a_i}\quad ,$$
where  ${\vec F_i}$ is the total force on atom i by its neighboring atoms, m i is the mass of atom i, and a i is the acceleration of atom i. In MD simulations, the force is determined by
 $${F_i} = {{ - \partial U} \mathord{\left/ {\vphantom {{ - \partial U} {\partial {r_i}}}} \right. \kern-\nulldelimiterspace} {\partial {r_i}}}\quad ,$$
where U is the total interatomic potential energy of a system and r i is the position of atom i.
According to the descriptions given above, the interatomic potential energy may have a significant influence on the accuracy of simulation results. Owing to the diversity of atomic interaction in different materials, many different kinds of potential functions were developed to perform MD simulations on specific materials.Reference White11,Reference Soleymani, Parsa and Mirzadeh19 In the present work, the embedded atom method potentialReference Daw, Foiles and Baskes20 provided by MishinReference Williams, Mishin and Hamilton21 is adopted to simulate Ag because such kind of potential not only describes the bonding in metallic crystals well, but also accounts for the dependence of the strength of individual bonds on the local atomic environment, such as free surfaces and defects, which are very important in the simulation of fracture and damage. The model with an (010)[100] edge crack created by removing some atoms on the left side is shown in Fig. 1. The model thickness should be 4a at least to avoid an additional size effect.Reference Krull and Yuan7 And to improve computation efficiency, the size of the model and the edge crack are 80a × 50a × 4a and 8a × 1a × 4a, respectively, where a = 4.09 Å is the lattice constant of Ag. X, Y, and Z axes are oriented along [100], [010], and [001] directions, respectively. Periodic boundary conditions are applied in the Z direction and shrink-wrapping conditions are applied in both X and Y directions. Due to the periodic boundary condition and the limited thickness of the model, it is also called constrained 3D model.Reference Xu and Deng2 The top and bottom layers of atoms with a thickness of 1.5a are fixed and the right and left sides of atoms are fixed only in the X direction to limit boundary influence. Four different temperatures, 0.1 (about 0 K), 10, 50, and 100 K, are selected to study the temperature effect. At the beginning of MD simulations, the atomic system is relaxed to minimize its energy with a conjugate gradient method. Then mode I loading condition is applied to the relaxed system. It is stretched in the Y direction by setting the velocity of the top layer of atoms at 0.002a/ps (8.18 × 10⁻⁴ nm/ps) and the velocity along the Y direction from the bottom layer of atoms to the top layer of atoms linearly distributed from 0 to 0.002a/ps. The bottom layer of atoms is kept stationary and the global stretching strain rate is 4 × 10⁷/s. During stretching, the temperature of the system is maintained at constant values by Nosé–Hoover thermostatting.Reference Nosé22 An MD open source code called large-scale atomic/molecular massively parallel simulatorReference Plimpton23 is used to perform all simulations.
The MD simulation model of FCC single crystal Ag with an edge crack in this paper. (a) The schematic diagram, (b) the initial structure (the inset shows the local atomic structure around the crack tip).

The atomic configurations such as the local crystal structure and atomic tensile stress obtained from MD simulations are visualized by the open visualization tool.Reference Stukowski24 The local crystal structure around each atom is measured and colored with common neighbor analysis methodology.Reference Faken and Jónsson25,Reference Tsuzuki, Branicio and Rino26 According to the coloring method, atomic structures are colored as dark blue for FCC atoms, light blue for hexagonal close packed atoms, and red for unknown or disordered atoms. In the figures which show the atomic tensile stress distributions, the color ranging from blue to red represents the atomic tensile stress value distributing from low to high. The atomic stress of atom i is also calculated and can be defined as
 $${s_{ab}} = - \left[ {m{v_a}{v_b} + {{\sum\limits_{n = 1}^N {\left( {{r_{1a}}{F_{1b}} + {r_{2a}}{F_{2b}}} \right)} } \mathord{\left/ {\vphantom {{\sum\limits_{n = 1}^N {\left( {{r_{1a}}{F_{1b}} + {r_{2a}}{F_{2b}}} \right)} } 2}} \right. \kern-\nulldelimiterspace} 2}} \right]\quad ,$$
where a and b represent x, y, or z. m is the mass of atom i. v a and v b stand for the velocity in a and b directions, respectively. N indicates the number of neighbors of atom i. r 1 and r 2 are the positions of the two atoms. F 1 and F 2 are the forces on the two atoms. It should be noted that the atomic stress obtained from the MD simulation is in units of stress × volume. To have units of real stress, it needs to be divided by a peratom volume which is difficult to calculate in the system. The real stress of the system can be obtained through dividing the sum of all atomic stress by the total volume of the system and is defined as
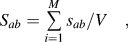 $${S_{ab}} = \sum\limits_{i = 1}^M {{{{s_{ab}}} \mathord{\left/ {\vphantom {{{s_{ab}}} V}} \right. \kern-\nulldelimiterspace} V}} \quad ,$$
where M is the total number of atoms in the system and V is the total volume of the system. The strain of the system is defined as
 $$\varepsilon = {{\Delta l} \mathord{\left/ {\vphantom {{\Delta l} l}} \right. \kern-\nulldelimiterspace} l}\quad ,$$
where l is the original length of the system in the stretch direction and Δl is the change relative to the original length.
III. SIMULATION RESULTS AND DISCUSSION
A. Crack propagation process at 0 K
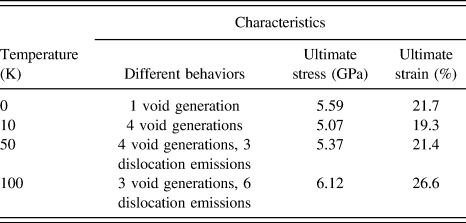
Figure 2 shows the stress–strain curve, atomic tensile stress distributions, and microstructure evolution for the crack propagation process of the precracked single crystal Ag at 0 K. Owing to geometric discontinuity of the system, the maximum atomic tensile stress exists at the crack tip when stretch begins. At first, the tensile stress of the system increases linearly with the strain to point (i) [Fig. 2(a)] which represents elastic deformation. At point (i), the crack tip blunting accompanied by a small crack growth can be considered as the initiation of crack growth, which results in a slight decrease of the tensile stress. At the same time, the maximum atomic tensile stress transfers to a certain distance in front of the blunt crack tip. Thereafter, the tensile stress of the system increases continuously corresponding to the strain from point (i) to (ii). Note that the stress oscillates a little bit due to the local adjustment of the atomistic structure in the crack tip region. At point (ii), a small void forms around the place with maximum atomic tensile stress [Figs. 2(a)-ii and 2(b)-ii]. In the meantime, the tensile stress reaches the maximum 5.59 GPa at the strain of 21.7%. Then the void becomes bigger and bigger and the atomic tensile stress concentration exists at the void tip. With the further increase of strain, the ligament between the void and the main crack breaks due to a small crack and void growth [Fig. 2(b)-iii], which leads to the propagation of the main crack. Finally, the subsequent crack propagation exhibits brittle behavior without any other atomic structure variation and approaches the break of the system at point (iv). In the crack propagation process from point (ii) to (iv), the largest atomic tensile stress only exists at the tip of the main crack. In addition, the tensile stress begins to decrease rapidly after point (ii) because of void nucleation, growth and linkage with the main crack and the fast propagation of the main crack.
Stress–strain curve, atomic stress distributions and evolution of atomic structures of the single crystal Ag system in the crack propagation process at 0 K. (a) Stress–strain curve and atomic stress distributions, (b) evolution of atomic structures (the insets show the local atomic structure around the growing crack tip in the green rectangles). (i) Crack tip blunting, (ii) void generation, (iii) coalescence of void and main crack, and (iv) before final fracture.
It can be observed from Fig. 2 that the crack in the single crystal Ag grows through the following stages at 0 K. (i) Crack tip blunting and crack growth initiation, (ii) void nucleation, (iii) coalescence of void and the main crack, and (iv) crack propagation in a brittle way. Such kind of crack propagation behavior is completely different from that in single crystal Ni (Ref. Reference Wu and Yao6) and Al (Ref. Reference Krull and Yuan7) at 0 K. In Ref. Reference Wu and Yao6, the crack propagates rapidly in a brittle manner without any change in the microstructure such as crack tip blunting and void nucleation. In Ref. Reference Krull and Yuan7, the crack propagates through the stages of crack tip blunting, crack growth initiation, repeating void nucleation, growth, and coalescence. It is well known that voids can be seen as a cluster of vacancies and that the vacancy-formation energy and surface energy of different materials are different.Reference Cui and Beom1 The different crack propagation formed in single crystal Ni, Ag, and Al may be due to the fact that the vacancy-formation energy and surface energy of Ag is higher than that of Al but lower than that of Ni. Therefore, it is obvious that different materials with the same FCC crystal structure may show different fracture modes.
B. Crack propagation process at 10, 50 and 100 K
Similarly, stress–strain curves, atomic tensile stress distributions and microstructure evolutions for the crack propagation process of the precracked single crystal Ag at higher temperatures are shown in Figs. 3, 4, and 5, respectively. It should be noted that the thermal motion of atoms can be activated when temperature is increased. Similar to the case at 0 K, there are four common characteristics among these cases at higher temperatures, such as atomic tensile stress concentration appears at the initial crack tip, then the stress concentration transfers to a certain place ahead of the crack tip when the crack tip becomes blunt, and the void tip after void nucleation as well as the tip of the growing crack after void linking up with the main crack.
Stress–strain curve, atomic stress distributions and evolution of atomic structures of the single crystal Ag system in the crack propagation process at 10 K. (a) Stress–strain curve and atomic stress distributions, (b) evolution of atomic structures (the insets show the local atomic structure around the growing crack tip in the green rectangles). (i) Crack tip blunting, (ii), (iii), (iv), and (v) void generations, and (vi) before final fracture.
Stress–strain curve, atomic stress distributions and evolution of atomic structures of the single crystal Ag system in the crack propagation process at 50 K. (a) Stress–strain curve and atomic stress distributions, (b) evolution of atomic structures (the insets show the local atomic structure around the growing crack tip in the green rectangles). (i) Crack tip blunting, (ii) single dislocation emission and void generation, (iii and iv) void generations, (v and vi) pairwise dislocation emissions, (vii) void generation, and (viii) before final fracture.
Stress–strain curve, atomic stress distributions and evolution of atomic structures of the single crystal Ag system in the crack propagation process at 100 K. (a) Stress–strain curve and atomic stress distributions, (b) evolution of atomic structures (the insets show the local atomic structure around the growing crack tip in the green rectangles). (i) and (ii) Crack tip blunting and emissions of the first pair of dislocations, (iii) and (iv) void generations, (v) return of pairwise dislocations, (vi) emissions of the second pair of dislocations and void generation, (vii) and (viii) emissions of the third pair of dislocations, and (ix) before final fracture.
At 10 K, it can be seen from Fig. 3 that the crack in single crystal Ag propagates through stages of crack tip blunting, crack growth initiation, void nucleation, void growth, and linkage with the main crack and the propagation of the main crack. But the crack propagation is more complex than that at 0 K. Here the last three stages appear four times alternately in the whole crack propagation process, however they appear only once at 0 K. At point (ii) in Fig. 3, the tensile stress of the system reaches the maximum 5.07 GPa at the strain of 19.3%. After this, rapid tensile stress drop-offs with some oscillations occur due to the atomic adjustment around the tip of the growing crack such as void nucleation and growth in the fast propagation process of the main crack. And the first stress oscillation with the increasing strain around point (iii) can be seen as strain-hardening.
At 50 K, it can be seen in Fig. 4 that besides those several stages mentioned in the cases at 0 and 10 K, the crack also propagates through the single dislocation emission and pairwise dislocation emission stages. With stretch proceeding to (i), the atomic structure in the crack tip region begins to change and the crack tip becomes blunt. Then a single dislocation nucleates ahead of the crack tip and propagates to the lower right of the crack tip along the  $[1\bar 10]$ direction [Fig. 4(b)-ii]. After that, the first void generates between the crack tip and the dislocation at point (ii). Here the tensile stress of the system reaches the maximum 5.37 GPa at the strain of 21.4%. Subsequently, the first void grows up and links up with the main crack. Then the main crack merges with the single dislocation and keeps growing until the generation of the second void [Fig. 4(b)-iii] which also grows up and links up with the main crack afterward. Then, the atoms in the tip region of the growing crack keep adjusting with the generation and growth of the third void around point (iv). And the tensile stress oscillation or strain-hardening is evident. At points (v) and (vi), a pair of dislocations generates and drifts to the right edge of the system along the {110} direction with the generation of the fourth void at point (vii). And the tensile stress oscillations are more complex due to the emission and propagation of dislocations. Finally, the main crack continues propagating after the fourth void linking up with the main crack [Fig. 4(b)-viii]. In this crack propagation process, the atomic tensile stress is also very large at the dislocation sites.
At 100 K, it can be seen in Fig. 5 that the crack extends through stages of crack tip blunting, repeating pairwise dislocation emissions, void nucleation, growth and linkage with the main crack and the propagation of the main crack. There are more dislocation emissions in this crack propagation process than that in any previous case. After the crack tip blunting and crack growth initiation, the first pair of dislocations generates ahead of the crack tip one by one and moves along the [110] and  $[1\bar 10]$ directions, respectively. It can be observed that the first pair of dislocations stay around the upper and lower fixed boundary successively from points (i) to (iii), which also leads to a little extension of the main crack. In addition, the first pair of dislocations causes a little stress oscillations of the system from points (i) to (iii). The tensile stress of the system reaches the maximum 6.12 GPa at the strain of 26.6% at point (iii) where the first void nucleates in front of the tip of the main crack. After its growth and linkage with the main crack and the propagation of the main crack, the second void generates [Fig. 5(b)-iv], grows up and links up with the main crack similarly. Then on further stretching, the main crack keeps extending while the first pair of dislocations goes back to the crack surfaces [Fig. 5(b)-v] along the paths that they went out. This phenomenon may be due to the existence of fixed boundaries. When the first pair of dislocations propagates to the fixed boundaries, their propagation can be impeded. Due to the propagation of the main crack, new crack surfaces are formed and compared with the fixed boundaries, the dislocations can escape from the crack surfaces more easily. Therefore, they propagate to the crack surfaces with the propagation of the main crack. From points (v) to (vi), the second pair of dislocations nucleates and moves to the upper and lower right corners of the system along {110} directions, then stays there successively due to the obstruction of the fixed boundaries. Thereafter, the third void generates and is surrounded by another group of dislocations [Fig. 5(b)-vi]. It grows up and the main crack keeps extending with emissions of the third pair of dislocations [Fig. 5(b)-viii] from points (vi) to (ix). And at point (ix), the third pair of dislocations propagates to the right edge of the system. In the crack propagation process, these pairs of dislocations cause the complicated tensile stress oscillations in the rapid tensile stress drop-off process. It can be found that the large atomic tensile stress occur at the dislocation sites as well.
To see the structure of dislocations clearly and know how they move along the {110} direction well, their structures on the middle plane in the thickness direction are shown in Fig. 6. The single dislocation at point (ii) in Fig. 4 and the first pair of dislocations at points (i) and (ii) in Fig. 5 are shown in Fig. 6(a)–6(c), respectively. It can be seen in Fig. 6 that they belong to edge perfect dislocations and slip in  $[1\bar 10]$, [110], and
 $[1\bar 10]$ directions, respectively. Actually, their slip systems are
 $\left( {111} \right)[1\bar 10]$,
 $\left( {1\bar 11} \right)\left[ {110} \right]$, and
 $\left( {111} \right)\left[ {1\bar 10} \right]$, respectively. Besides, the edge perfect dislocation in Fig. 6(a) can be considered as a small void. Therefore, for the case at 50 K, the main crack merging with the single dislocation may be seen as coalescence of the main crack and void from point (ii) to (iii) in Fig. 4.
The temperature effect on crack propagation in the single crystal Ag is summarized in Table I. Compared with the crack propagation in single crystal Ni,Reference Wu and Yao6 different crack propagations in different materials can be observed as well. Dislocation emissions and slip band generations occur in the single crystal Ni system at 30 K or higher temperature.Reference Wu and Yao6 But slip band generations do not appear at higher temperatures in the single crystal Ag system (Table I). It may be ascribed to the distinct sensitivity of different materials to temperature. The higher the temperature is, the more complex the crack propagation behavior is. Furthermore, the deformation of this single crystal Ag system at 50 and 100 K can be considered as plastic due to the existence of dislocation emissions which are important complementary mechanisms for plastic deformation.Reference Wu and Yao6 With the increase of temperature, the plastic behavior in this system becomes more and more obvious. Additionally, at higher temperatures, the ultimate stress and strain of this system increase with the increase of temperature.
Temperature effect on crack propagation in the single crystal Ag system.
C. Crack propagation dynamics at different temperatures
Figure 7 shows that the crack length changes with respect to strain for the crack propagation process of the system at different temperatures.
Crack length–strain curves of the crack propagation at different temperatures (the key characteristics at every stage in this figure are shown in Table II).
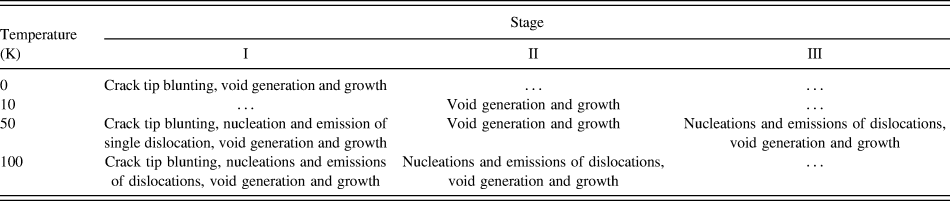
From Fig. 7, it can be observed that the crack growth initiates when atomic structure in the crack tip region starts to change in Figs. 2–5 and the corresponding strains for the cases at 0, 10, 50, and 100 K are 17.3, 17.1, 17.3, and 16.8%, respectively. Therefore, different temperatures have little impact on the initiation of crack growth. The crack lengths increase indistinctly (Stage I in Fig. 7) before fast crack propagation occurs in Figs. 2–5. Figure 7 also shows that for the cases at higher temperatures, the higher the temperature is, the longer the indistinct crack growth process lasts and later the sudden crack growth occurs (Stage I in Fig. 7). It can be inferred that the sudden crack growth can be delayed for the nucleation of the void and emissions of dislocations caused by thermal activation of atoms when the temperature is higher, especially for the emissions of dislocations in the case at 100 K. After the indistinct crack growth process, the crack lengths begin to increase suddenly when the main cracks extend fast, and the corresponding strains are 21.7, 19.3, 21.4, and 26.6% around which the tensile stresses of the system reach the maximum. Finally, the crack propagates through the whole system in a very small strain range and approaches the break of the system. The system bears a relatively large strain load before the sudden crack growth. Moreover, the crack length increases rapidly and smoothly at 0 K while the rapid crack growth can be retarded due to void nucleation and dislocation emissions (Stage II and III in Fig. 7 and Table II) at higher temperatures and it can be seen that the critical temperature for the transition from brittle to plastic deformation is around 10 K. And the rapid crack growths and retards are characterized by rapid stress drop-offs and stress oscillations in the corresponding stress–strain curves, respectively.
Different characteristics at the stages shown in Fig. 7.
The temperature effect on the crack propagation in the single crystal Ag system is shown in Fig. 7 as well. The tensile stress of the system changes with the crack length synchronously. And for the cases at higher temperatures, the obvious crack growth initiation can be delayed mainly due to the plastic deformation of the system in which dislocation emissions occur when the temperature gets higher.
IV. CONCLUSIONS
MD simulation has been used to study the crack propagation in a precracked single crystal Ag film under mode I loading at different temperatures. Some conclusions can be drawn based on the MD simulation results.
(1) At 0 K, the crack tip blunting and void generation, growth and linkage with the main crack occur at first. Then the crack propagates rapidly in a brittle way. With the increase of temperature, more void generations and dislocation emissions occur and the deformation of the single crystal Ag system transits from brittle to plastic deformation. The dislocations belong to edge perfect dislocations and their slip systems are 〈111〉{110}.
(2) The atomic stress distribution and tensile stress of the system are greatly affected by microstructure evolution at different temperatures. The atomic tensile stress concentrations occur at the initial crack tip, a certain place ahead of the blunt crack tip, the void tip or the tip of the growing crack. At higher temperatures, the atomic stress at the dislocation sites is also very large and the ultimate tensile stress increases with the increase of the temperature. The microstructure adjustment of atoms around the growing crack tip can lead to oscillations of tensile stress of the system.
(3) When the crack tip begins to blunt, the crack also starts to grow but it is not obvious. After a certain period, the crack growth becomes very obvious and its configuration at 0 K is different from that at higher temperatures. Besides, the tensile stress of the system changes with the crack length synchronously at different temperatures. They all reach the maximum and begin to reduce when obvious crack growth appears. And for the cases at higher temperatures, the situation is more complex than that for the case at 0 K.
The present work focuses on crack propagation of single crystal Ag under low temperatures. The deformation behaviors may be different under even higher temperatures. In addition, the effect of crystal orientations is not discussed in the work. Therefore, other specific MD models are needed as well for further study on these topics.
ACKNOWLEDGMENTS
This wok was fully supported by a grant from the City University of Hong Kong (Project No. 9680086), China Nature Science Foundation (11372281) and Zhejiang Province Nature Science Foundation (LY13A020003, LQ13A020002). The authors are grateful for the financial supports.