

Heavy metal contamination is a worldwide environmental problem (Otunola & Ololade, Reference Otunola and Ololade2020). Water pollution is one of the greatest environmental issues today due to its adverse effects on public health (Uddin, Reference Uddin2017). Methods exist for the removal of heavy metals from contaminated water using clay minerals (Gu et al., Reference Gu, Kang, Wang, Lichtfouse and Wang2019). In general in such processes, cations are adsorbed on the negatively charged sites of clay minerals. Exchangeable cations are easily exchanged with other cations, and the amount of adsorption depends on the type of clay mineral. For example, smectite and vermiculite have surfaces with relatively high negative layer charges, and cations balancing these layer charges are mostly adsorbed between the layers. These clays exchange ions present in the interlayer space, such as Ca2+, Mg2+, K+ or Na+, for heavy metal ions taken up from the liquid phase (Wada, Reference Wada2008). Different clay minerals have different cation-exchange capacities (CECs; Cho & Komarneni, Reference Cho and Komarneni2009; Dong et al., Reference Dong, Zeng, Lin and Yang2022). Regarding the adsorption of heavy metals on clay minerals, previous work has shown that such adsorption varies depending on the pH. Bhattacharyya & Gupta (Reference Bhattacharyya and Gupta2006, Reference Bhattacharyya and Gupta2007) conducted experiments on the adsorption of Cd and Pb on kaolinite and montmorillonite using Cd and Pb solutions at various pH values. The adsorption of Cd and Pb increased with increasing pH of the solution, and adsorption was greater for montmorillonite than for kaolinite (Bhattacharyya & Gupta, Reference Bhattacharyya and Gupta2006, Reference Bhattacharyya and Gupta2007). Different types of clay minerals also have different adsorption capacities for metals. Bladel et al. (Reference Bladel, Halen and Cloos1993) investigated such adsorption by cation exchange using four clay minerals saturated with Ca2+, and the sequence of adsorption was vermiculite > bentonite > illite > montmorillonite in the trace regions for Cd and Zn. Moreover, adsorption of metals on clay minerals varies depending on the types of elements in the solutions (Anjos et al., Reference Anjos, Rohwedder, Cadore, Abate and Grassi2014).
Calcined clay minerals have also been examined as adsorbents of heavy metals in aqueous solutions (Vieira et al., Reference Vieira, Neto, Gimenes and Silva2010; Olu-Owolabi et al., Reference Olu-Owolabi, Alabi and Unuabonah2016). The elution rate of Cs in heated soil decreased with increasing temperature over the range of 100–500°C and was minimal after heating at 500°C (Ikegami et al., Reference Ikegami, Fukutani, Takase, Kometani, Yoneda, Shimada and Matsui2014).
Clay minerals contain free adsorbed water, interlayer water and structural water. The free adsorbed water exists on the surface of the particles, interlayer water occurs in the interlayer region and structural water is contained in the crystal structure in the form of OH groups (Sato, Reference Sato1996; Johnston, Reference Johnston2010). Water in these forms is released upon heating of these clay minerals. Water bonding in clays increases in strength from adsorbed water, to interlayer water, to structural water, with the corresponding dehydration temperatures increasing accordingly (Kato, Reference Kato1989). Clay minerals may change under the influence of heat treatment as follows: the adsorbed water and interlayer water of clay minerals are lost at temperatures below 300°C and structural water is lost at 500–750°C. Clay minerals are decomposed and recrystallized at 850–1000°C (Kato, Reference Kato1989). In addition, dehydration and dehydroxylation of clay minerals by heat treatment may affect their adsorption properties (Aytas et al., Reference Aytas, Yurtlu and Donat2009). The characteristics of clay minerals may be change after heat treatment.For example, kaolinite is transformed into metakaolin at 500–700°C (Balek & Murat, Reference Balek and Murat1996), and recrystallization of metakaolin occurs at 900–1000°C (Tsuzuki, Reference Tsuzuki1971; Castelein et al., Reference Castelein, Soulestin, Bonnet and Blanchart2001). Regarding smectite and illite, Brunauer–Emmett–Teller (BET) specific surface area (SSA) values decrease after calcination (Hollanders et al., Reference Hollanders, Adriaens, Skibsted, Cizer and Elsen2016).
The adsorption capacities of natural kaolin for Cr, Cu and Ni were higher than those of kaolin calcined at 800°C (Talaat et al., Reference Talaat, El Defrawy, Abulnour, Hani and Tawfik2011). In addition, adsorption of U on calcined bentonite was highest at 400°C after heating across the temperature range of 100–500°C (Aytas et al., Reference Aytas, Yurtlu and Donat2009). Thus, the adsorption of metals may vary depending on the type of clay mineral and temperature. This study investigated the effects of heat treatment on the properties of clay minerals and the adsorption capacities of clay minerals for the removal of several heavy metals from aqueous solutions.
Materials and methods
Adsorbent preparation
Five reference clay minerals, namely kaolinite, dickite, pyrophyllite, hydrobiotite and montmorillonite, were used in this study. The reference clay minerals were obtained from the Clay Science Society of Japan: kaolinite (JCSS-1101b), dickite (JCSS-1301), pyrophyllite (JCSS-2101), hydrobiotite (JCSS-5501) and montmorillonite (JCSS-3102, Mikawa). The clay minerals contained minor impurities: alunite and quartz in kaolinite; quartz, pyrophyllite and diaspore in dickite; quartz, diaspore and kaolinite in pyrophyllite; diopside, wollastonite, apatite and titanite in hydrobiotite; and cristobalite, mica, amphibole, quartz and feldspar in montmorillonite (Miyawaki et al., Reference Miyawaki, Sano, Ohashi, Suzuki, Kogure and Okumura2010; Kikuchi & Kogure, Reference Kikuchi and Kogure2018). Kaolinite and dickite are 1:1-type clay minerals, whereas pyrophyllite, hydrobiotite and montmorillonite are 2:1-type clay minerals. The montmorillonite used in this study was Na- or Na-Ca-montmorillonite (Takagi, Reference Takagi2005).
These clay minerals were dried at 45°C. Hydrobiotite samples were ground with a mortar and sieved to 75 μm because the particle size of hydrobiotite is larger than those of the other clay minerals assessed. The clay minerals were calcined at various temperatures (100°C, 300°C, 500°C, 800°C and 1000°C) for 1 h and left to cool to room temperature in a programmed muffle furnace (VTDS-16R, ISUZU).
Changes in the weight, CEC, BET SSA and mineralogical composition of the heated clay minerals were investigated in this study.
Cation-exchange capacity
The CEC was determined according to Muramoto et al. (Reference Muramoto, Goto and Ninaki1992) as follows: 30 mL of 1 M solution of ammonium acetate was added in a centrifuge tube containing 2 g of the heated clay minerals, shaken at 200 rpm for 15 min at room temperature and centrifuged at 2500 rpm for 3 min. The supernatant solution was discarded. The above procedure was repeated twice. In the repeating stage, the samples were shaken strongly for 30 s by hand instead of in a shaker. Then, 20 mL of 80% solution of methanol was added to the tube, and the sample remained in the tube as a residue after discarding the supernatant. This tube was shaken strongly for 30 s and centrifuged at 2500 rpm for 3 min. The supernatant solution was discarded. The above procedure was repeated twice. Then, 30 mL of 10% KCl solution was added to the tube containing the clay. This tube was shaken at 200 rpm for 15 min and centrifuged at 2500 rpm for 3 min. The supernatant solution was filtered and collected in a 100 mL volumetric flask. The above procedure was repeated twice. During this repetition, the samples were shaken strongly for 30 s by hand instead of in a shaker. This volumetric flask was filled with 10% KCl solution up to a pre-marked line. The solution was taken from this volumetric flask and was diluted five times to measure the amount of ammonia nitrogen using an ammonia meter. As montmorillonite is a swelling clay, the solutions of natural and 100°C-heated montmorillonite samples were filtered after dilution. The CEC (cmol kg–1) was calculated using Equation 1:
 \begin{equation}{\text{CEC}} = \frac{{\left[ {{\text{NH}}_4^ + } \right]}}{N} \cdot \frac{v}{{1000}} \cdot \frac{{100}}{m} \cdot X = \frac{{X \cdot v \cdot \left[ {{\text{NH}}_4^ + } \right]}}{{10 \cdot N \cdot m}}\end{equation}
where  $\left[ {{\text{NH}}_4^ + } \right]$ is the ammonia nitrogen concentration (mg L–1),
 $v$ is the solution volume when filling up to a pre-marked line (mL),
 $m$ is the mass of the clay samples (g),
 $X$ is dilution factor and
 $N$ is the atomic weight of nitrogen (g).
BET SSA
The BET SSA values of natural and calcined clay minerals were obtained using N2 gas adsorption and measured using surface area and porosity analysers (TriStar II, Shimadzu Co., Japan). In total, 250 mg of each sample was degassed in vacuum by heating and evacuation.
Mineralogical analysis
Dry clay minerals and calcined materials were characterized using X-ray diffraction (XRD) with a MiniFlex6000 (Rigaku) diffractometer operating at 15 mA and 40 kV. XRD traces were obtained using Cu-Kα radiation over a scan range of 3–90°2θ, with a scanning step of 0.02°, and they were analysed with PDXL v.2.8.4 software for powder XRD traces (Rigaku).
Adsorption of heavy metals and Cs
In this study, Co, Ni, Cd, Pb and Cs were selected to be used in the adsorption experiments with the calcined clay minerals. Solutions containing 10 ppm Co2+, Ni2+, Cd2+, Pb2+ and Cs+ were prepared by mixing aqueous solutions of Co(NO3)2, Ni(NO3)2, Cd(NO3)2, Pb(NO3)2 and CsCl. However, with increasing pH, metal hydroxides form and the solubility decreases. For example, the concentrations of Co and Ni at pH > 8, Cd at pH > 10 and Pb at pH > 6 in the solution decrease due to precipitation. In addition, when the pH value is low, the adsorption rate of Cd decreases significantly (Bhattacharyya & Gupta, Reference Bhattacharyya and Gupta2007). Therefore, the pH of the 10 ppm mixed solution was adjusted to 4 or 6 with 0.1 N NaOH solution. As mentioned above, at pH > 6, the solubility of Pb is low and the concentration of Pb in the solution decreases; yet when a 10 ppm mixed solution was prepared at pH 6, the concentration of Pb in the solution remained unchanged at 10 ppm.
A total of 10 mL of the 10 ppm solution containing metal ions was added to 1 g of the calcined clay minerals, which was shaken at 180 rpm for 24 h and centrifuged at 3000 rpm for 20 min. The supernatant solution was filtered through a 0.45 μm filter, and the filtrate was diluted and measured using inductively coupled plasma mass spectrometry (Plasma Quant MS, Analytik Jena) or inductively coupled plasma optical emission spectroscopy (iCAP6300, Thermo Fisher Scientific). As montmorillonite has swelling properties, 40 mL of the 10 ppm mixed solution was added to 1 g of montmorillonite.
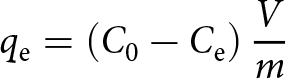
The adsorption capacities,  ${q_{\text{e}}}$ (mg g–1), of heavy metals and Cs were calculated using Equation 2:
 \begin{equation}{q_{\text{e}}} = \left( {{C_0} - {C_{\text{e}}}} \right)\frac{V}{m}\end{equation}
where  ${C_0}$ and
 ${C_{\text{e}}}$ are, respectively, the initial and equilibrium concentrations of heavy metals and Cs (mg L–1),
 $m$ is the mass of the adsorbent (g) and
 $V$ is the volume of the heavy metal and Cs solution (L).
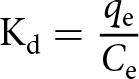
The distribution coefficient (Kd; L g–1) was calculated using Equation 3:
 \begin{equation}{{\text{K}}_{\text{d}}} = \frac{{{q_{\text{e}}}}}{{{C_{\text{e}}}}}\end{equation}
where  ${\textit{q}}_{\mathit e}$ is the adsorption capacity for metal (mg g–1) and
 ${\textit{C}}_{\mathrm e}$ is the equilibrium concentration of the metal (mg L–1).
Results and discussion
Effects of calcination
Figure 1 shows the weight losses of the heated clay minerals. In this study, the weight of the clay minerals was measured without thermogravimetric analysis or differential thermal analysis. The weight of kaolinite decreased gradually at temperatures lower than 300°C and decreased rapidly at 500°C and 800°C, and that of dickite decreased at 500°C and 800°C. The weight of pyrophyllite decreased significantly at 800°C. The weight of hydrobiotite and montmorillonite decreased at 100°C, did not change again until 500°C, and then further decreased at 800°C.
Weight losses of the clay minerals after heating at various temperatures.
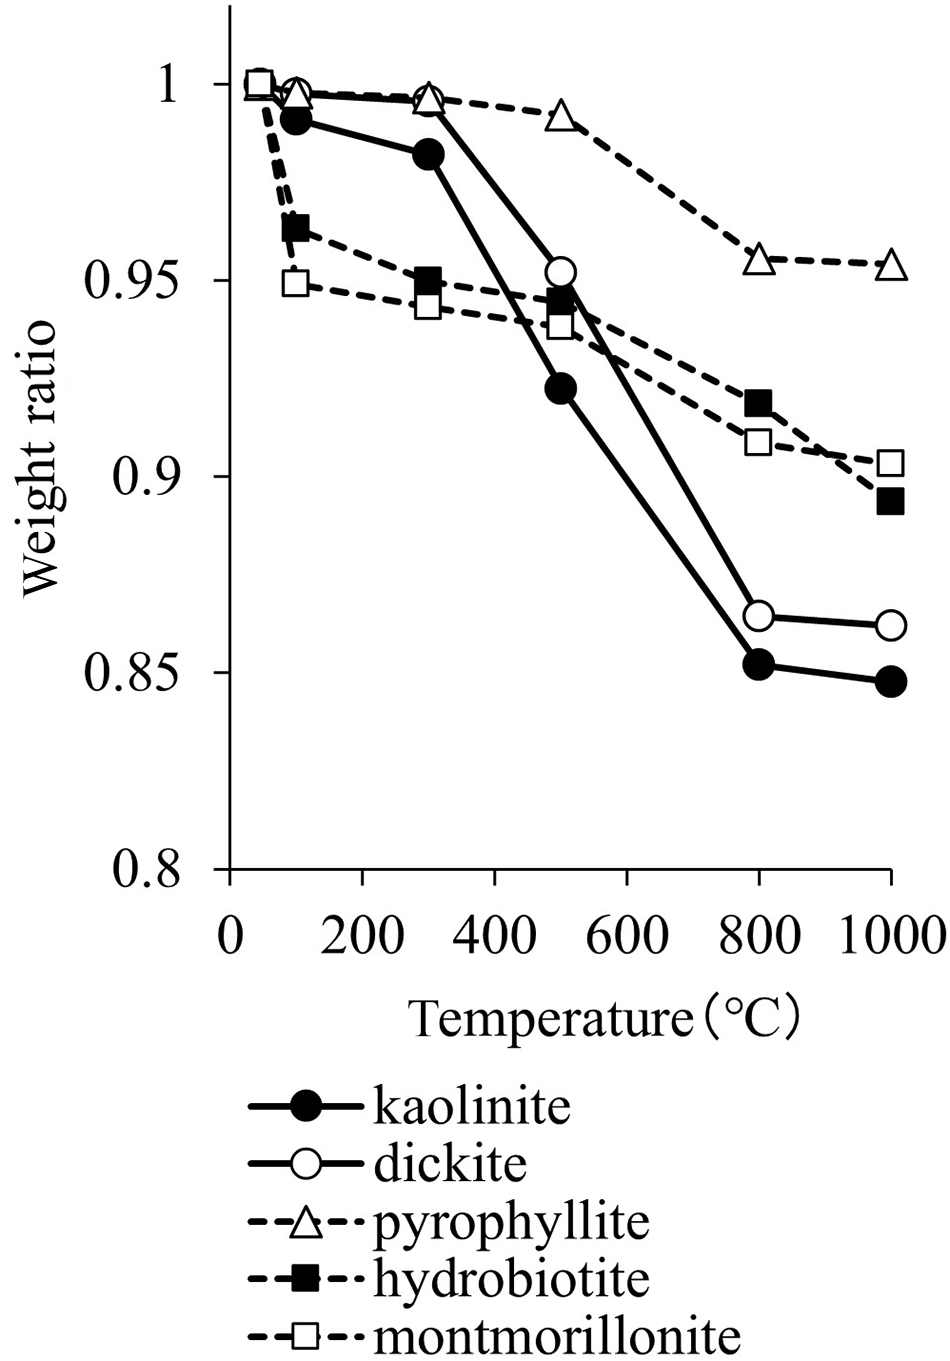
Kaolinite and dickite do not have interlayer ions and interlayer water. The dehydroxylation of kaolin minerals occurs at 500–700°C, at which temperature they transform into amorphous metakaolin (Balek & Murat, Reference Balek and Murat1996). Recrystallization of metakaolin occurs at 900–1000°C, forming mullite (Tsuzuki, Reference Tsuzuki1971; Castelein et al., Reference Castelein, Soulestin, Bonnet and Blanchart2001). Similarly to kaolin minerals, pyrophyllite has no interlayer ions or interlayer water, and dehydroxylation occurs above 500°C (Sanchez-Soto & Perez-Rodriguez, Reference Sanchez-Soto and Perez-Rodriguez1989). Hydrobiotite has interlayer ions and interlayer water, and dehydroxylation occurs at 300–800°C (Kikuchi & Kogure, Reference Kikuchi and Kogure2018). Montmorillonite also has interlayer ions and interlayer water; removal of this interlayer water occurs at 100–300°C, and dehydroxylation occurs at 600–750°C (Uno, Reference Uno, Kohyama, Sato and Takeshi1986).
Hydrobiotite contains water molecules in the vermiculite layer and hydrated potassium ions (Kikuchi & Kogure, Reference Kikuchi and Kogure2018). Montmorillonite retains a large amount of water in the interlayer. The weight loss at ∼100°C is due to the release of interlayer water. Dehydroxylation (i.e. release of OH groups from the crystal structure) is linked with the weight loss of kaolinite and dickite at 500–800°C and of pyrophyllite, hydrobiotite and montmorillonite at 800°C. Thus, the change in the mass of clay minerals at various temperatures can be used to estimate the presence of water in the clay minerals.
Cation-exchange capacity
The CEC values of the calcined clay minerals are shown in Table 1. The CEC of kaolinite and dickite decreased gradually with increasing calcination temperature. The CEC of pyrophyllite decreased gradually or did not change significantly at temperatures lower than 300°C and declined at temperatures higher than 500°C. The CEC of hydrobiotite decreased considerably at 1000°C, whereas that of montmorillonite decreased at temperatures higher than 800°C.
CEC (cmol kg–1) values of clay minerals at various temperatures.
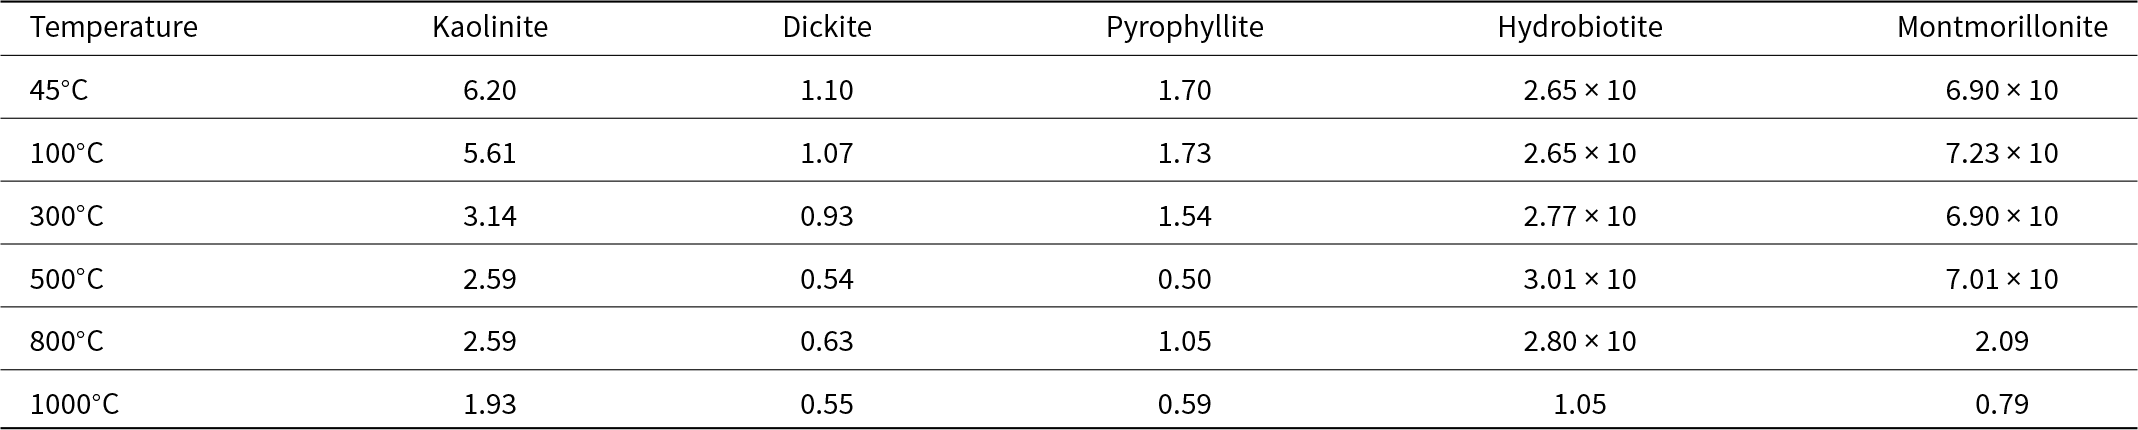
Kaolinite, dickite and pyrophyllite do not have interlayer ions or interlayer water. Hydrobiotite is a mixed interlayer biotite/vermiculite mineral with various degrees of vermiculitization (Kikuchi & Kogure, Reference Kikuchi and Kogure2018). Biotite has a low CEC (Cho & Komarneni, Reference Cho and Komarneni2009) and vermiculite has a high CEC (Dong et al., Reference Dong, Zeng, Lin and Yang2022). Heating of vermiculite at 900°C caused destruction of the layer structure and decreased its CEC (Suzuki et al., Reference Suzuki, Amano, Ochi and Chikuma2015). It is possible that this decrease in CEC of hydrobiotite is because of the structural change of vermiculite with heat treatment. The reduction in CEC of montmorillonite could be due to the fact that exchangeable cations form oxides upon calcination at 800°C and 1000°C. Strong bonds form between these oxides and the clay layers, leading to the blocking of the exchange sites (Tettenhorst, Reference Tettenhorst1962; Yamanaka & Brindley, Reference Yamanaka and Brindley1979).
Therefore, the CEC values of clay minerals decreased due to calcination, and in particular the CEC values of clay minerals that have exchangeable cations between their layers decreased at high temperatures.
BET SSA
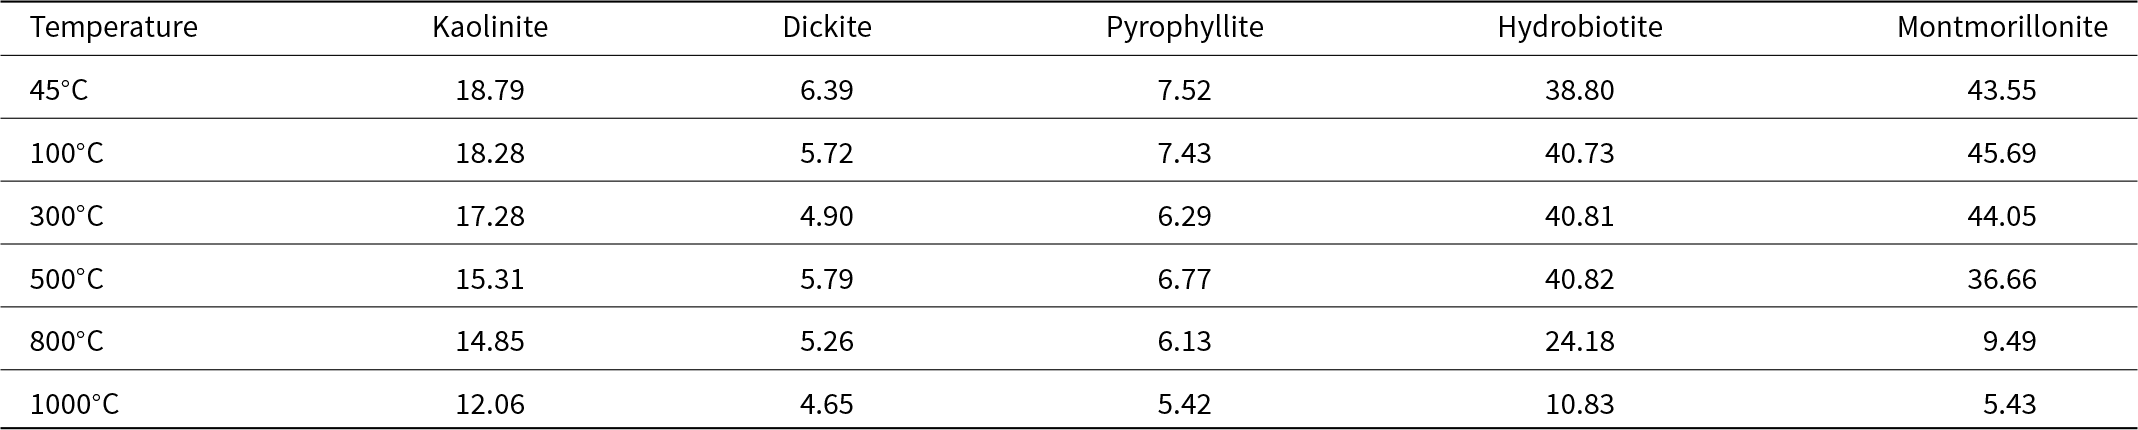
The BET SSA values of the clay minerals are shown in Table 2. The BET SSA values of kaolinite, dickite and pyrophyllite decreased gradually or did not change significantly with increasing temperature. The BET SSA values of hydrobiotite and montmorillonite began to decrease at 800°C and 500°C, respectively, and that of montmorillonite declined significantly at temperatures higher than 800°C. The BET SSA values of clay minerals that do not have interlayer water were not affected significantly by calcination, and the BET SSA values of clay minerals that have interlayer water decreased due to calcination. The reduction of BET SSA at high temperatures is probably due to agglomeration, reduction of surface roughness and reduction of microporosity (Fernandez et al., Reference Fernandez, Martirena and Scrivener2011; Hollanders et al., Reference Hollanders, Adriaens, Skibsted, Cizer and Elsen2016; Vallina et al., Reference Vallina, Rodríguez-Ruiz, Santacruz, Cuesta, Aranda and Torre2024). When smectite minerals such as montmorillonite are calcined, agglomeration of the particles is more pronounced than in kaolinite (Hollanders et al., Reference Hollanders, Adriaens, Skibsted, Cizer and Elsen2016). Such particle agglomeration leads to a decrease of the BET SSA (Hollanders et al., Reference Hollanders, Adriaens, Skibsted, Cizer and Elsen2016).
BET SSA (m2 g–1) values of the calcined clay minerals at various temperatures.
XRD analysis
Figure 2 shows the XRD traces of the original and heated clay minerals. The XRD trace of kaolinite showed strong diffraction peaks at 12.4° and 24.9°. These peaks decreased after heat treatment at 500°C and disappeared at 800°C and 1000°C. The intense diffraction maxima of dickite at 12.3° and 24.8° disappeared at 800°C and 1000°C, respectively, similarly to kaolinite. The diffraction maxima of pyrophyllite occurred at 9.6° and 29.0°. The intensity of the strong peak at 9.6° decreased at 800°C and 1000°C. The intensity of the diffraction peak of hydrobiotite at 7.4° decreased after heating at a temperature lower than 500°C and disappeared at 800°C and 1000°C. A new peak appeared at 8.8° at temperatures higher than 800°C. Hydrobiotite contains water molecules in the interlayer that hydrate potassium ions (Kikuchi & Kogure, Reference Kikuchi and Kogure2018). Water molecules between the interlayers are removed by heat treatment, and this removal may reduce the interlayer distance. The XRD trace of montmorillonite showed diffraction peaks at 7.0° and 19.9°. These peaks disappeared at 500°C and 800°C, respectively.
XRD traces of the dried and calcined clay minerals at various temperatures.
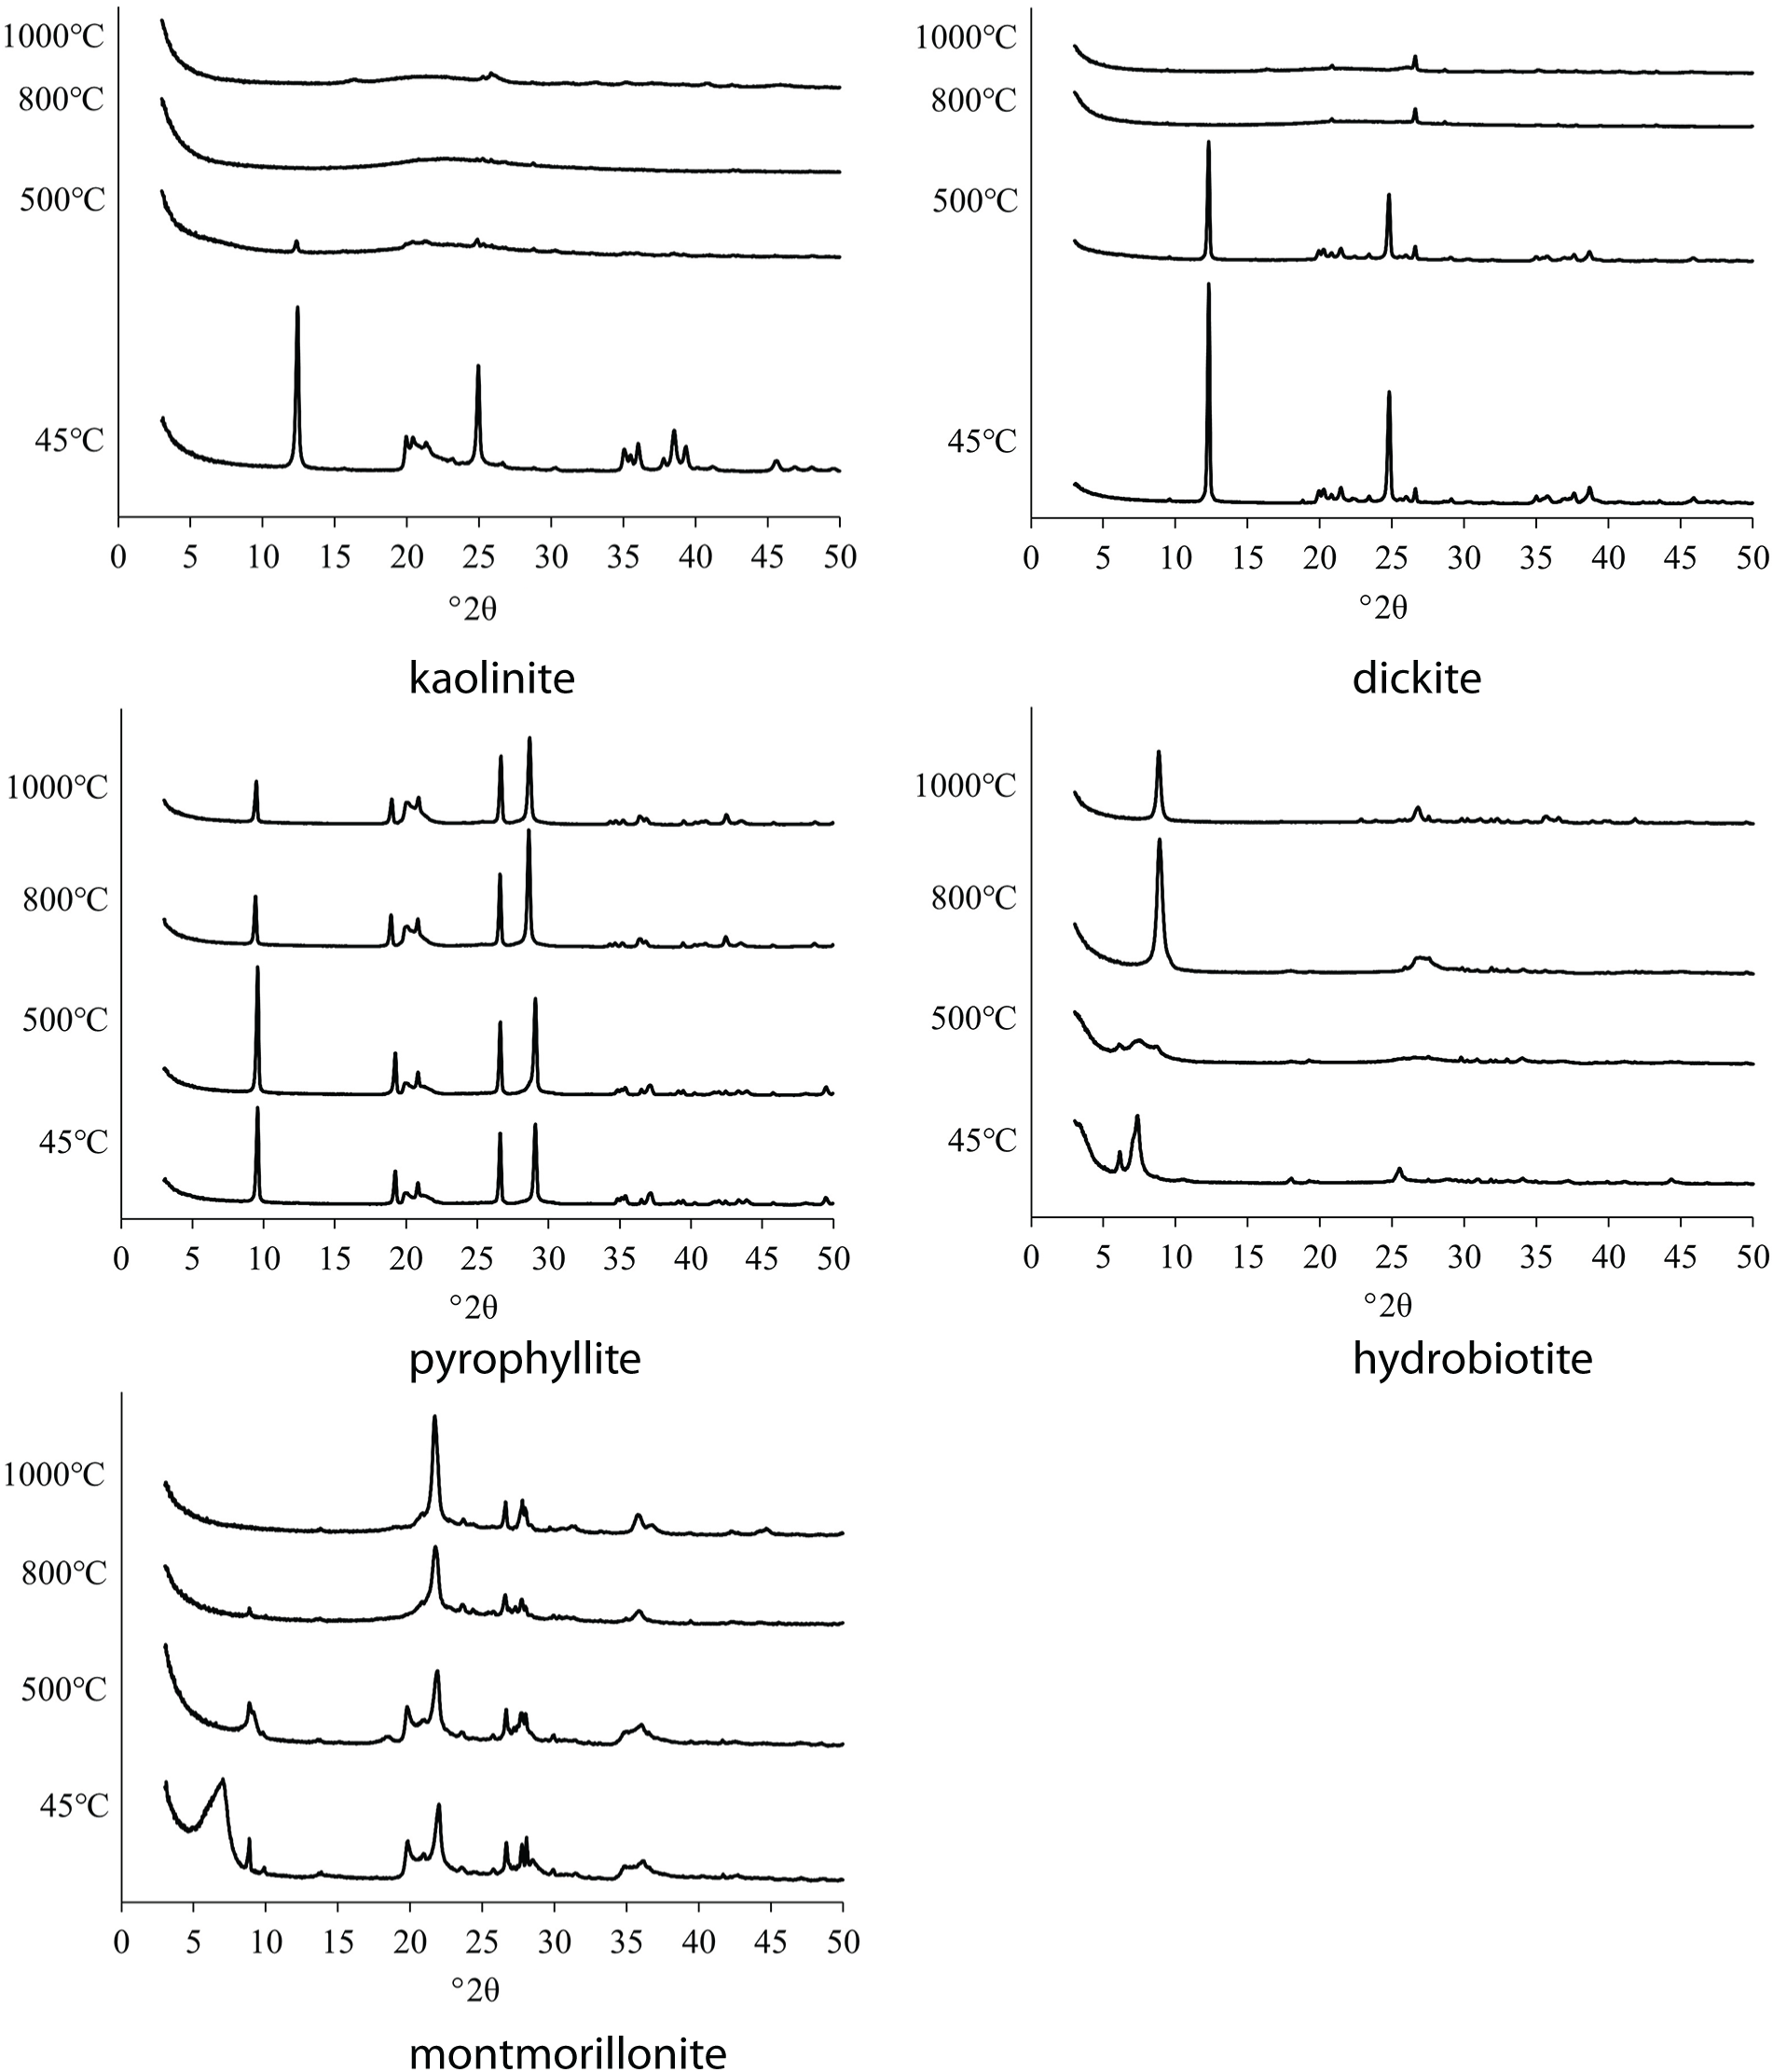
Calcined kaolinite and dickite showed humps typical of amorphous materials. The degrees of crystal order of the clay minerals after heat treatment are listed in Table 3. The crystal order of kaolinite, dickite and montmorillonite decreased with increasing temperature below 800°C and increased again at 1000°C, whereas the crystal order of pyrophyllite and hydrobiotite was not affected by temperature. Therefore, the crystal structures of pyrophyllite and hydrobiotite were not destroyed by heat treatment.
Crystal orders relative to the original clay mineral of the clay minerals after heating at various temperatures.

Kaolin minerals are transformed into metakaolin at 500–700°C, which is poorly crystalline, due to dehydroxylation. The recrystallization of metakaolin occurs at 900–1000°C (Castelein et al., Reference Castelein, Soulestin, Bonnet and Blanchart2001), and this is thought to be the reason for the greater crystal order at 1000°C. Montmorillonite samples showed a halo pattern at a temperatures higher than 800°C. Montmorillonite shows an X-ray amorphous state at temperatures above 800°C (Uno, Reference Uno, Kohyama, Sato and Takeshi1986), which is in accordance with the results of this study. The crystal order of montmorillonite decreased at a higher temperature than in kaolinite and dickite, probably due to the fact that the dehydroxylation of montmorillonite occurred at a higher temperature than in kaolinite and dickite. Therefore, the crystalline structures changed via calcination due to dehydroxylation.
Metal adsorption
The adsorption capacities at various temperatures are shown in Figs 3 & 4. The adsorption capacities at pH 6 were slightly greater than at pH 4 overall. The adsorption capacities of kaolinite and dickite did not change significantly after heating up to 300°C and decreased after heating at 500–800°C. The adsorption capacity of pyrophyllite remained constant after heating up to 800°C but decreased at 1000°C. Hydrobiotite showed the greatest adsorption capacity for all elements except Cs among the clay minerals, regardless of the temperature. The adsorption capacity for Cs was high up to 500°C but decreased at temperatures above 800°C. For montmorillonite, the adsorption capacity was high up to 500°C but decreased at temperatures above 800°C.
Adsorption capacities of the heated clay minerals (initial solution pH = 4).
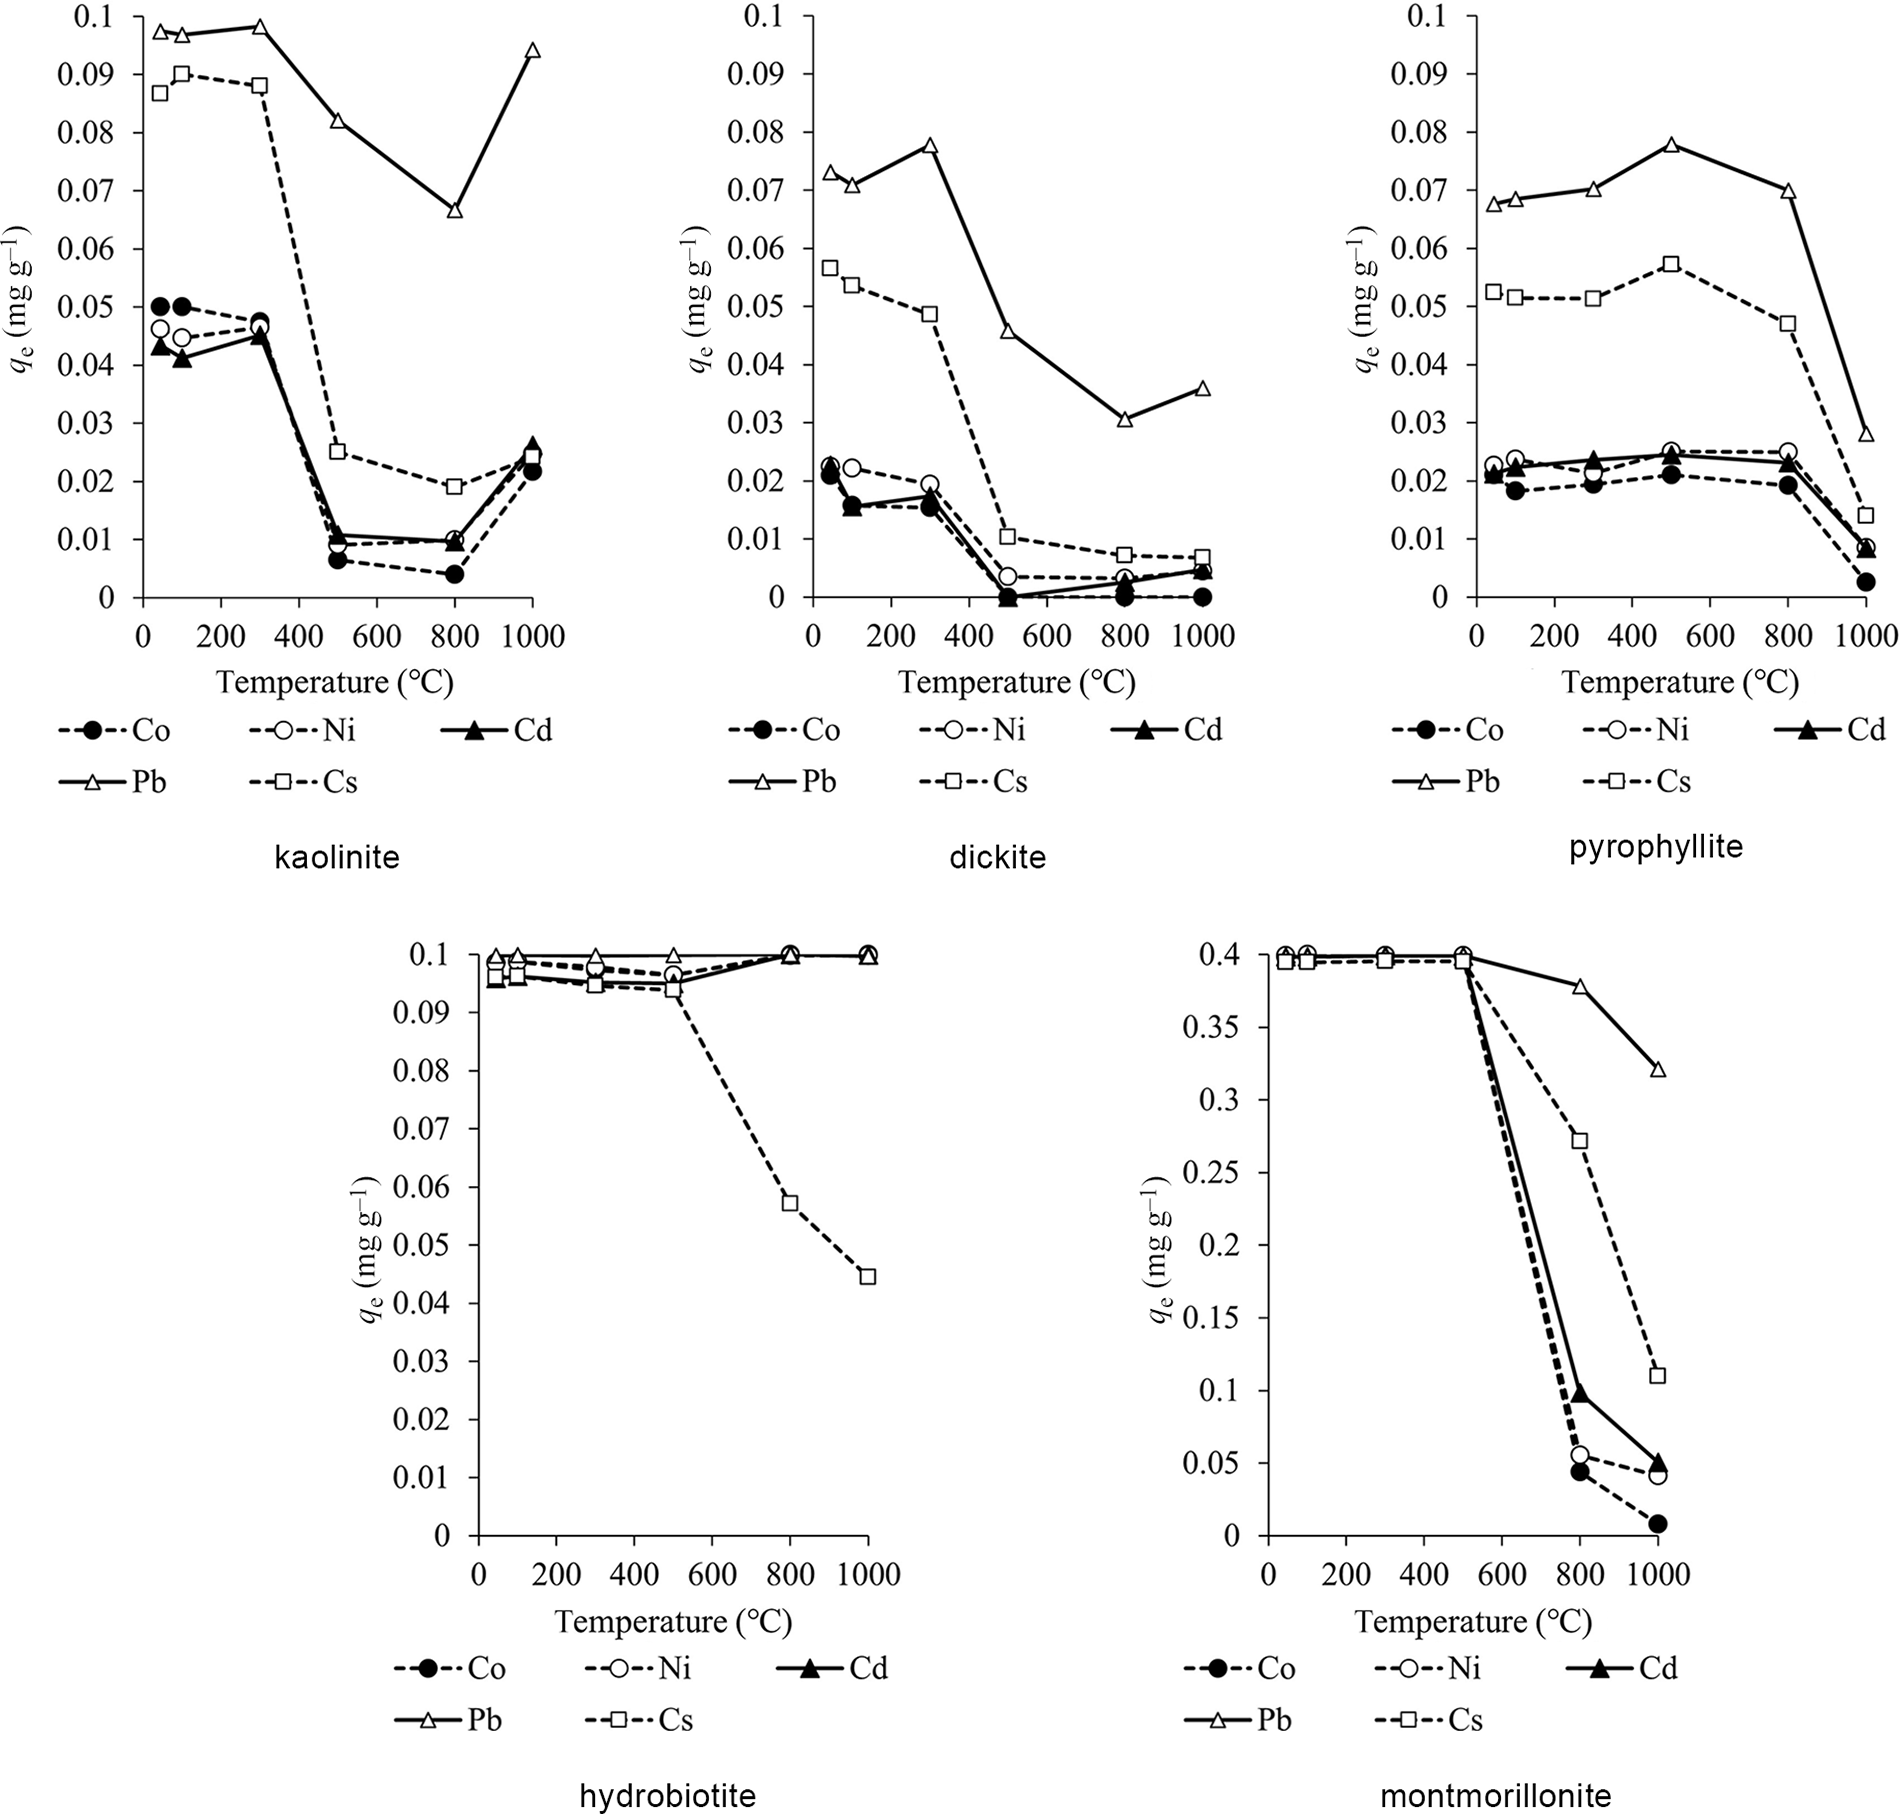
Adsorption capacities of the heated clay minerals (initial solution pH = 6).
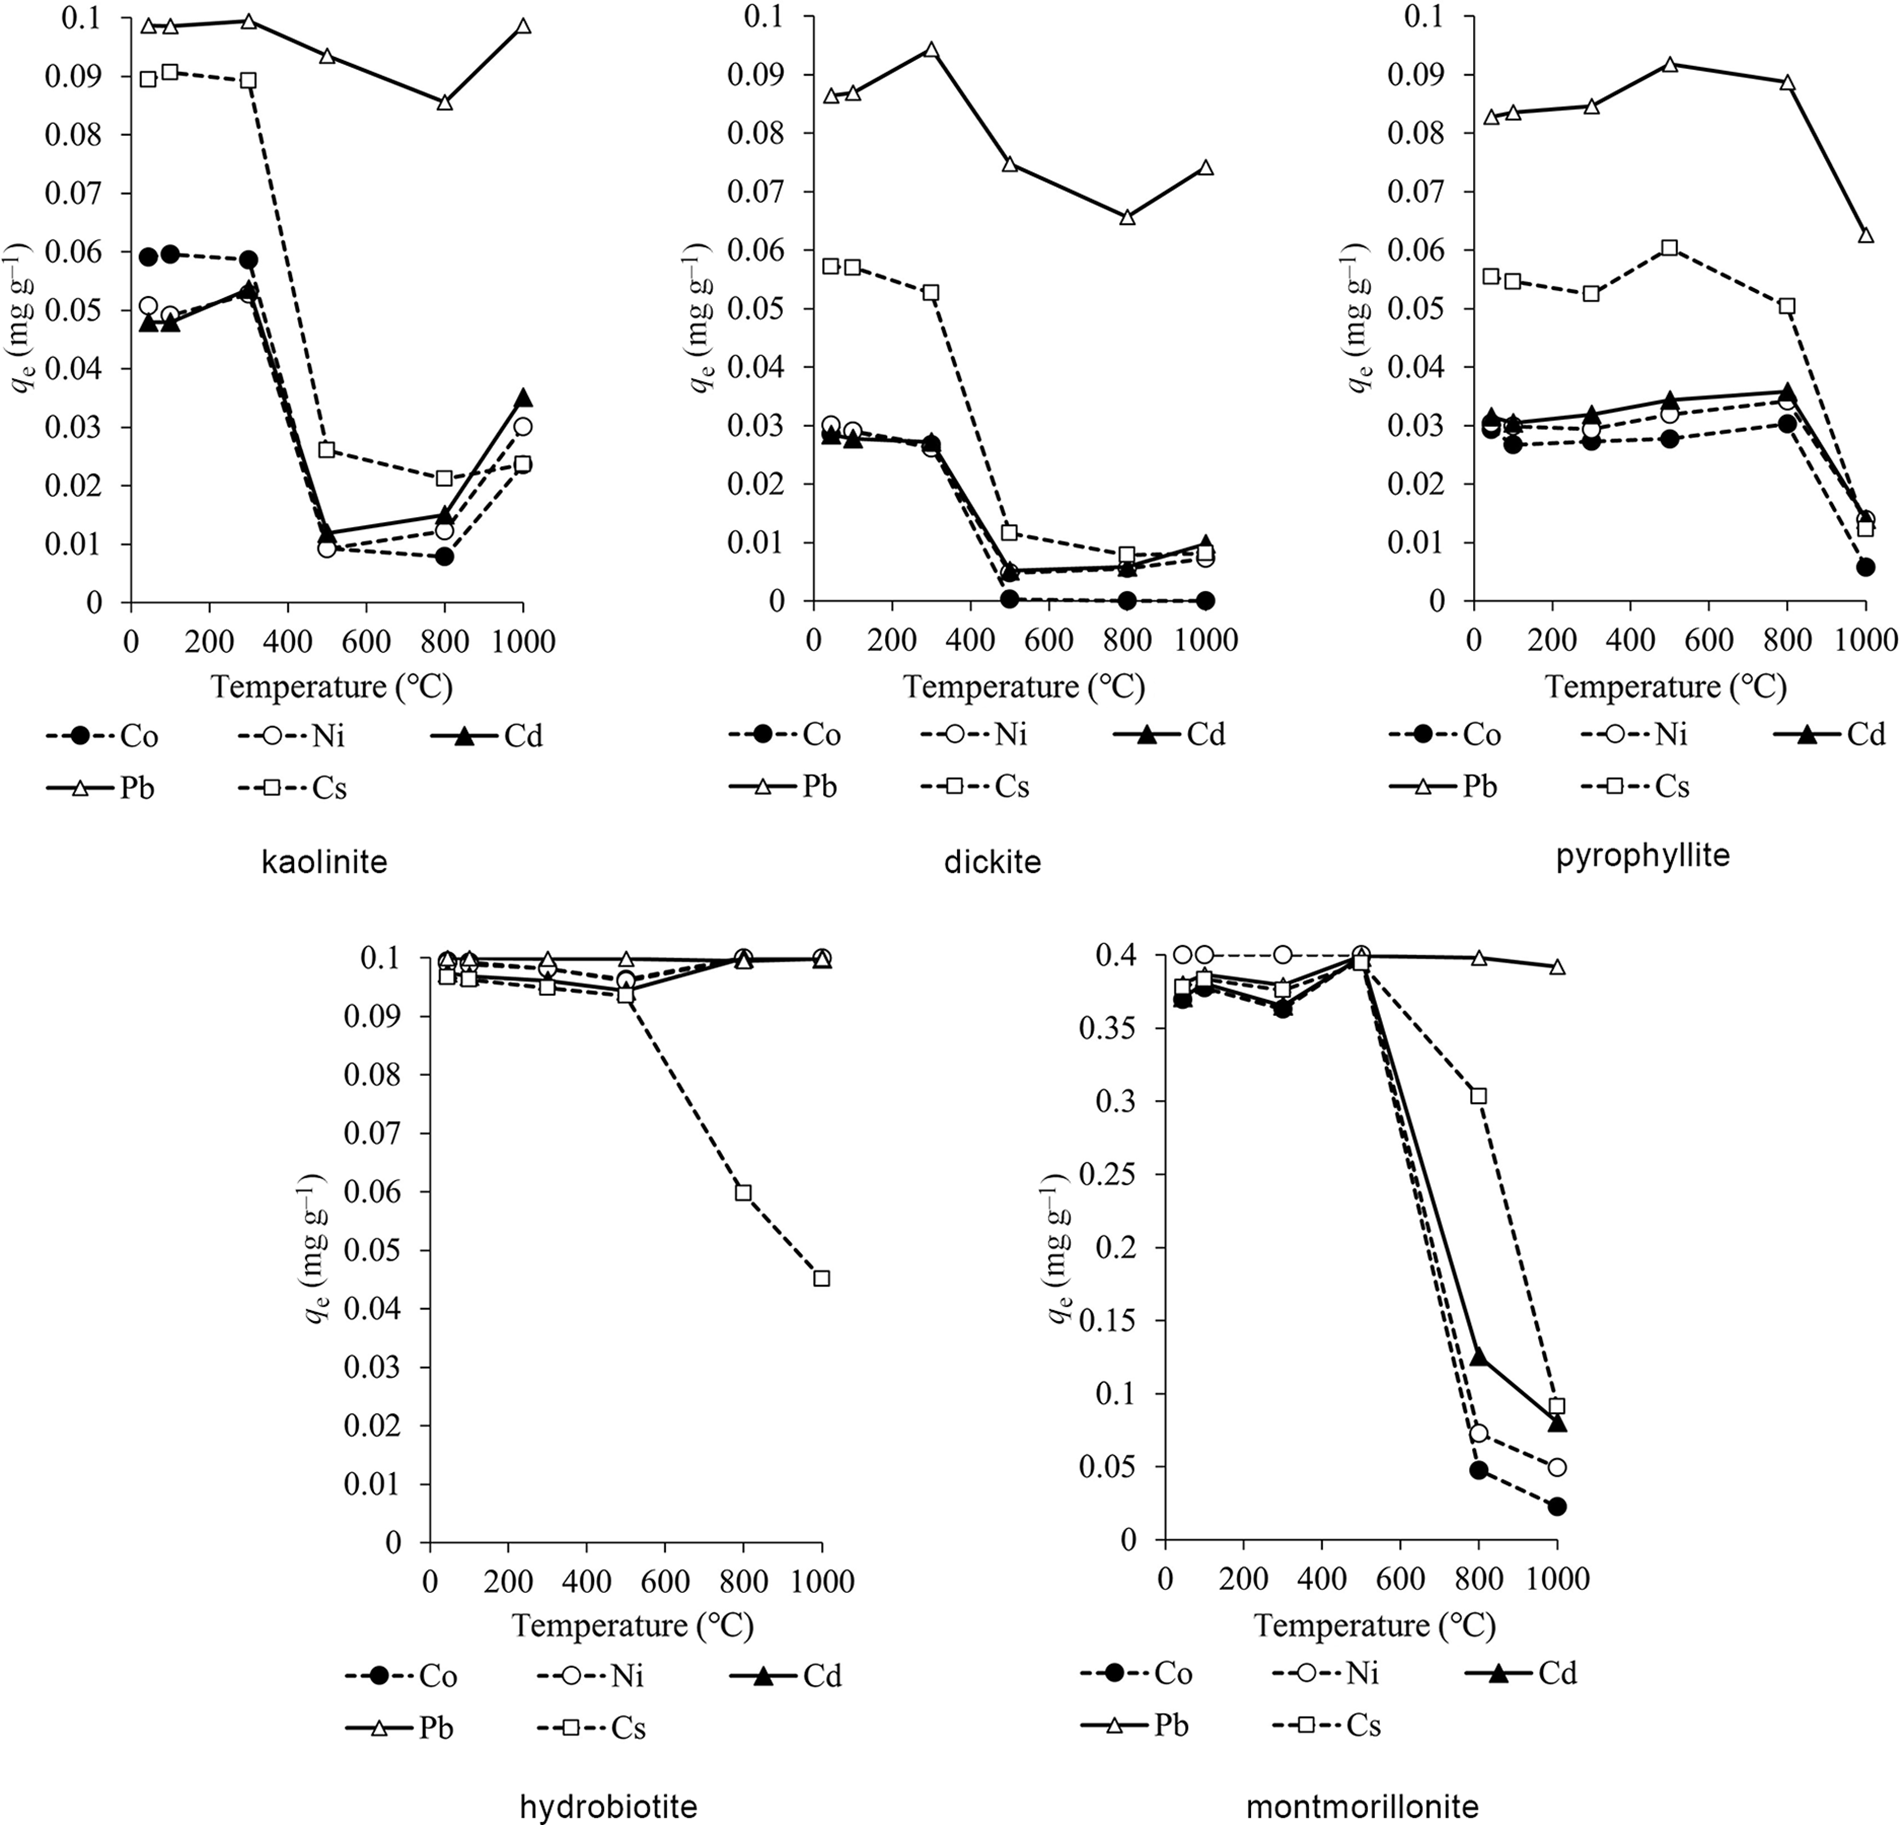
For kaolinite and dickite, heavy metal ions such as Cd are selectively adsorbed on dissociated OH groups (Sato, Reference Sato1996). The decrease in adsorption capacity of kaolinite and dickite after heating at 500°C may be due to dehydroxylation, resulting in a decrease in adsorption sites. Kaolinite and dickite have variable charges, and 2:1-type clay minerals such as montmorillonite have high permanent layer charges. These variable charges change depending on pH and become negative when pH is higher than the point of zero charge (Itami et al., Reference Itami, Mori and Kitagawa2001; Sato, Reference Sato2001). In this study, the pH of adsorption was greater than the point of zero charge of natural kaolinite and dickite. Even though the CEC values of kaolinite and dickite were low after heating at 1000°C, the increase in adsorption capacity at 1000°C was probably related to recrystallization. Calcination at 1000°C recrystallized kaolin to a defect spinel that has the adsorption characteristics of a heterogeneous oxide (Drzal et al., Reference Drzal, Rynd and Fort1983). Furthermore, this heterogeneity is strongly related to the adsorption capacity (Laszlo et al., Reference Laszlo, Podkoscielny and Dabrowski2006). Pyrophyllite does not have exchangeable cations between its layers, and so adsorption occurs on its surfaces and end faces. Although pyrophyllite undergoes dehydroxylation at temperatures above 500°C, the crystal structure does not collapse upon heating, so the adsorption capacity may not decrease at 500–800°C, in contrast to what was observed for kaolinite and dickite. The decrease of adsorption capacity after heating at 1000°C may be related to the fact that pyrophyllite is amorphous at 950–1050°C (Fitzgerald et al., Reference Fitzgerald, Hamza, Ara and Bronnimann1996). Hydrobiotite and montmorillonite undergo dehydration of interlayer water at 100–300°C. Hydrobiotite and montmorillonite have exchangeable cations between their layers, and cations in solution are easily ion-exchanged with exchangeable cations (Sato, Reference Sato2001). Calcination caused dehydration and dehydroxylation and, consequently, less adsorption compared to the natural clay (Gupta & Bhattacharyya, Reference Gupta and Bhattacharyya2012) However, the adsorption capacity was high after heating at 100–300°C. Hydrobiotite showed high adsorption rates for all cations except for Cs, even though its CEC decreased at 1000°C. This might be due to other adsorption mechanisms than ion exchange. Montmorillonite showed a decrease in adsorption capacity after heating at 800°C. The change in crystal structure observed at temperatures above 800°C might be linked to the decrease in adsorption capacity. The CEC of montmorillonite, which indicates the maximum amount of ions that can be retained by ion exchange, was high at temperatures below 500°C but deceased after heating at temperatures above 800°C. This indicates that ion exchange plays a major role in the adsorption of metals by montmorillonite.
The distribution coefficients of the metals in clay minerals (pH of the initial solution = 4) at 45°C and 1000°C are shown in Table 4. The great adsorption capacity and distribution coefficient values suggest that the metals are easily adsorbed onto clay minerals. Most distribution coefficients were higher at 45°C than at 1000°C. However, the distribution coefficients of Co, Ni and Cd in hydrobiotite were lower at 45°C than at 1000°C. The adsorption capacities of metals on hydrobiotite were high, except for Cs (Figs 3 & 4). It is possible that large amounts of heavy metals were adsorbed on natural and calcined hydrobiotite.
Distribution coefficients (Kd; L g–1) of the metals in the clay minerals (initial solution pH = 4).
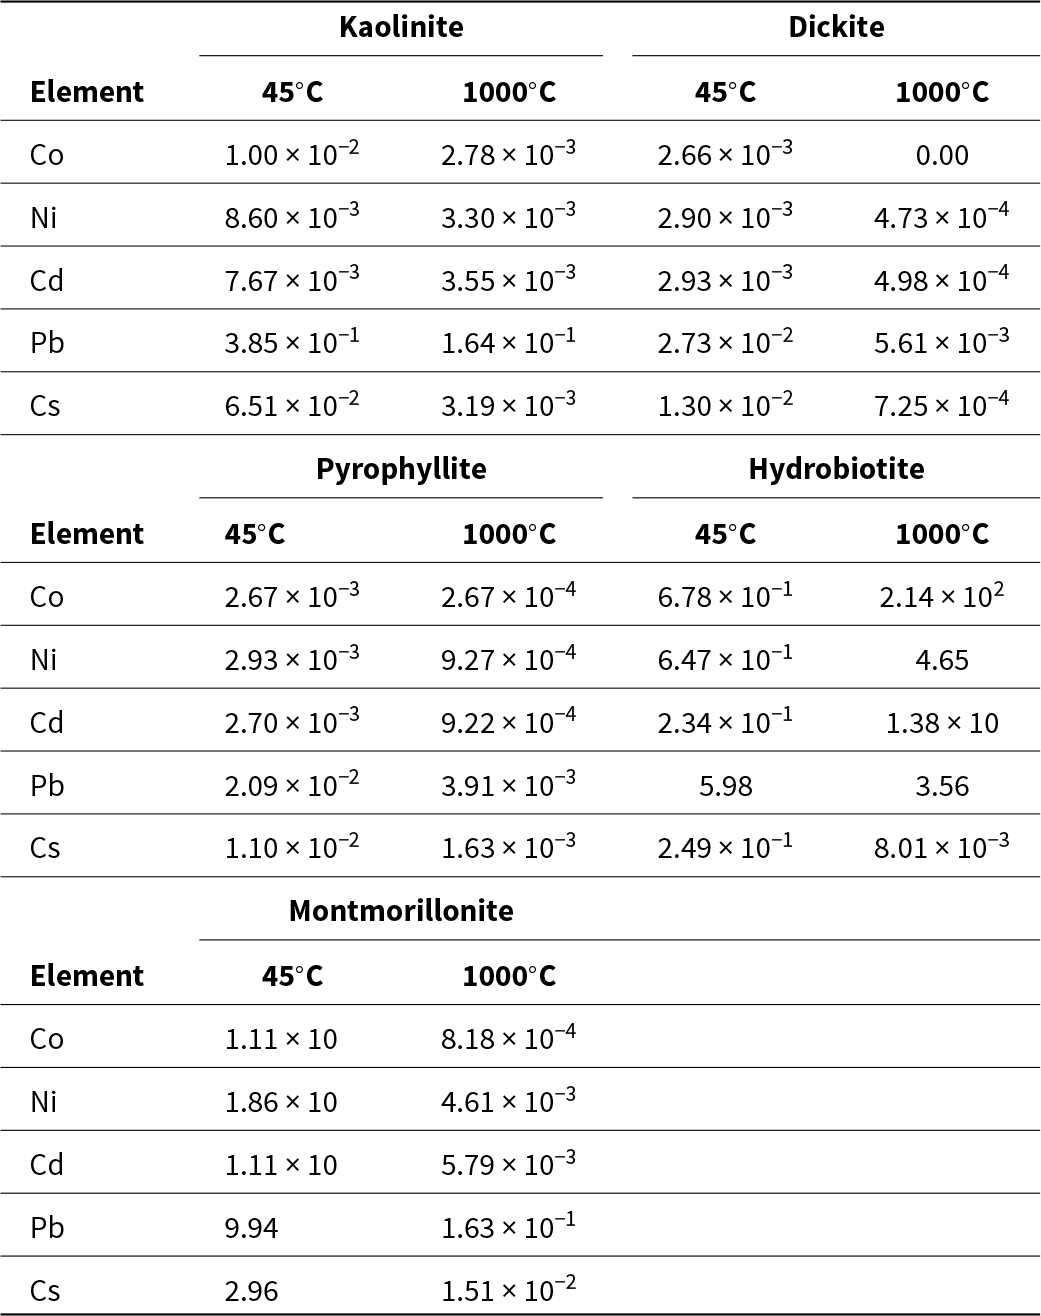
There was no relationship observed between the distribution coefficient and CEC. However, for montmorillonite, the distribution coefficient and CEC did change within the same temperature zone.
The adsorption sequence of the metals on kaolinite, dickite and pyrophyllite was Pb > Cs > Co, Ni, Cd for temperatures up to 800°C. The order of adsorption on the remaining clay minerals varied depending on the temperature range. However, the adsorption capacity for Pb was high regardless of calcination. Previous studies have reported the adsorption of heavy metals on clay minerals from aqueous solutions. For example, Jiang et al. (Reference Jiang, Jin, Lu and Chen2010) studied the adsorption of Pb, Cd, Ni and Cu from aqueous solutions on kaolinite and reported a selectivity sequence of Pb > Cd > Ni > Cu. Gu et al. (Reference Gu, Evans and Barabash2010) investigated the adsorption of Cd, Cu, Ni, Pb and Zn on montmorillonite and showed that the adsorption affinity of these metals onto montmorillonite was Pb > Cu > Ni, Zn, Cd. Furthermore, Bhattacharyya & Gupta (Reference Bhattacharyya and Gupta2008) studied the adsorption of Fe, Co and Ni on kaolinite and montmorillonite and recorded orders of adsorption of Fe > Co > Ni for kaolinite and of Fe > Co, Ni for montmorillonite. As a general trend, the higher the valence of cations and the larger the ionic radius, the easier it is for cations to be adsorbed on clay minerals, and the order of adsorption by ion exchange depends on the types of clay minerals and cations (Gier & Johns, Reference Gier and Johns2000; Bohli et al., Reference Bohli, Villaescusa and Ouederni2013).
In this study, the adsorption capacity for Pb was greater than that for the other elements, indicating that clay minerals have a high adsorption affinity for Pb, which is in accordance with previous studies.
Conclusions
The effects of the calcination of clay minerals on their adsorption capacities for heavy metals and Cs from aqueous solutions and on the physical and chemical characteristics of calcined clay minerals were studied according to CEC, BET SSA and XRD. The adsorbed water, the interlayer water and the structural water of clay minerals were lost due to calcination, and the temperatures at which these types of water were released differed among the clay minerals. The CEC and BET SSA values decreased at high temperatures. Kaolinite, dickite and montmorillonite had the lowest crystal order after heating at 800°C. The adsorption capacities of all of the clay minerals except hydrobiotite decreased due to calcination, and adsorption of heavy metals on hydrobiotite remained high even after heat treatment. The adsorption sequence of the metals on kaolinite, dickite, pyrophyllite and montmorillonite was Pb > Cs > Co, Ni, Cd after heating up to 800°C. The orders of adsorption on the clay minerals varied depending on the temperature and according to the adsorption capacity and the distribution coefficient.
In the future, it will be necessary to investigate the effects of porosity on the adsorption of clay minerals by calcination to determine how heat treatment influences the adsorption capacity of metals. In addition, it will also be necessary to obtain a relevant adsorption isotherm model to determine changes in adsorption characteristics at various temperatures.
Acknowledgements
The authors would like to thank K. Kuroki for technical assistance with the CEC measurements.
Competing interests
The authors declare none.



